Method Article
X-ray Powder Diffraction in Conservation Science: Towards Routine Crystal Structure Determination of Corrosion Products on Heritage Art Objects
W tym Artykule
Podsumowanie
Modern high resolution X-ray powder diffraction (XRPD) in the laboratory is used as an efficient tool to determine crystal structures of long-known corrosion products on historic objects.
Streszczenie
The crystal structure determination and refinement process of corrosion products on historic art objects using laboratory high-resolution X-ray powder diffraction (XRPD) is presented in detail via two case studies.
The first material under investigation was sodium copper formate hydroxide oxide hydrate, Cu4Na4O(HCOO)8(OH)2∙4H2O (sample 1) which forms on soda glass/copper alloy composite historic objects (e.g., enamels) in museum collections, exposed to formaldehyde and formic acid emitted from wooden storage cabinets, adhesives, etc. This degradation phenomenon has recently been characterized as "glass induced metal corrosion".
For the second case study, thecotrichite, Ca3(CH3COO)3Cl(NO3)2∙6H2O (sample 2), was chosen, which is an efflorescent salt forming needlelike crystallites on tiles and limestone objects which are stored in wooden cabinets and display cases. In this case, the wood acts as source for acetic acid which reacts with soluble chloride and nitrate salts from the artifact or its environment.
The knowledge of the geometrical structure helps conservation science to better understand production and decay reactions and to allow for full quantitative analysis in the frequent case of mixtures.
Wprowadzenie
Conservation science applies scientific (often chemical) methods in the conservation of artifacts. This includes investigations of the production of artifacts ('technical art history': How was it made at that time?) and their decay pathways as a prerequisite to develop proper conservation treatments. Oftentimes these studies deal with metal organic salts like carbonates, formates and acetates. Some of them have been deliberately manufactured using suitable compounds (e.g., vinegar), others derive from deterioration reactions with the atmosphere (carbon dioxide or carbonyl compounds from indoor air pollution)1. As a matter of fact, the crystal structures of many of these corrosion materials are still unknown. This is an unfortunate fact, since the knowledge of the geometrical structure helps conservation science to better understand production and decay reactions and to allow for full quantitative analysis in the case of mixtures.
Under the condition that the material of interest forms single crystals of sufficient size and quality, single crystal diffraction is the method of choice for the determination of the crystal structure. If these boundary conditions are not fulfilled, powder diffraction is the closest alternative. The biggest drawback of powder diffraction as compared to single crystal diffraction lies in the loss of the orientational information of the reciprocal d-vector d* (scattering vector). In other words, the intensity of a single diffraction spot is smeared over the surface of a sphere. This can be considered a projection of the three-dimensional diffraction (= reciprocal) space onto the one dimensional 2θ-axis of the powder pattern. As a consequence, scattering vectors of different direction but equal or similar length, overlap systematically or accidentally making it difficult or even impossible to separate these reflections2 (Figure 1). This is also the main reason why powder diffraction, despite its early invention just four years after the first single crystal experiment3,4, was mainly used for phase identification and quantification for more than half a century. Nevertheless, the information content of a powder pattern is huge as can be easily deduced from Figure 2. The real challenge, however, is to reveal as much information as possible in a routine way.
A crucial step towards this goal, without any doubt, was the idea from Hugo Rietveld in 19695 who invented a local optimization technique for crystal structure refinement from powder diffraction data. The method does not refine single intensities but the entire powder pattern against a model of increasing complexity, thus taking the peak overlap intrinsically into account. From that time on, scientists using powder diffraction techniques were no longer limited to data analysis by methods developed for single crystal investigation. Several years after the invention of the Rietveld method, the power of the powder diffraction method for ab-initio structure determinations was recognized. Nowadays, almost all branches of natural sciences and engineering use powder diffraction to determine more and more complex crystal structures, although the method can still not be regarded as routine. Within the last decade, a new generation of powder diffractometers in the laboratory was designed providing high resolution, high energy and high intensity. Better resolution immediately leads to better peak separation while higher energies fight absorption. The benefit of a better peak profile description based on fundamental physical parameters (Figure 3) are more accurate intensities of Bragg reflection allowing for more detailed structural investigations. With modern equipment and software even microstructural parameters like domain sizes and microstrain are routinely deduced from powder diffraction data.
All algorithms for crystal structure determination from powder diffraction data use single peak intensities, the entire powder pattern or a combination of both. The conventional single crystal reciprocal space techniques often fail due to an unfavorable ratio between available observations and structural parameters. This situation changed dramatically with the introduction of the "charge flipping" technique6 (Figure 4) and the development of global optimization methods in direct space, of which the simulated annealing technique7 (Figure 5) is the most prominent representative. In particular, the introduction of chemical knowledge into the structure determination process using rigid bodies or the known connectivity of molecular compounds concerning bond lengths and angles strongly reduces the number of necessary parameters. In other words, instead of three positional parameters for every single atom, only the external (and few internal) degrees of freedom of groups of atoms need to be determined. It is this reduction of structural complexity which makes the powder method a real alternative to single crystal analysis.
Two pioneering case studies of the authors8,9 proved that it is possible to solve complicated crystal structures of complex corrosion products using powder diffraction data. The superiority of the crystallographic studies compared to other approaches was demonstrated among others by the fact that in both cases the reported formulas had to be corrected after considering the solved crystal structures.
The occurrence of both materials under investigation in museums is related to their storage in wooden cabinets or exposed to other sources of carbonyl pollutants. The first material under investigation was sodium copper formate hydroxide oxide hydrate, Cu4Na4O(HCOO)8(OH)2∙4H2O (sample 1), which forms on soda glass/copper alloy composite historic objects (e.g., enamels) in museum collections, exposed to formaldehyde and formic acid from wooden storage cabinets, adhesives, etc. This degradation phenomenon has recently been characterized as "glass induced metal corrosion"10. For the second case study, thecotrichite, Ca3(CH3COO)3Cl(NO3)2∙6H2O (sample 2), was chosen. Thecotrichite is a frequently observed efflorescent salt forming needlelike crystallites on tiles and limestone museum objects, which are stored in oak cabinets and display cases. In this case, the wood acts as source for acetic acid which reacts with soluble chloride and nitrate salts from the artifact.
In the following part of the text, the individual steps of the structure determination process using powder diffraction data applied to corrosion products from conservation science are presented in detail.
Protokół
1. Sample Preparation
- Collection of material
- Carefully pick a small amount (less than 1 mg) of sample 1 under a digital microscope using a scalpel and tweezers from settings of opaque blue-green cabochons on a historic clasp, belonging to the collection of the Rosgartenmuseum Konstanz (RMK-1964.79) (Figure 6).
- Carefully scratch a few mg of sample 2 with a scalpel from the surface of a glazed ceramic tile, dating at early modern times, manufactured in Southern Germany, with size of 41 x 29 x 3.5 cm, and part of the collection of Landesmuseum Württemberg (no. E 3004) (Figure 7).
Note: The tile was stored from the 1980s until 2004 in wooden cupboards. The backside heavily suffers thecotrichite efflorescence occurring as a phase-pure product (Figure 7b).
- Preparation of the sample holders
- Grind both samples carefully with a pestle in a small agate mortar.
- Distribute sample 1, which consists of few agglomerated grains (<1 mg), between two thin X-ray transparent polyimide foils and mount them on a transmission sample holder with a central opening of 8 mm diameter. Fix the transmission sample holder on the θ-circle of the diffractometer.
- Fill sample 2 (approx. 5 mg) in a borosilicate glass capillary of 0.5 mm diameter.
- To do so, place a small amount of powder into the funnel of the capillary using a spatula. Then move the powder down to the tip of the capillary with the help of an electric vibrator. Compact the powder by placing the capillary in a thick walled glass tube and tap it manually on the desk.
- Continue until a filling height of about 3 cm is reached. Cut the glass capillary carefully at a height of approximately 4 cm using a thin corundum blade and seal the open end using a lighter.
- Place a small amount of beeswax in the opening of a brass pin and melt it using a soldering iron. Then place the capillary in the molten wax and keep it upright until solidification. Mount the brass pin on a goniometer head and fix the goniometer head on the θ-circle of the diffractometer.
- Finally, center the mounted capillary by iteratively aligning the four degrees of freedom of the goniometer head (two rotations using bending slides and two translations using XY translation stages) manually with a wrench supported by a digital camera projection superimposed with a cross hair.
2. Data Collection
- For the laboratory XRPD patterns of samples 1 (Figure 8) and 2 (Figure 9) at room temperature use a high-resolution powder diffractometer (with primary beam Johann-type Ge(111) monochromator for Cu-Kα1-radiation) which is equipped with a linear position sensitive silicon strip detector with an opening of approximately 12° 2θ.
- Measure sample 1 for 20 hr in the range from 5-85° 2θ with a step width of 0.015° 2θ in transmission mode (Scan mode: Transmission; Scan type: 2ThetaOmega; Omega mode: Moving; PSD Mode: Moving). Turn rotation on in order to achieve better particle statistics.
- Record sample 2 for a period of 6 hr covering the range 5-60° in 2θ with a step size of 0.015° in Debye-Scherrer mode (Scan mode: Debye Scherrer; Scan type: 2Theta; Omega mode: Stationary; PSD Mode: Moving). Turn rotation on in order to achieve better particle statistics.
3. Crystal Structure Determination and Refinement
Note: For the determination and refinement of the crystal structures of samples 1 and 2, a complex computer program is used11. It is either run by a graphical user interface or by text based input files. The latter make use of a sophisticated scripting language. Sample input files of the different stages of the structural analysis using sample 1 are listed in Tables S1, S2, S4-S8. The general procedure is identical for sample 2.
- Peak search
- Perform an automatic peak search using the first and second derivatives of Savitzky-Golay polynoms of low order (Figure 10) according to manufacturer’s protocol by setting the convolute range on the order of 1-1.5 times the full width at half maximum of the Bragg reflections (0.12° 2 θ for sample 1), adjusting the noise threshold to 1.5-2 times the estimated standard deviation (1.74 for sample 1) and limiting the search for that part of the powder patterns which show clearly distinguishable peaks (5-66° 2θ for sample 1) above the background.
- Start the program by double clicking the icon. Click Load Scan Files. Pull down menu Select X-Y data files (*.xy). Double click on 1-GNM-4145-P4-Kapton.xy.
- Expand range 1-GNM-4145-P4-Kapton.xy. Click Emission profile | Load Emission profile | CuK1sharp.lam.
- Click button Automatically insert peaks. Unclick Remove K-Alpha 2 Peaks. Set Peak Width with slide bar to 0.12. Set Noise Threshold with slide bar to 1.74. Press button Add Peaks. Press Close.
- Use the integrating property of the human eye and correct manually the automatically detected peaks by deleting non-Bragg peaks which obviously are due to counting statistics and adding peaks which are recognizable but hidden in the tails of other peaks. Set up indexing files with sets of 30 to 40 reflections for each sample using standard settings but allowing all crystal systems (Table S1).
- Zoom with mouse in the pattern, use mouse wheel to scroll. Open Peak Details window by pressing F3. Set peaks by pressing left mouse button. Delete peaks by pressing F9. Close Peak Details window.
- Click on Peaks Phase. Mark all peaks yellow by clicking on Position. Left click in the yellow marked column. Click Copy all/selection | Create Indexing range. Deselect range 1-GNM-4145-P4-Kapton.xy. Select range Indexing. Select all Bravais lattices (click Use to highlight the list and set a tick mark).
- Perform an automatic peak search using the first and second derivatives of Savitzky-Golay polynoms of low order (Figure 10) according to manufacturer’s protocol by setting the convolute range on the order of 1-1.5 times the full width at half maximum of the Bragg reflections (0.12° 2 θ for sample 1), adjusting the noise threshold to 1.5-2 times the estimated standard deviation (1.74 for sample 1) and limiting the search for that part of the powder patterns which show clearly distinguishable peaks (5-66° 2θ for sample 1) above the background.
- Indexing
- For indexing apply the “iterative use of singular value decomposition” algorithm12 (Table S2) until finding a primitive tetragonal unit cell for sample 1 and a primitive monoclinic lattice for sample 2 (see Table 1 for unit cell parameters).
- Press Run button (F6). Press Yes to keep indexing solutions. Press Solutions button. Highlight first solution by left clicking button 1. Right click on the highlighted (yellow) solution. Click Copy all/selection. Deselect range Indexing. Select range 1-GNM-4145-P4-Kapton.xy.
Note: Other unit cells showing a high figure of merit all have multiple volumes but higher numbers of unobserved reflections as compared to the ones listed in Table 1. The program automatically suggests the most probable space groups based on the observed reflection extinctions which is P42/n (86) for sample 1 and P21/a for sample 2 (Figure 11).
- Press Run button (F6). Press Yes to keep indexing solutions. Press Solutions button. Highlight first solution by left clicking button 1. Right click on the highlighted (yellow) solution. Click Copy all/selection. Deselect range Indexing. Select range 1-GNM-4145-P4-Kapton.xy.
- Confirm these findings manually by searching for extinctions using the International Tables of Crystallography Volume A13 (Table S3). Estimate the number of formula units per unit cell from average volume increments to Z = 8 for sample 1 and Z = 4 for sample 2.
- For indexing apply the “iterative use of singular value decomposition” algorithm12 (Table S2) until finding a primitive tetragonal unit cell for sample 1 and a primitive monoclinic lattice for sample 2 (see Table 1 for unit cell parameters).
- Whole powder pattern fitting
- Perform whole powder pattern fitting according to Pawley14 for both powder patterns. For the description of the peak profiles, use the fundamental parameter (FP) approach15 (Figure 12). Model the background by orthogonal Chebychev polynomials of higher order (typically 8) and an additional 1/X term describing the air scattering at low diffraction angles. Set the Lorenz-Polarization factor to 27.3 which is the Bragg angle for the Ge(111) monochromator using Cu-Kα1 radiation. Table S4 contains all relevant input parameters.
- Press Add hkl Phase. Expand range 1-GNM-4145-P4-Kapton.xy. Expand hkl_Phase. Click Indexing Details | Paste Indexing details. Click Background. Change Order to 8 (refine). Tick 1/X Bkg (refine).
- Click Instrument. Set Primary radius (mm) to 217.5. Set Secondary radius (mm) to 217.5. Tick Point detector. Tick Receiving Slit Width, value of 0.1 (fix). Tick Full Axial Model. Set Source length (mm) to 6 (fix). Set Sample length (mm) to 6 (fix). Set RS length (mm) to 6 (fix).
- Click Corrections. Tick Zero error, value to 0 (refine). Tick LP factor, value to 27.3 (fix). Click Miscellaneous. Set Conv. Steps to 2. Tick Start X, value 8. Tick Finish X, value 75. Click Peaks Phase | Delete Peaks Phase | Yes.
- Click hkl_Phase | Microstructure. Tick Cry Size L, value to 200 (refine). Tick Cry Size G, value to 200 (refine). Tick Strain L, value to 0.1 (refine). Tick Strain G, value to 0.1 (refine). Press Run button (F6).
- Create a list of Bragg peaks suitable for Charge Flipping6. Click hkl_Phase. Click Charge-Flipping output. Tick A file for CF, value CF.A. Tick hkl file for CF, value CF.hkl. Press Run button (F6). Pull down menu File | Export to INP file. File name, value Pawley.INP. Press Save.
Note: For the consecutive structure determination, keep all instrument, peak shape and lattice parameters fixed.
- Perform whole powder pattern fitting according to Pawley14 for both powder patterns. For the description of the peak profiles, use the fundamental parameter (FP) approach15 (Figure 12). Model the background by orthogonal Chebychev polynomials of higher order (typically 8) and an additional 1/X term describing the air scattering at low diffraction angles. Set the Lorenz-Polarization factor to 27.3 which is the Bragg angle for the Ge(111) monochromator using Cu-Kα1 radiation. Table S4 contains all relevant input parameters.
- Crystal Structure determination
Note: A combination of three methods (used in an iterative manner) is used to determine the crystal structures of samples 1 and 2.- Firstly, use the method of Charge Flipping6 supported by the inclusion of the tangent formula16 (Figure 13) to find the positions of most of the heavier atoms. Delete observed reflections with a d-spacing smaller than 1.28 (for sample 1) and extend the calculated sphere to a d-spacing of 0.9. All necessary parameters are listed in Table S5. Pick atoms with recognizable electron density from the resulting list, correct falsely assigned atom types of similar scattering power like carbon, oxygen or nitrogen manually.
- Pull down File File | Close All - Confirm by clicking Yes. Pull down Launch Launch | Launch Kernel.
- Pull down Launch Launch | Set INP File. Select CF.INP (prepared input text file, listed in Table S5). Confirm by clicking Open. Press Run button (F6). Press STOP button (F8) after approx. 20,000 cycles. Confirm Charge flipping finished by pressing Yes.
- Press Temporary output window displaying selected atoms in z-matrix format button. Press Cloud options dialog button. Set N to pick to 45. Tick With Symmetry. Press Pick button. Copy temporary output and save it to a text file called FirstGuess.str. Close the charge flipping graphics window.
- Secondly, apply the global optimization method of simulated annealing7,17 (Figure 14) to find the positions of all missing non-hydrogen atoms (mainly the carbon atoms of the formate/acetate groups). Use the automatic annealing scheme provided by the software. Subject only the scale factor and the positional and/or occupational parameters of selected atoms to simulated annealing. For sample 1, merge sodium and oxygen atoms within a radius of 1.1 Å to detect special positions (Table S6).
- Pull down Launch Launch | Set INP File. Select SA.INP (prepared input text file, listed in Table S6). Confirm by clicking Open. Press Run button (F6). Press STOP button (F8) after several thousand cycles. Confirm Update input file by pressing Yes.
- Thirdly, turn off simulated annealing and switch to Rietveld5 refinement mode by commenting out the command Auto_T(0.1). Fix all confirmed positional parameters. Include the calculation of a difference-Fourier map (Fobs-Fcalc) (Figure 15, Table S7) to check for unaccounted electron density. Include the additionally found atoms in the atom list and refine the atomic positions and occupancies.
- Pull down Launch Launch | Set INP File. Select Fourier_search_for_C.INP (prepared input text file, listed in Table S7). Confirm by clicking Open. Press Run button (F6). Inspect the two graphical output windows displaying the almost complete crystal structure and the difference Fourier map.
Note: Cycle the three structure solving methods iteratively in case of failure. If necessary, apply anti bumping constraints to light atoms (carbon and oxygen atoms) (see Table S7).
- Pull down Launch Launch | Set INP File. Select Fourier_search_for_C.INP (prepared input text file, listed in Table S7). Confirm by clicking Open. Press Run button (F6). Inspect the two graphical output windows displaying the almost complete crystal structure and the difference Fourier map.
- Firstly, use the method of Charge Flipping6 supported by the inclusion of the tangent formula16 (Figure 13) to find the positions of most of the heavier atoms. Delete observed reflections with a d-spacing smaller than 1.28 (for sample 1) and extend the calculated sphere to a d-spacing of 0.9. All necessary parameters are listed in Table S5. Pick atoms with recognizable electron density from the resulting list, correct falsely assigned atom types of similar scattering power like carbon, oxygen or nitrogen manually.
- Rietveld refinement
- For the final crystal structure refinements of samples 1 and 2, use the Rietveld whole-pattern refinement method5 (Figure 16). In order to avoid meaningless atomic shifts of atoms in the acetic acid and nitrate groups of sample 2, employ so called soft constraints (also called restraints) based on idealized bond lengths and angles. Calculate idealized positions of the missing hydrogen atoms using standard software18 (Table S8).
- Refine isotropic atomic displacement parameters for the non-hydrogen atoms of each crystal structure. In case of sample two, model the apparent anisotropy of the width of the Bragg reflections caused by microstrain by including symmetry adapted spherical harmonics of second order.
- Finally create plots of projections of the crystal structures of sample 1 (Figure 17) and sample 2 (Figure 18) and the two crystallographic information files (CIFs) which from now on can be used for full quantitative phase analysis. An example of such a full quantitative analysis is given in Figure 19 using the crystal structure of sample 1.
Wyniki
High resolution XRPD was used to determine the previously unknown crystal structures of two long-known corrosion products on historic objects. The samples were taken from two museum objects and carefully grinded before they were sealed in transmission and capillary sample holders (Figures 6, 7). Standard measurements using a state of the art laboratory high resolution powder diffractometer in transmission and Debye-Scherrer geometry using monochromatic X-rays were performed (Figure 8).
A standardized procedure for structure determination from powder diffraction data was developed using recently developed highly effective algorithms in the following order: Determination of peak positions (Figure 10), indexing and space group determination (Figure 11), whole powder pattern fitting (Figure 12), structure determination (Figures 13-15), and Rietveld refinement (Figure 16). Crystal structure determination of both compounds was performed by iteratively combining reciprocal (charge flipping) (Figure 13) and direct space (simulated annealing) (Figure 14) methods with difference-Fourier analysis (Figure 15).
The determination of the crystal structures of these compounds (Figures 17, 18) improves our understanding of the decay mechanisms and allows full quantitative phase analysis (Figure 19) of corrosion products.

Figure 1. Powder diffraction in reciprocal space. Illustration of the region of reciprocal space that is accessible in a powder diffraction measurement. The smaller circle represents the Ewald sphere. In a powder measurement the reciprocal lattice is rotated to sample all orientations. An equivalent operation is to rotate the Ewald sphere in all possible orientations around the origin of reciprocal space. The volume swept out (area in the figure) is the region of reciprocal space accessible in the experiment.2

Figure 2. Information content of a powder pattern. Schematic picture of the information content of a powder diffraction pattern with the four main contributions of background, peak position, peak intensity, and peak profile.2 Please click here to view a larger version of this figure.

Figure 3. Pawley fit. Pawley whole powder pattern fit of the powder pattern of a LaB6 standard measured with Mo-Kα1 radiation (λ = 0.7093 Å) from a Ge(220) monochromator in Debye-Scherrer geometry using the fundamental parameter approach. The following four convolutions have been applied: a pure Lorentzian emission profile, a hat shape function of the receiving slit in the equatorial plane, an axial convolution taking filament-, sample- and receiving slit lengths and secondary Soller slit into account, and a small Gaussian contribution related to the position sensitive detector.19 Please click here to view a larger version of this figure.
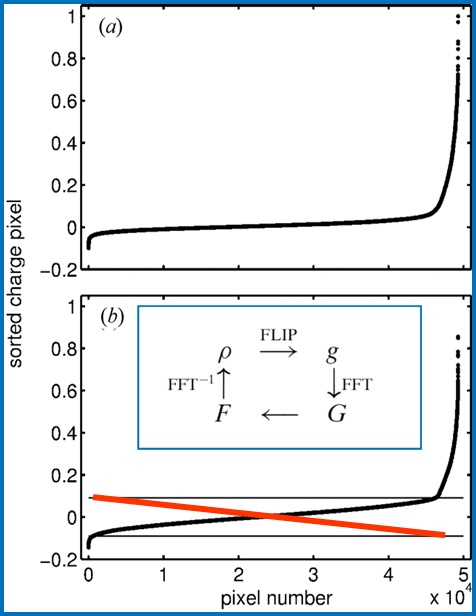
Figure 4. Charge flipping scheme. Flipping scheme and flow diagram (as inset) of the charge flipping procedure in reciprocal space used for structure determination from powder diffraction data.

Figure 5. Simulated annealing scheme. Flow diagram of a simulated annealing procedure in direct space used for structure determination from powder diffraction data.19

Figure 6. Origin of Sample 1. Historic art object carrying Cu4Na4O(HCOO)8(OH)2∙4H2O (sample 1). Historic clasp, belonging to the collection of the Rosgartenmuseum Konstanz (RMK-1964.79). Please click here to view a larger version of this figure.
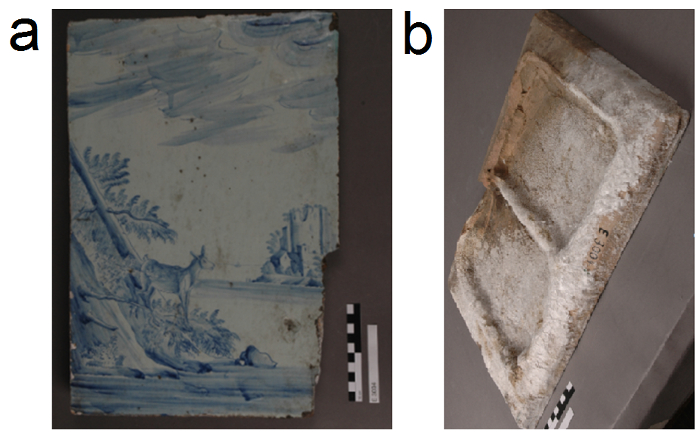
Figure 7. Origin of Sample 2. Historic art object carrying Thecotrichite (sample 2). Thecotrichite on a glazed tile from the collection of Landesmuseum Württemberg (a) and its backside (b) covered with white thecotrichite crystals.9 Please click here to view a larger version of this figure.
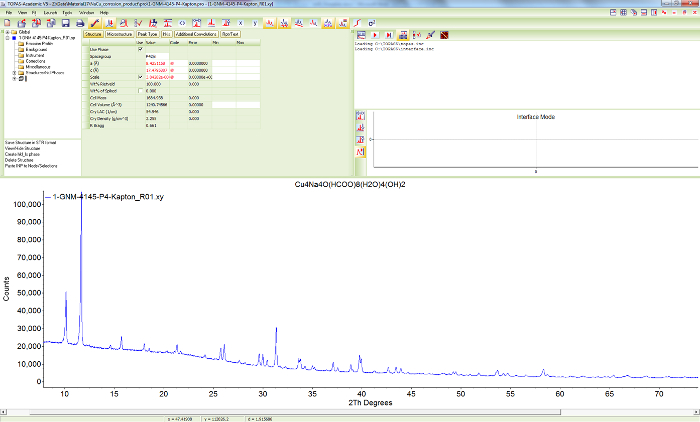
Figure 8. Powder diffraction pattern of sample 1. Screen shot showing the scattered X-ray intensities of Cu4Na4O(HCOO)8(OH)2∙4H2O (sample 1) at ambient conditions as a function of diffraction angle. Please click here to view a larger version of this figure.
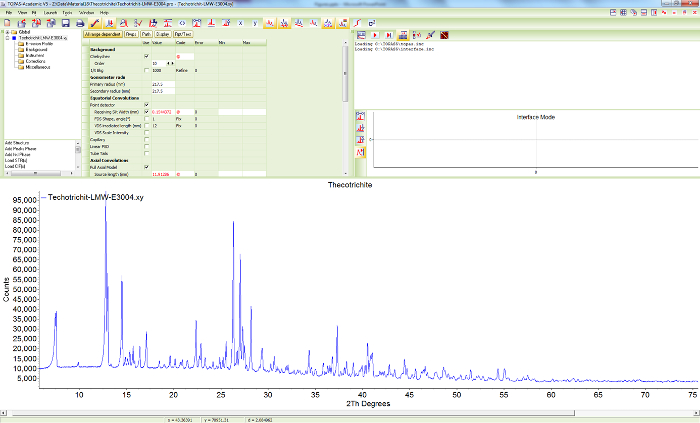
Figure 9. Powder diffraction pattern of sample 2. Screen shot showing the scattered X-ray intensities of thecotrichite (sample 2) at ambient conditions, as a function of diffraction angle. Please click here to view a larger version of this figure.
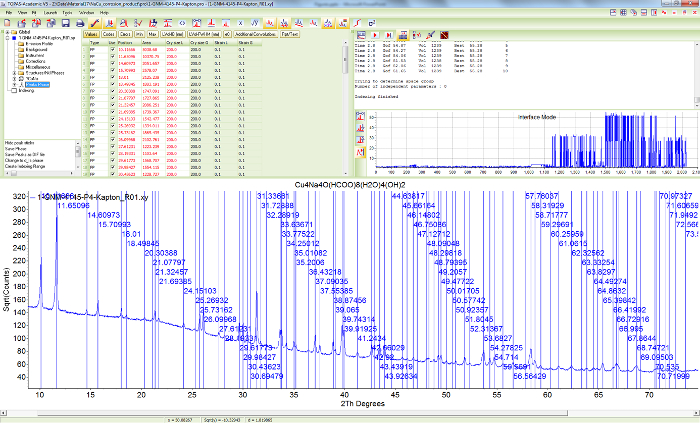
Figure 10. Peak search for sample 1. Screen shot showing the scattered X-ray intensities of Cu4Na4O(HCOO)8(OH)2∙4H2O and the results of the automatic peak search algorithm using first and second derivatives of Savitzky-Golay smoothing filters. Please click here to view a larger version of this figure.

Figure 11. Indexing results for sample 1. Screen shot showing the results of indexing and space group determination for Cu4Na4O(HCOO)8(OH)2∙4H2O. Please click here to view a larger version of this figure.
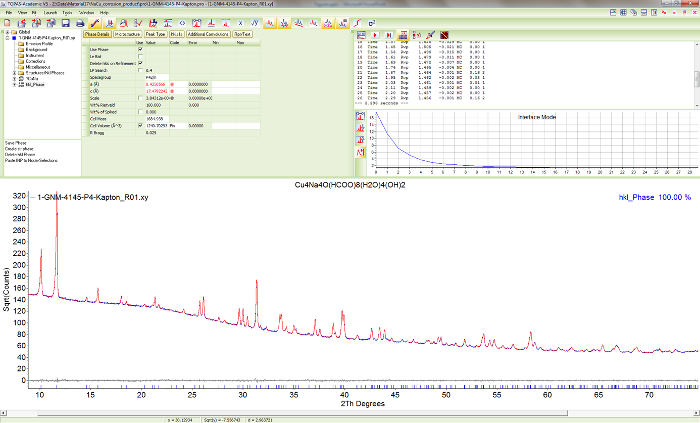
Figure 12. Pawley fit of sample 1. Screen shot showing the results of a Pawley fit of Cu4Na4O(HCOO)8(OH)2∙4H2O in the most probable space group P42/n. Please click here to view a larger version of this figure.

Figure 13. Charge flipping of sample 1. Screen shot during the structure determination process for Cu4Na4O(HCOO)8(OH)2∙4H2O in space group P42/n using the method of charge flipping with histogram matching. Part of the crystal structure with preassigned atom types is already visible. Please click here to view a larger version of this figure.
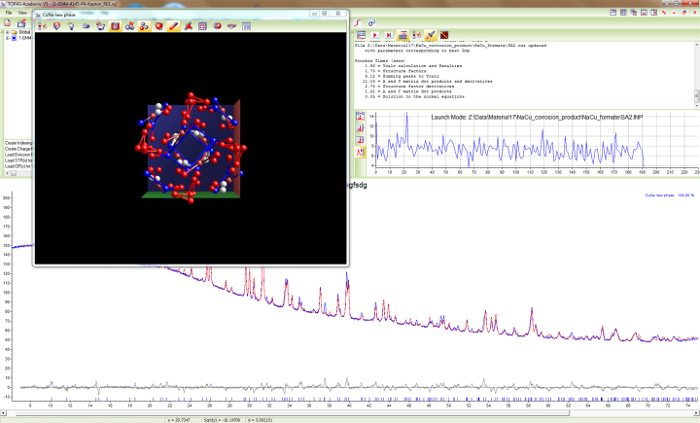
Figure 14. Simulated annealing for sample 1. Screen shot during the structure determination process for Cu4Na4O(HCOO)8(OH)2∙4H2O in space group P42/n using the global optimization method of simulated annealing. Part of the crystal structure is already visible. Please click here to view a larger version of this figure.
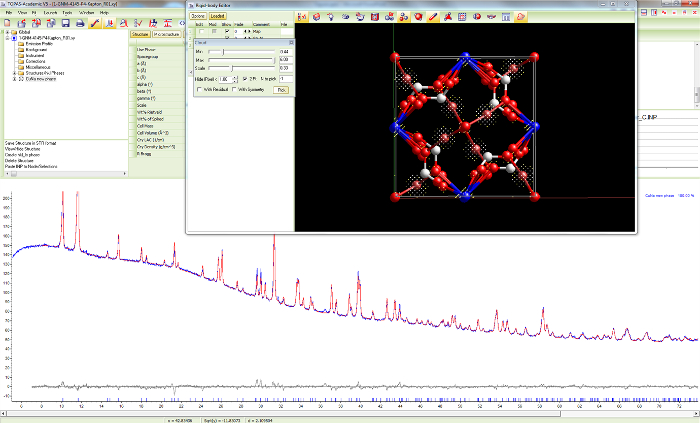
Figure 15. Difference Fourier analysis for sample 1. Screen shot of the search for missing atoms during the structure determination process for Cu4Na4O(HCOO)8(OH)2∙4H2O in space group P42/n using the difference Fourier method. The crystal structure as is and additional electron density is plotted. Please click here to view a larger version of this figure.

Figure 16. Rietveld fit of sample 1. Screen shot showing the Rietveld plot of Cu4Na4O(HCOO)8(OH)2∙4H2O in space group P42/n. The observed pattern (blue), the best Rietveld fit profiles (red) and the difference curve between the observed and the calculated profiles (below in grey) are shown. Please click here to view a larger version of this figure.

Figure 17. Crystal structure of sample 1. Projection of the crystal structure of Cu4Na4O(HCOO)8(OH)2∙4H2O along the crystallographic c-axis. Polyhedra containing copper and sodium as central atoms are drawn. Please click here to view a larger version of this figure.
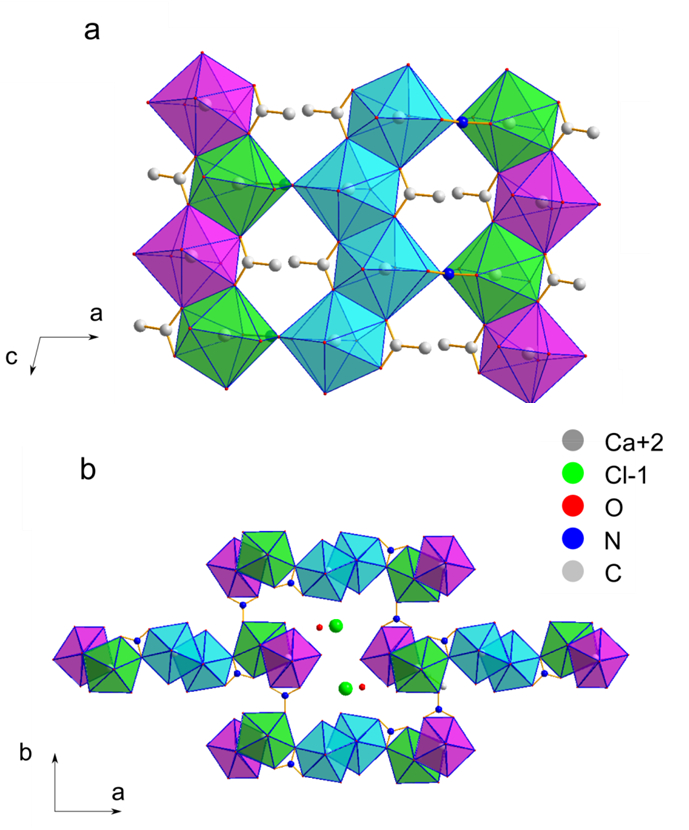
Figure 18. Crystal structure of sample 2. Projections of the crystal structure of thecotrichite, presented (a) along the c-axis and (b) along the b-axis. Polyhedra colors: Ca1: magenta, Ca2: cyan Ca3: green.8 Please click here to view a larger version of this figure.

Figure 19. Quantitative analysis containing sample 1. Rietveld plot of a full quantitative phase analysis from a corrosion sample containing Cu4Na4O(HCOO)8(OH)2∙4H2O as the main phase and Cu2(OH)3(HCOO) and Cu2O as minor phases. Please click here to view a larger version of this figure.
| Molecular formula | Cu4Na4O(HCOO)8(OH)2 · 4(H2O) | Ca3(CH3COO)3Cl(NO3)2 ∙ 6H2O |
| Sum formula | Cu4Na4O23C8H26 | Ca3Cl1O18N2C6H21 |
| Formula weight (g/mol) | 414.18 | |
| Crystal system | Tetragonal | Monoclinic |
| Space group | P42/n (86) | P21/a |
| Z | 8 | 4 |
| a / Å | 8.425109(97) | 23.5933(4) |
| c / Å | 17.47962(29) | 13.8459(3) |
| c / Å | 17.47962(29) | 6.8010(1) |
| β [°] | - | 95.195(2) |
| V / Å3 | 1240.747(35) | 2212.57(7) |
| Temperature (K) | 298 | 303 |
| r (calc.) / g cm-3 | 2.255 | |
| Wavelength (Å) | 1.54059 | 1.54059 |
| R-exp (%) | 1.042 | 1.595 |
| R-p (%) | 1.259 | 3.581 |
| R-wp (%) | 1.662 | 4.743 |
| R-Bragg (%) | 0.549 | 3.226 |
| Starting angle (° 2θ) | 5 | 5.5 |
| Final angle (° 2θ) | 75 | 59 |
| Step width (° 2θ) | 0.015 | 0.015 |
| Time/scan (hr) | 20 | 6 |
| No. of variables | 70 | 112 |
Table 1. Selected crystallographic and structural details of Cu4Na4O(HCOO)8(OH)2∙4H2O and Ca3(CH3COO)3Cl(NO3)2∙6H2O (thecotrichite).
Supplementary Tables
Table S1. Input file after peak search of Cu4Na4O(HCOO)8(OH)2∙4H2O (only 1 peak is shown in the peak list). Please click here to download this file.
Table S2. Input file for indexing of Cu4Na4O(HCOO)8(OH)2∙4H2O. Please click here to download this file.
Table S3. List of reflection conditions for tetragonal space groups from the International Tables for Crystallography Volume A. Please click here to download this file.
Table S4. Input file for whole powder pattern fitting according to the Pawley method of Cu4Na4O(HCOO)8(OH)2∙4H2O (only few Bragg reflections are shown in the peak list). Please click here to download this file.
Table S5. Input file for charge flipping of Cu4Na4O(HCOO)8(OH)2∙4H2O. Please click here to download this file.
Table S6. Input file for simulated annealing of Cu4Na4O(HCOO)8(OH)2∙4H2O. Please click here to download this file.
Table S7. Input file for difference Fourier analysis of Cu4Na4O(HCOO)8(OH)2∙4H2O. Please click here to download this file.
Table S8. Input file for the final Rietveld refinement of Cu4Na4O(HCOO)8(OH)2∙4H2O. Please click here to download this file.
Dyskusje
XRPD is a suitable technique for conservation research as it is non-destructive, fast and easy-to-use. XRPD data can be used in routine qualitative analysis, owing to the fact that the powder pattern is a fingerprint signature to the corresponding crystal structure. The biggest advantage of XRPD over other analytic techniques is the ability of performing simultaneous qualitative and quantitative analysis of crystalline constituents in mixtures by using the Rietveld refinement method5. Moreover, the presence of amorphous content can be detected and its amount estimated. However, this procedure requires knowledge on every crystal structure present in the mixture that is a subject to investigation.
To apply the method of XRPD routinely for structure determination to conservation science, several critical boundary conditions for the laboratory powder diffractometer must be fulfilled: 1.) To avoid preferred orientation in powder samples, transmission or even better Debye-Scherrer geometry must be used. 2.) Laboratory powder diffractometers should be equipped with a primary beam monochromator to ensure strict monochromatization and a position sensitive strip detector for high intensity (= good counting statistics) and high resolution. This particular type of instrument leads to sharp peak profiles which can be adequately described by few fundamental parameters being of great benefit for the separation of overlapping reflections.
Indexing of the powder pattern which is often regarded as the bottleneck in the structure determination process should be done with exhaustive methods like "singular value decomposition", which is also insensitive to small amounts of impurities. Due to the strongly reduced information content of a powder pattern as compared to a single crystal data set, a sophisticated combination of direct and reciprocal space structure determination algorithms is needed for a high success rate. The combination of charge flipping, simulated annealing and difference-Fourier analysis has been proven to be among the most promising approaches. Providing that the material under investigation is reasonably crystalline, crystal structures with 20-25 structural parameters can nowadays been solved almost routinely from powder diffraction data if the procedure described above is used. It can be expected that this limit can be pushed to much more complex crystal structures with the advent of better instrumentation, the use of synchrotron radiation, and even more sophisticated structure determination algorithms.
Even after 250 (!) years of conservation research and 100 years of crystal structure analysis, there are still many crystalline corrosion products on artifacts of unknown exact composition and structure. This is mainly due to the unavailability of naturally or synthetically grown single crystals of suitable size. XRPD data analysis as described here can overcome this restriction since powder samples are amenable to investigation. A quantum leap forward in Conservation Science as well as in other fields!
Ujawnienia
The authors have nothing to disclose.
Podziękowania
The authors gratefully acknowledge Ms. Christine Stefani for performing the XRPD measurements. Marian Schüch and Rebekka Kuiter (State Academy of Art and Design Stuttgart) are acknowledged for the pictures of the tile (Fig. 7).
Materiały
| Name | Company | Catalog Number | Comments |
| Stadi-P | Stoe & Cie GmbH | Powder Diffractometer | |
| Mythen 1-K (450 μm) | Dectris Ltd. | Position Sensitive Detector | |
| Mark tube borosilicate glass No. 50, 0.5 mm diameter | Hilgenberg GmbH | 4007605 | Low absorbing capillaries |
| Topas 5.0 | Bruker AXS Advanced X-ray Solutions GmbH | Powder Diffraction Evaluation Software |
Odniesienia
- Bradley, S. M. . The interface between science and conservation, Occacional Paper 116. , (1997).
- Dinnebier, R. E., Billinge, S. J. L. . Powder Diffraction:Theory and Practice. , (2008).
- Debye, P., Scherrer, P. Interferenzen an regellos orientierten Teilchen im Roentgenlicht. Phys. Zeit. 17, 277-283 (1916).
- Hull, A. W. A New Method of X-Ray Crystal Analysis. Phys. Rev. 10 (6), 661-696 (1917).
- Rietveld, H. M. A profile refinement method for nuclear and magnetic structures. J. Appl. Cryst. 2, 65-71 (1969).
- Oszlanyi, G., Suto, A. Ab initio structure solution by charge flipping. Acta Crystallogr. Sect. A. 60 (2), 134-141 (2004).
- Newsam, J. M., Deem, M. W., Freeman, C. M., Prince, E., Stalick, J. K. Direct Space Methods of Structure Solution from Powder Diffraction Data. NIST Special Publication 864: Accuracy in Powder Diffraction II: Proceedings of the International Conference May 26-29, 1992. , 80-91 (1992).
- Dinnebier, R. E., Runčevski, T., Fischer, A., Eggert, G. Solid-State Structure of a Degradation Product Frequently Observed on Historic Metal Objects. Inorg. Chem. 54 (6), 2638-2642 (2015).
- Wahlberg, N., et al. Crystal Structure of Thecotrichite, an Efflorescent Salt on Calcareous Objects Stored in Wooden Cabinets. Cryst. Growth Des. 15 (6), 2795-2800 (2015).
- Eggert, G., Fischer, A. Gefährliche Nachbarschaft: Durch Glas induzierte Metallkorrosion an Museums-Exponaten - Das GIMME-Projekt. Restauro. 1, 38-43 (2012).
- . . TOPAS (current version 5.0). , (2015).
- Coelho, A. A. Indexing of powder diffraction patterns by iterative use of singular value decomposition. J. Appl. Crystallogr. 36 (1), 86-95 (2003).
- . . International Tables for Crystallography Volume A: Space-group symmetry. , (2006).
- Pawley, G. S. Unit-cell refinement from powder diffraction scans. J. Appl. Crystallogr. 14, 357-361 (1981).
- Cheary, R. W., Coelho, A. A., Cline, J. P. Fundamental Parameters Line Profile Fitting in Laboratory Diffractometers. J. Res. Natl. Inst. Stand. Technol. 109 (1), 1-25 (2004).
- Karle, J., Hauptman, H. A theory of phase determination for the four types of non-centrosymmetric space groups 1P222, 2P22, 3P12, 3P22. Acta Crystallogr. 9, 635-651 (1956).
- Coelho, A. A. Whole-profile structure solution from powder diffraction data using simulated annealing. J. Appl. Crystallogr. 33 (3), 899-908 (2000).
- Macrae, C. F., et al. Mercury: visualization and analysis of crystal structures. J. Appl. Crystallogr. 39 (3), 453-457 (2006).
- Mittemeijer, E. J., Welzel, U. . Modern Diffraction Methods. , (2012).
Przedruki i uprawnienia
Zapytaj o uprawnienia na użycie tekstu lub obrazów z tego artykułu JoVE
Zapytaj o uprawnieniaThis article has been published
Video Coming Soon
Copyright © 2025 MyJoVE Corporation. Wszelkie prawa zastrzeżone