Propulsion and Thrust
Обзор
Source: Alexander S Rattner; Department of Mechanical and Nuclear Engineering, The Pennsylvania State University, University Park, PA
Aircraft, rockets, and ships produce propulsion by accelerating surrounding fluid or high temperature combustion products to high velocity. Because of the principle of conservation of momentum, the increased fluid velocity results in an effective thrust force on the vehicle. The thrust capabilities of propulsion systems are often measured with static thrust tests. In these tests, propulsion systems are mounted and operated on fixed, instrumented platforms, and the holding force on the mounts is measured as the thrust
In this experiment, a small-scale static thrust measurement facility will be constructed and modeled. The thrust curves for two model aircraft motors and propeller systems and a computer cooling fan will be measured. Thrust efficiencies will also be evaluated (thrust force / electrical power input). Measured thrust values will be compared with theoretical predictions based on measured air velocities.
Принципы
Open-operation fluid propulsion mechanisms, such as boat props, airplane propellers, or fanjet aircraft engines produce thrust by accelerating ambient fluid to a high velocity. During operation, such devices draw in intake fluid from a large upstream area, and exhaust it downstream as a narrow high velocity jet (Fig. 1). The exhaust area is approximately equal to the propeller face air. Mass and momentum flow rate balances over the control volume including the upstream intake and exhaust jet yield the following results:
 (1)
(1)
 (2)
(2)
Here,  is the mass flow rate, ρ is the fluid density, A is the flow area, U is the fluid velocity, and T is the resulting thrust force. As shown in Fig. 1, the intake area is much greater that the exhaust jet area and the inlet and outlet densities are approximately equal. As such, the exhaust velocity must be much greater than the inlet velocity (
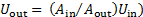 , and the inlet momentum flow rate is negligible (
 ). The theoretical resulting thrust is:
 (3)
(3)
The thrust from model aircraft propulsion systems is relatively small, less than 0.1 N in many cases. To enable measurement of these forces, a lever-arm based test stand will be constructed here (Fig. 2a). The test stand structure pivots on a low-friction bearing such that the torque from the propeller at the end of one arm (length Lprop from bearing axis to center of motor) balances the torque from a digital scale depressed by a shorter moment arm (Lscale). This configuration amplifies the thrust force on the scale to yield more accurate readings. If the scale is tared (zeroed) when the propeller is turned off, than the measured thrust during propeller operation can be determined with Eqn. 4. Here, m is the mass reading on the scale.
 (4)
(4)
The electrical power supplied to the propeller or fan can be determined as  , where I is the current (in amps) and V is the voltage. A thrust efficiency can be defined as
  (in Newtons per Watt).

Figure 1: Control volume for flow through a fluid propulsion device
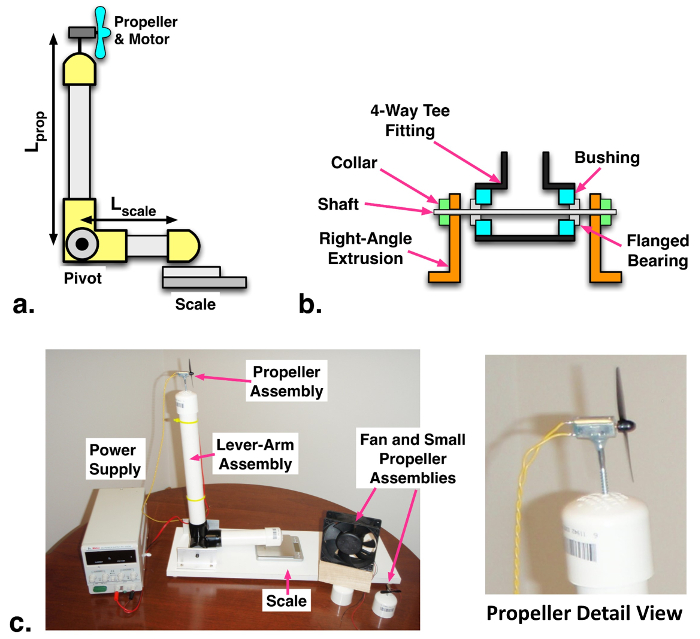
Figure 2: a. Schematic of static thrust test facility. b. Detail view of pivot assembly. c. Photograph of experimental facility.
Процедура
1. Fabrication of static thrust test system (see schematics and photograph, Fig. 2)
- Form two cylindrical bushings on a lathe with outer diameter 42.16 mm, length ~10 mm, and bore through the center axis of 9.50 mm.
- Press one flanged ball bearing into the bore on each bushing. Insert the bushings flush into the two parallel ports of the 4-way tee fitting, with the bearings on the outside. The bushings should fit snugly in the tee fitting. (See the pivot assembly schematic in Fig. 2b.
- Cut two 100 mm long lengths of the aluminum right-angle extrusion. Drill a 3.2 mm hole in the middle of the longer side of the extrusions, ~45 mm up from the base. Drill two mounting holes near the ends of the shorter sides of the extrusion.\
- Insert the shaft through the two bearings in the 4-way tee fitting. Even lengths should be exposed on each end. Slide the right-angle extrusions onto the exposed shaft ends. Screw the right angle extrusion to the work surface through the mounting holes. Install the shaft collars on the exposed ends of the shaft to keep the assembly centered between the right-angle brackets.
- Cut short (~18 mm) and long (~36 cm) lengths of 42.16 mm outer diameter PVC pipes. Insert the short length into the horizontal port on the 4-way tee fitting, and the long length into the vertical port. Insert a pipe cap on the end of the horizontal length.
- Position a precision digital scale (±0.1 or ±0.01 g recommended) under the horizontal pipe arm cap.
- Mount the propeller motors and fan on pipe caps. The propellers should be offset so that the caps do not block the airflow. It is recommended that the propeller motors are glued to the heads of thin screws installed on pipe caps (Fig. 2c).
2. Performing experiments
- Mount the smallest propeller and motor pipe cap onto the vertical pipe arm.
- Record the distances (moment arms) from the pivot axis to the propeller motor axis (Lprop) and from the pivot axis to the contact point of the horizontal arm on the scale.
- Connect the propeller motor to a variable voltage DC power supply (turned off).
- Turn on the scale, and tare (zero) the reading.
- Turn on the power supply and vary the voltage in ~0.4 V increments up to 3.8 V. For each case, record the voltage, supplied current, scale reading (in grams), and scale range during steady operation (typically oscillates by ~0.3 - 5.0 g). It may be necessary to tap the propeller blade to start it spinning. Ensure that the airflow is in the right direction (flowing toward the rear of the motor). If not, reverse the positive and negative leads on the power supply.
- If available, use a thermal anemometer to measure the air velocity just behind (downstream) the propeller at a few conditions. The velocity varies over the propeller face area, so this is only an order-of-magnitude measurement.
- Repeat Steps 2.1 - 2.6 for the other motor and propeller and the PC cooling fan. The fan can operate up to 12 V.
3. Analysis
- Using Eqn. 4, calculate the propeller and fan thrusts (T) for each measured case. The major source of uncertainty is the variation/oscillation in the scale reading during operation. Substitute this range (Step 2.5) for m in Eqn. 4 to determine the thrust uncertainty.
- For each case, compute the input power . The uncertainty can be estimated as
 , where ΔI and ΔV are the current and voltage measurement uncertainties (0.005 A and 0.005 V here).
 - For each case compute the thrust efficiency
 . The uncertainty for thrust efficiency would be
  .
. - Compare the measured thrusts with estimated theoretical values using the anemometer velocities (Eqn. 3). Here the outlet area can be estimated as the propeller/fan face area, less the hub or motor area:
 . How do these compare with measured values?
Результаты
In Fig. 3a, the thrust vs. power curves are presented for the three propulsion devices evaluated in this experiment. The fan achieves the highest thrust, reaching 0.68 ± 0.02 N at 11.83 ± 0.08 W input power. The smaller propeller produces slightly more thrust per input power than the larger propeller, but reaches its maximum operating voltage at 2.66 ± 0.04 W. Fig. 3b presents the thrust efficiency for the three devices. For the small propeller and fan, the efficiency generally decreases with increasing power input. The efficiency of the larger propeller is relatively constant at η ~ 0.03 N W-1.
Theoretical thrust values based on measured outlet velocities are compared with directly measured thrust values in Table 1. For these cases, the measured velocities vary over the propeller/fan face areas, so velocity and predicted thrust ranges are reported, rather than single values. In general, reasonable agreement is found between predicted and measured values, which provides confirmation for the theory outlined in the Principles section. However, measured velocity ranges were quite wide in some cases, so this analysis should be is only qualitative.

Figure 3: (a) Thrust and (b) thrust efficiency curves for the three studied propulsion devices.
| Propulsion device (Aout) | Power Input (W) | Outlet Velocity Range (m s-1) | Predicted Thrust Range (N) | Measured Thrust (N) |
| Small Propeller (0.0016 m2) |
0.49 ± 0.02 | 3.0 – 5.0 | 0.017 – 0.048 | 0.034 ± 0.005 |
| 1.56 ± 0.03 | 4.0 – 6.2 | 0.030 – 0.073 | 0.068 ± 0.005 | |
| Large Propeller (0.0042 m2) |
0.73 ± 0.03 | 2.0 – 3.0 | 0.020 – 0.045 | 0.020 ± 0.004 |
| 2.39 ± 0.05 | 4.0 – 5.0 | 0.080 – 0.125 | 0.066 ± 0.004 | |
| PC Cooling Fan (0.0077 m2) |
2.16 ± 0.03 | 4.0 – 5.5 | 0.145 – 0.275 | 0.180 ± 0.007 |
| 9.98 ± 0.07 | 8.0 – 8.4 | 0.581 – 0.641 | 0.593 ± 0.014 |
Table 1 - Comparison of predicted thrusts based on measured outlet velocity ranges with directly measured thrusts.
Заявка и Краткое содержание
This experiment introduced the basic operating principles of fluid propulsion devices found in aircraft and watercraft. A static thrust test platform was constructed to measure the propulsion capability of model aircraft propellers and a pc cooling fan. The resulting thrusts and propulsion efficiencies (thrust per input power) were measured and compared. Theoretical thrust values were also estimated based on downstream jet velocities. Measurement and rating of propulsion system performance, as demonstrated here at small scales, is a key stage in fluid propulsion system development, and is critical to ensuring engines deliver required thrust levels.
Fluid propulsion systems are employed in nearly all aircraft and watercraft. In the configuration considered here, upstream ambient fluid is accelerated to a high velocity downstream jet, also at ambient pressure. In devices such as HVAC air handlers, air compressors, or steam power plant liquid pumps, a significant portion of input work is supplied to pressurize fluid rather than just to increase flow velocity. However, the same general principles of analysis can be applied, based on control volume mass and momentum flow balances. Devices such as wind turbines and steam turbines also operate on similar principles, but extract momentum and energy from fluid flow to produce mechanical and electrical power.
Перейти к...
Видео из этой коллекции:

Now Playing
Propulsion and Thrust
Mechanical Engineering
21.6K Просмотры

Buoyancy and Drag on Immersed Bodies
Mechanical Engineering
29.9K Просмотры

Stability of Floating Vessels
Mechanical Engineering
22.4K Просмотры

Piping Networks and Pressure Losses
Mechanical Engineering
58.0K Просмотры

Quenching and Boiling
Mechanical Engineering
7.7K Просмотры

Hydraulic Jumps
Mechanical Engineering
40.9K Просмотры

Heat Exchanger Analysis
Mechanical Engineering
28.0K Просмотры

Introduction to Refrigeration
Mechanical Engineering
24.6K Просмотры

Hot Wire Anemometry
Mechanical Engineering
15.5K Просмотры

Measuring Turbulent Flows
Mechanical Engineering
13.5K Просмотры

Visualization of Flow Past a Bluff Body
Mechanical Engineering
11.8K Просмотры

Jet Impinging on an Inclined Plate
Mechanical Engineering
10.7K Просмотры

Conservation of Energy Approach to System Analysis
Mechanical Engineering
7.4K Просмотры

Mass Conservation and Flow Rate Measurements
Mechanical Engineering
22.6K Просмотры

Determination of Impingement Forces on a Flat Plate with the Control Volume Method
Mechanical Engineering
26.0K Просмотры
Авторские права © 2025 MyJoVE Corporation. Все права защищены