
Hot Wire Anemometry
Обзор
Source: Ricardo Mejia-Alvarez and Hussam Hikmat Jabbar, Department of Mechanical Engineering, Michigan State University, East Lansing, MI
Hot-wire anemometers have a very short time-response, which makes them ideal to measure rapidly fluctuating phenomena such as turbulent flows. The purpose of this experiment is to demonstrate the use of hot-wire anemometry.
Принципы
The hot-wire anemometer
A hot-wire anemometer is a device used to measure flow velocity based on the heat dissipated from a very thin electrically-heated wire. The heat generated by an electric wire, , is given by the relationship:
 (1)
(1)
Where  denotes the wire's electric resistance and
  the electric current flowing through the wire. The electric resistance depends on the wire's temperature according to the following relationship:
 (2)
(2)
Where  is the wire resistance at the reference temperature
  and
and  is a constant that depends on the material of the wire. While equation (1) expresses the heat generated by the electric current, the heat dissipated by the flow, follows King's law [2]:
 (3)
(3)
Here, ,
, , and
, and  are calibration constants and
  is the flow velocity around the wire. The value of n depends on the Reynolds number, and it has already been found that
  is satisfactory for the range of Reynolds numbers achievable in this particular experiment. To obtain a relationship between temperature, electrical current, and velocity, we combine equations (1) and (3):
 (4)
(4)
Here, the temperature dependence enters through the electrical resistance (equation (2)). The measurement strategy that we will use in the current experiment is to maintain the temperature (and hence the resistance) of the wire constant. From equation (4), it is clear that if the electrical resistance is constant, the current needs to fluctuate to follow the tendency of the velocity. In other words, cooling rate changes with flow velocity, and that would change the wire's temperature unless the current is changed to compensate. Obviously, it is necessary to have a quick responding electric system to measure a rapidly varying velocity signal. This is achieved with a Wheatstone bridge like the one shown in Figure 1(A). From the figure, the hot-wire is one of the four resistors in the circuit. Figure 1(B) shows its physical configuration, which is a very thin wire set between two prongs (a 5 μm tungsten wire for the current experiment). The control resistor,  , from Figure 1(A) is adjusted initially to produce a zero bridge-voltage,
  , for the desired baseline temperature (ergo electrical resistance) of the hot-wire. When in operation, the bridge-voltage is used as a feedback signal to increase or decrease the current to the wire in order to maintain the hot-wire at a constant temperature. On the other hand,, is amplified to achieve an easier-to-read voltage scale,
 . This voltage is related to the current through Ohm's law:
 (5)
(5)
Hence, equation (4) can be expressed in terms of the voltage as:
 (6)
(6)
With the calibrations constants now defined as: ![]() and
and  . The main purpose of this experiment is to find the value of these calibration constants. To this end, the hot-wire probe will be set in a reference flow system. This flow system will be used to issue several flows with known velocities. Then, the calibration constants will be found using a least-squares regression.
As shown in the schematic of Figure 2, the reference flow to use herein is the vena contracta of a free jet. The mean velocity at the vena contracta is well characterized by the following equation [3, 4, 5]:
 (7)
(7)
Here, the constant 0.61 is the discharge coefficient of the jet, is the pressure inside the plenum, and
  is the atmospheric pressure. The position of the vena contracta is well defined by the relationship:
 (8)
(8)
Where  is the distance from the jet exit along its centerline and
  is the width of the slit from where the jet is issued. This is the location where the hot-wire anemometer will be located for its calibration. Figures 3 and 4 show the flow system used herein. In this system, a fan pressurizes a plenum that has two exits, a slit to produce the jet, and a stack to divert the flow. As the flow through the stack is restricted with orifice plates (see Figure 4 for reference), the flow rate of the jet increases. This setup will help us producing a scatter plot of
  and the voltage measured at the Wheatstone bridge.

Figure 1. Schematic of the planar jet showing: the vena contracta and the diagram of connections. Please click here to view a larger version of this figure.
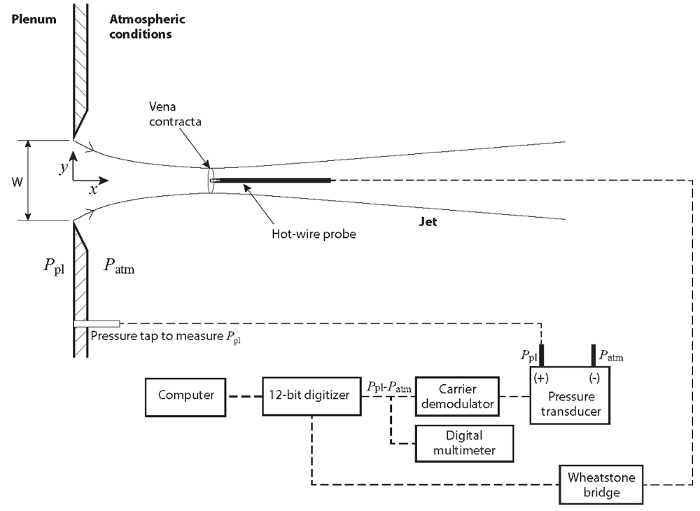
Figure 2. Experimental setup. (A): flow facility; the plenum is pressurized by means of a centrifugal fan. (B): slit for issuing the planar jet. (C): traversing system to change the position of the anemometer along the jet. Please click here to view a larger version of this figure.
Процедура
- Measure the width of the slit, W, and record this value in table 1.
- Verify that the data acquisition system follows the schematic in Figure 2.
- Connect the positive port of the pressure transducer (see Figure 2 for reference) to the plenum pressure tap ().
- Leave the negative port of the pressure transducer open to the atmosphere. Hence, the reading of this transducer will be directly
 ; as required by equation (7).
 - Start the program for hot-wire calibration. Set the sample rate at 100 Hz for a total of 1000 samples (i.e. 10s of data).
- Make sure that channel 0 in the data acquisition system corresponds to the voltage of the hot-wire anemometer.
- In the field corresponding to channel 0, select the value of the constant to 0.45.
- Set the hot-wire anemometer at the position of the vena contracta (on the centerline, at x = 1.5 W).
- Make sure that channel 1 in the data acquisition system corresponds to the signal of the pressure transducer.
- Enter the values of local air density (typically 1.2 kg/m3 for average local conditions) and conversion constant from volts to pressure (76.75 Pa/V) in the fields corresponding to the pressure transducer. Record these values in table 1. With this, the data acquisition system will report the data directly in velocity in m/s according to equation (7).
- Cover the stack completely to establish the condition for maximum velocity at the jet.
- Turn on the flow facility.
- Acquire a dataset.
- Change the stack plate for one with a lower restriction (larger diameter)
- Acquire a dataset.
- Repeat steps 1.15 and 1.16 for a total of at least four times. Make sure that the last repetition is carried out with the stack fully unrestricted (lowest jet velocity).
- The data acquisition program will carry out the least-squares calculation and report the calibration constants automatically. Record these values on table 1.
Table 1. Basic parameters for experimental study.
| Parameter | Value |
| Slit width (W) | 19.05 (mm) |
| Air density (r) | 1.2 (kg/m3) |
| Transducer calibration constant (m_p) | 76.75 (Pa/V) |
| Calibration constant A | 5.40369 (V2) |
| Calibration constant B | 2.30234 (V2 s0.65m-0.65) |

Figure 3. Hot-wire anemometer circuitry. (A): Wheatstone bridge circuit to ensure constant temperature in the hot-wire. (B): detail of the structure of a hot-wire. Please click here to view a larger version of this figure.
Figure 4. Flow control in the flow system. The stack on top of the plenum serves the purpose of diverting flow from the jet slit allowing to control the jet's exit velocity. Please click here to view a larger version of this figure.
Результаты
The experimental measurements are listed in Table 2 and shown in Figure 5. A linear regression of these data produced the following result for equation (6):
 (9)
(9)
Which can be used to determine the velocity as a function of the voltage:
 (10)
(10)
Table 2. Representative results. Measurements of voltage square and velocity at the vena contracta to the 0.45 power.
| V_VC^0.45 | E^2 |
| 3.119 | 12.584 |
| 3.919 | 14.425 |
| 4.143 | 14.946 |
| 4.278 | 15.256 |
| 4.465 | 15.679 |

Figure 5. Hot-wore anemometer's calibration curve. Please click here to view a larger version of this figure.
Заявка и Краткое содержание
Given that turbulence exhibits high frequency velocity fluctuations, hot-wire anemometers are suitable instruments for its characterization due to their high time-resolution. In the present experiment, we demonstrated the process of calibrating a hot-wire anemometer. To this end, we compared the voltage signal of the anemometer with known values of velocity at the vena contracta of a well-characterized jet. These measurements were used to determine the calibration constants for the linear response of the anemometer.
Hot-wire anemometry is extensively used in scientific studies of boundary layer flows in wind tunnels. Boundary layer is one of the oldest subjects of research in fluid mechanics due to its relevance to technological applications such as aerodynamic design, naval engineering, power generation, among others. To the detriment of all these fields, many effects involving the boundary layer are still incipiently understood: highly irregular roughness, density and viscosity gradients, and compressibility, to mention a few. With this in mind, hot-wire anemometry is used in laboratory settings to assess boundary layer flows relevant to the above-mentioned applications, using strategies similar to the one demonstrated in the current experiment.
Перейти к...
Видео из этой коллекции:

Now Playing
Hot Wire Anemometry
Mechanical Engineering
15.9K Просмотры

Buoyancy and Drag on Immersed Bodies
Mechanical Engineering
30.2K Просмотры

Stability of Floating Vessels
Mechanical Engineering
23.2K Просмотры

Propulsion and Thrust
Mechanical Engineering
22.1K Просмотры

Piping Networks and Pressure Losses
Mechanical Engineering
58.8K Просмотры

Quenching and Boiling
Mechanical Engineering
8.2K Просмотры

Hydraulic Jumps
Mechanical Engineering
41.3K Просмотры

Heat Exchanger Analysis
Mechanical Engineering
28.3K Просмотры

Introduction to Refrigeration
Mechanical Engineering
25.0K Просмотры

Measuring Turbulent Flows
Mechanical Engineering
13.6K Просмотры

Visualization of Flow Past a Bluff Body
Mechanical Engineering
12.2K Просмотры

Jet Impinging on an Inclined Plate
Mechanical Engineering
10.8K Просмотры

Conservation of Energy Approach to System Analysis
Mechanical Engineering
7.4K Просмотры

Mass Conservation and Flow Rate Measurements
Mechanical Engineering
22.9K Просмотры

Determination of Impingement Forces on a Flat Plate with the Control Volume Method
Mechanical Engineering
26.0K Просмотры
Авторские права © 2025 MyJoVE Corporation. Все права защищены