Introduction to Refrigeration
Обзор
Source: Alexander S Rattner and Christopher J Greer; Department of Mechanical and Nuclear Engineering, The Pennsylvania State University, University Park, PA
This experiment demonstrates the principles of vapor compression refrigeration. The vapor compression cycle is the dominant refrigeration technology, found in most refrigerators, freezers, air-conditioning systems, and heat pumps. In this cycle, cooling (heat acquisition) is achieved with low-pressure evaporation of refrigerant. Thermal energy absorbed in evaporation is rejected to the surroundings through high-pressure refrigerant condensation. Mechanical work is applied in the compressor to raise the working fluid from low to high pressure.
While refrigeration technology is ubiquitous, the concealing packaging and autonomous operation of most refrigerators makes it difficult to appreciate the operating principles and function of key components. In this experiment, a rudimentary vapor compression refrigerator is constructed. The compressor is manually actuated with a bicycle pump, allowing intuitive appreciation of cycle operation as the experimenter becomes part of the system. Resulting component pressures and temperatures can be interpreted in terms of the thermodynamic T-s and P-h diagrams, which capture the variation of fluid properties from the liquid-to-vapor states (during evaporation and condensation).
Принципы
The vapor compression cycle is comprised of four main components: the vapor compressor, condenser (high-temperature heat rejection), expansion device, and evaporator (low-temperature heat acquisition) (Fig. 1). The cycle can be described with four key state points.
• 1 → 2: Low pressure vapor refrigerant flows into the compressor, and is compressed to the high-side pressure.
• 2 → 3: Pressurized refrigerant vapor condenses to the liquid phase isobarically (constant pressure), rejecting heat to the surroundings.
• 3 → 4: Liquid refrigerant flows through the throttling expansion device isenthalpically (constant enthalpy), flashing to a two-phase state as its pressure drops. This lowers the refrigerant temperature to the saturation temperature at the low-side pressure.
• 4 → 1: Low temperature refrigerant receives heat from the surroundings and continues to evaporate as it flows through the evaporator isobarically.
The transitions between these state points can be mapped out on thermodynamic diagrams. In these temperature-entropy (T-s, Fig. 2a) and pressure-enthalpy (P-h, Fig. 2b) diagrams, the left side of the dome represents the liquid phase and the right side represents the vapor phase. Inside the vapor dome, the fluid is two-phase and temperature is a function of pressure. The energy transfer to or from the system in each stage of the process can be evaluated by the change in enthalpy multiplied by the refrigerant mass flow rate (positive change: energy acquisition, negative: heat rejection to surroundings). Consider a representative air-conditioning system using R-134a refrigerant at a flow rate of  = 0.01 kg s-1 with the following state point values (Table 1).
Table 1 - Representative refrigeration cycle state points
| Point | Pressure (P, kPa) |
Temperature (T, °C) |
Enthalpy (h, kJ kg-1) |
Entropy (s, kJ kg-1 K-1) |
Quality (Q) |
| 1 | 402.2 | 17.0 | 263.0 | 0.953 | 1 |
| 2 | 815.9 | 57.1 | 293.6 | 1.000 | 1 |
| 3 | 815.9 | 32.0 | 96.5 | 0.357 | 0 |
| 4 | 402.2 | 9.1 | 96.5 | 0.363 | 0.169 |
Here, the cooling capacity in the evaporator is evaluated as  = 1.67 kW. The compressor work input is
  = 0.31 kW. The system efficiency, or coefficient of performance (COP), is
  = 5.4.

Figure 1: Schematic of the vapor compression refrigeration cycle

Figure 2: T-s (a) and P-h (b) diagrams for the representative R-134a vapor compression cycle with state points listed in Table 1.
Процедура
Caution: This experiment involves systems at elevated pressures and use of refrigerants, which can be toxic at high concentrations. Ensure reasonable safety precautions are followed and that appropriate PPE is worn. Ensure adequate ventilation when working with refrigerants.
1. Fabrication of refrigeration system (see diagram and photograph, Fig. 3)
- Construct the vapor compressor by first connecting one port of a double-action pneumatic cylinder to a pipe fitting tee. Install a Schraeder valve on the other port of the pneumatic cylinder. Install one-way (check) valves to the two other ports of the tee, one pointing inward and one pointing outward. This allows refrigerant to be drawn in from the evaporator and expelled to the condenser at high pressure.
- Using two more pipe fitting tees, install pressure gages upstream and downstream of the compressor.
- A high-pressure bicycle floor pump is used to actuate the compressor. Remove the rubber bead (check valve component) from the bicycle pump plumbing. This will allow the compressor to expand and draw in refrigerant in between pumping strokes. Connect the bicycle pump hose to the Schraeder valve on the compressor.
- Form a thin (3.2 mm outer diameter) aluminum tubing coil to act as the condenser. In the prototype system (Fig. 3), the coil was formed by helically wrapping the aluminium tubing around a 2.5 cm diameter rigid rubber tube core for four turns (~50 cm total length). The condenser coil length is not critical for this small-scale experiment.
- Connect one end of the condenser coil to the open port of the pipe fitting tee downstream of the pressure gage using a compression fitting (McMaster Inc. part #5272K291 suggested).
- Install a short clear PVC pipe into two reducing pipe elbows. This component will act as the high-pressure refrigerant reservoir. Connect the reservoir to the outlet of the condenser tubing.
- Install a ball valve into a pipe tee with an AN/SAE flare fitting connector. This will be the charging port. Connect a needle flow meter to one side of the pipe tee. This will be the expansion device. Using the narrow aluminium tubing, connect the other port of the pipe tee to the low point of the refrigerant reservoir.
- Form a second aluminium tubing coil to act as the evaporator. Connect this between the needle valve outlet and compressor inlet.
- Fill the system with compressed air (550 kPa if available) through the charging port. Use a soapy water spray to identify any plumbing leaks, and make repairs as necessary.
- Connect thermocouples to the condenser and evaporator coils for temperature measurement.
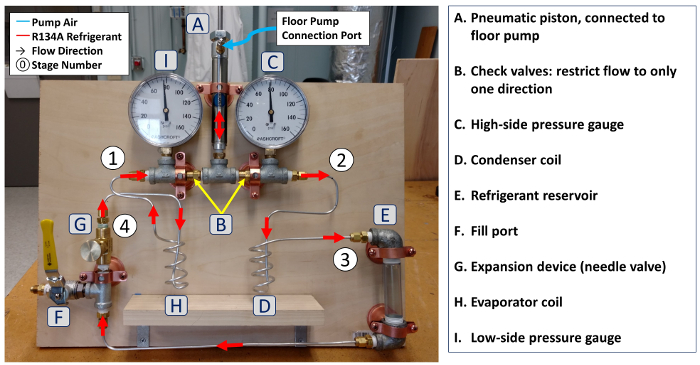
Figure 3: a. Diagram of components and connections in experimental vapor compression refrigeration system. Please click here to view a larger version of this figure.

Figure 4: T - s (a) and P - h (b) diagrams for experimental R-134a vapor compression refrigeration cycle.
2. Charging the refrigeration system
- Connect the middle port of a refrigerant charging manifold to the charging port on the refrigerator. Connect a vacuum pump to the low-pressure port of the manifold, and a can of refrigerant to the high pressure port. R134a is the most commonly available refrigerant, and is used here. R1234ze(E) may be a better option because its low saturation pressure would permit easier compressor operation, and its low GWP would reduce the environmental impacts of any leaks.
- Run the vacuum pump and gradually open all system valves to remove all air. Briefly open the refrigerant canister valve to clear any air from the assembly.
- Once vacuum is achieved, isolate the vacuum pump and close the low-pressure port on the refrigerant charging manifold. Invert the refrigerant canister, and inject liquid refrigerant into the system until the level in the high-pressure reservoir is slightly above the needle valve level.
3. Operation
- Adjust the needle valve until it is just barely open.
- Operate the refrigerator by pumping the bicycle pump connected to the compressor pneumatic cylinder.
- Track the high- and low-side pressures and evaporator and condenser temperatures until steady state conditions are reached. Record these pressures and temperature values. Note that most pressure gauges report gage pressure. This can be converted to absolute pressure by adding approximately 101 kPa.
- Indicate the state points (1-4) and approximate connecting curves on T-s and P-h diagrams (Fig. 4).
Результаты
| Phigh | 659 ± 7 kPa | ||
| Plow | 569 ± 7 kPa | ||
| Tambient | 22.0 ± 1 °C | ||
| Tcond | 25.0 ± 1 °C | Tsat,R-134a (Phigh) | 24.7 ± 0.3 °C |
| Tevap | 21.1 ± 1°C | Tsat,R-134a (Plow) | 19.8 ± 0.4 °C |
Table 2. Refrigeration system measured properties.
Measured condenser and evaporator outer surface temperatures are relatively close to the saturation temperatures at Phigh and Plow. The evaporator temperature is slightly higher than Tsat,R-134a (Plow), possibly due to heat transfer from the ambient air to the exterior thermocouple. The condenser temperature is slightly higher than Tsat,R-134a (Plow), but within experimental uncertainty. This temperature may also be measured in the warmer super-heated portion of the condenser.
Approximate T-s and P-h cycle diagrams for this system are presented in Fig. 4.
Заявка и Краткое содержание
This experiment demonstrated the principles of vapor compression refrigeration. Admittedly, the experimental system yields limited performance - with a low cooling capacity (Qevap) and low lift (evaporator-to-ambient temperature difference). However, it offers an intuitive introduction to the design and physics of vapor compression. The data analysis steps demonstrate the use of T-s and P-h diagrams to describe thermodynamic cycle operation.
Much of the input work is expended in compressing air in the bicycle pump. Using a lower pressure refrigerant (e.g., R1234ze(E)) would reduce this work and may allow greater evaporator-to-condenser temperature differences. Additionally, the expansion valve employed here could only maintain relatively small low-to-high side pressure differences. An alternate valve with finer adjustment control may be preferable. In most commercial refrigeration systems, a temperature controlled expansion valve (TXV) is used, which dynamically adjusts its opening to maintain a desired evaporator temperature.
The vapor compression cycle is the most widely used refrigeration technology. It is found in almost all household air conditioners and refrigerators as well as industrial scale chillers and freezers. The cycle can also be used as a heat pump. In this mode, it acquires heat in the evaporator from the low temperature surroundings, and delivers it to a warmer conditioned space. This can be an efficient mode of heating compared to direct resistance heating because most of the delivered heat is drawn from the surroundings and only a small portion is supplied to the compressor as mechanical work.
This experiment also demonstrates the use of thermodynamic T-s and P-h diagrams. These are critical tools for analysis and engineering of numerous energy systems including chemical processing operations, refrigeration cycles, and power generation.
Перейти к...
Видео из этой коллекции:

Now Playing
Introduction to Refrigeration
Mechanical Engineering
24.6K Просмотры

Buoyancy and Drag on Immersed Bodies
Mechanical Engineering
29.9K Просмотры

Stability of Floating Vessels
Mechanical Engineering
22.4K Просмотры

Propulsion and Thrust
Mechanical Engineering
21.6K Просмотры

Piping Networks and Pressure Losses
Mechanical Engineering
58.0K Просмотры

Quenching and Boiling
Mechanical Engineering
7.7K Просмотры

Hydraulic Jumps
Mechanical Engineering
40.9K Просмотры

Heat Exchanger Analysis
Mechanical Engineering
28.0K Просмотры

Hot Wire Anemometry
Mechanical Engineering
15.5K Просмотры

Measuring Turbulent Flows
Mechanical Engineering
13.5K Просмотры

Visualization of Flow Past a Bluff Body
Mechanical Engineering
11.8K Просмотры

Jet Impinging on an Inclined Plate
Mechanical Engineering
10.7K Просмотры

Conservation of Energy Approach to System Analysis
Mechanical Engineering
7.4K Просмотры

Mass Conservation and Flow Rate Measurements
Mechanical Engineering
22.6K Просмотры

Determination of Impingement Forces on a Flat Plate with the Control Volume Method
Mechanical Engineering
26.0K Просмотры
Авторские права © 2025 MyJoVE Corporation. Все права защищены