
Single and Two-phase Flow in a Packed Bed Reactor
Genel Bakış
Source: Kerry M. Dooley and Michael G. Benton, Department of Chemical Engineering, Louisiana State University, Baton Rouge, LA
The goal of this experiment is to determine the magnitude of maldistribution in typical packed bed reactors in both single phase and two-phase (gas-liquid) flow and evaluate the effects of this maldistribution on pressure drop. The concepts of residence time distribution and dispersion are introduced through the use of tracers, and these concepts are related to physical maldistribution.
Channeling in a single-phase flow can occur along walls or by preferential flow through a larger portion of the bed cross-section. Channeling in two-phase flow can result from even more complex causes, and simple two-phase flow theories seldom predict pressure drops in packed beds. A design goal is always to minimize the extent of channeling by finding the optimal bed and particle diameters for the design flow rates and by packing a bed in a way to minimize settling. It is always important to quantify how much maldistribution might occur and to over-design the unit to account for its occurrence.
The permeameter apparatus measures pressure drop, ΔP, and the concentration of tracer (dye) exiting horizontal packed beds of armored glass for either water, air, or two-phase flow (Figures 1 and 2). Water enters through a control valve and can be routed through manual valves to any of five beds (48" long, 3" I.D.) with different size glass bead dumped (random) packings. The pressure drop is measured using a pressure transmitter. The water flow is measured by a differential pressure (DP, orifice) transmitter and the air flow by a dry test meter (similar to a home gas meter). The dye sample is injected upstream by an automated sampling valve. The exit concentration of the dye from a bed is measured using a UV-Vis spectrometer. Residence time distributions are calculated from the tests and compared to the predictions of theories on dispersion in packed beds. Two-phase flow will be studied in bed 5, which contains the largest particles.

Figure 1: Process and instrumentation diagram of the apparatus.
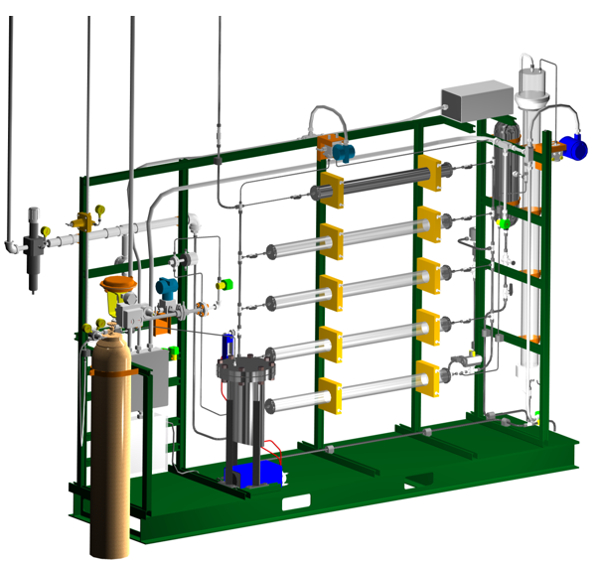
Figure 2. 3-D rendering of the apparatus. Bed #1 is at the top, bed #5 at the bottom. The water control valve is on the left (red bonnet). The DP transmitter is at the top center (blue).
İlkeler
Gas-liquid countercurrent vertical packed beds (packed columns) are frequently used in separation processes such as distillation, absorption, and stripping.1 Cocurrent horizontal packed beds are often used as reactors or adsorbers with a solid catalyst or adsorbent. In both cases (as separators or reactors), the packing increases the surface area of vapor-liquid contact.1 Packing can exist in two forms: dumped packing, consisting of random or simple geometric shapes of materials such as clays, metals or ceramic oxides, or structured packing from common metal and plastics, consisting of highly defined interconnected geometric networks (usually corrugated metals or plastics) that can reduce pressure drop compared to most dumped packings.1 However, whether horizontal or vertical, maldistribution (channeling) can degrade the performance of the separator, reactor or adsorber; sometimes, various types of flow distributors can be employed to mitigate the effects.2 The single phase packed bed ΔP's can be compared to the predictions of the Ergun equation.3
Tracers are dyes that are injected instantaneously into the upstream flow, and whose composition as a function of time is measured in the flow downstream of a bed.4 The measurable tracer molecules are assumed to be characteristic of all the molecules making up the liquid flow. The volume of the injected tracer must be small relative to the system volume. If perfect plug-flow (no axial mixing) occurs in a packed bed, then the tracer injected at time zero would exit the bed at a later time as a spike. For any real bed, the tracer will disperse exiting the reactor at lower concentrations over a longer time period. If the flow is not maldistributed, the spreading will be described by the Gaussian (Normal) distribution, with the peak of the curve observed at the average residence time. The more the tracer spreads out in time, the worse the maldistribution, and typically the poorer the separation or reaction process.
The residence time distribution (RTD) describes the distribution of times that molecules can spend in the bed. If M is the total mass of tracer injected into the system, Q the volumetric flowrate, and C(t) is the effluent concentration, then the mass balance on the tracer is:
 (1)
(1)
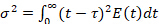
The left-hand side of Equation (1) represents tracer mass in, and the right-hand side represents mass out. E(t) is the bed-exiting residence time distribution (RTD), a probability distribution. Using Equation 1 for the integral, E(t) it can be calculated as:
 (2)
(2)
E(t)dt is the fraction (probability) of molecules in the exit stream of residence time between t and t+dt. The terms E-curve and RTD are synonymous. For packed beds, the residence time is related to the void volume (product of total reactor volume V and porosity ) divided by the volumetric flow rate, Q. The mean residence time,  , can be defined and related to E(t)dt, the probability a given molecule entering the bed at t = 0 will exit at t:
 (3)
(3)
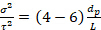
As seen from Equation 3, E(t) has units of inverse time. Sometimes the dimensionless E-curve is plotted instead of the E-curve. This dimensionless E-curve, E(t/), is obtained by multiplying the E-curve by . Its average is 1. Another good way to quantify the deviation from plug flow (the "dispersion") is to compute the variance of the E-curve (σ2) divided by its mean squared:
 (4)
(4)
This quantity should be invariant with respect to flow rate for a packed bed, if maldistribution is not present. The range of values due to molecular diffusion only should be:
 (5)
(5)
for Rep < 40, where Rep is the particle Reynolds number, dp the average particle diameter and L bed length. Greater values of experimental σ2 than predicted by Equation 5 and deviations from the Gaussian distribution indicate flow maldistribution, as does an 'early' peak in the E(t)-curve, or a long tail on the main peak.
In some cases, the nature and magnitude of the maldistribution can be observed visually. This is especially true in two-phase flow. Two simple models exist for two-phase flow, the homogenous model and the stratified model.3,5 For homogeneous flow, the basic assumptions are that the actual gas velocity, UG, actual liquid velocity, UL and averaged velocity of the liquid-gas mixture, Utp are equal:
UL = UG = Utp (6)
Then the two-phase density is given by G/Utp (G is mass velocity), and the averaged two-phase viscosity, µtp, is given by:
μtp-1 = μL-1 (1 - X) + μG-1 X (7)
where X is the quality (weight fraction of vapor in a vapor-liquid mixture) and µL, μG are the viscosities of the respective liquid and gas phases.
For stratified flow, once the pressure drop, total porosity, and both volumetric flow rates are known, the gas volume fraction in active (i.e., not stagnant) flow, α, can be computed by setting the Ergun equations (or similar equations for ΔP) equal for both phases. One can then predict ΔP/L. No matter the type of flow, both phases must have equal pressure drops because they are in parallel. The mass balance relates the two-phase velocity to the actual phase velocities:
Utp = UL (1 - α) + UG (α) = G [ (1 - X)/ρL + X/ρG] (8)
The effect of the gas flow on the liquid is both to reduce its effective cross-sectional area and to provide a nearly zero-shear interface. The effect of the liquid flow on the gas is also to reduce its effective cross-sectional area. Therefore, actual two-phase flow pressure drops typically exceed ΔP's calculated simply on the basis of measuring or calculating α and applying a packed bed ΔP equation (using α instead of ε).
Prosedür
1. Starting up the apparatus
The apparatus is primarily operated through the distributed control system interface. A Perm P&ID schematic appears and opening/closing automated valves is point and click.
- To establish water flow to either bed #4 or #5, open the inlet and exit valves to the bed being tested and the water supply solenoid.
- Use the flow controller to start water flowing through the bed, raising it gradually. Good starting points are 400 mL/min for bed #4 and 500 mL/min for bed #5. Monitor the differential pressure across the beds. Vary the flow to cover the entire possible range of the DP transmitter.
- Power up the spectrometer equipment and establish communication with the control console. Spectrometer procedures are detailed in the operating manual (SpectraSuite). The calibration of the spectrometer for the fluorescent dye standards will be provided.
- Perform one tracer test each on beds #4 and 5 using 50 ppm dye in DI water as the tracer, at a single average flow rate for each bed.
- Insert the spectrometer probe into the probe sample point (Fig. 1). At the PERM interface, change injection valve status from "Running" to "Charging."
- Inject the tracer using the syringe provided into the sample valve. Change the status to "Running".
- Clean out the injection chamber of the sample valve by changing its status back to "Charging", detaching and loading the syringe with water, then injecting at least 100 mL of water into the valve. When the injected sample has completely exited the bed (spectrometer absorbance returns to base line), change the valve state back to "Running" and let the water flow through the valve for 10 - 15 min at a high flow rate before using it again.
2. Conducting Two-Phase Flow Pressure Drop Experiments
Be sure that the water valves to the beds are closed, the inlet and exit valves to bed #5 are open, the drain valve is open, and that the manual valve for the air to the beds is closed.
- Slowly open the air regulator to establish an air flow (< 5 psig at first). Open the manual valve for the air to the beds.
- Set water flow controller at desired setpoint (700 mL/min) and open manual valve. Route water/air flow to gas-liquid separator (see valving in Fig. 1).
- Confirm that water is exiting to drain. Close the valve to the drain for a period of time to build up a liquid head in the gas-liquid separator. This will result in better separation of the air and water.
- Adjust air flow (typically < 2 SCFM) as desired using the pressure regulator and the dry test meter on the gas exit line. Close the drain valve for short periods of time to get a correct gas flow reading on the wet test meter.
- Conduct two-phase flow pressure drop (use DP transmitter) experiments using bed #5, at multiple air rates. Try to cover the range of the DP transmitter. Disconnect the dry test meter if you see water exiting from the gas exit line.
Sonuçlar
Obtain the RTDs (E-curves, using Equations 1-2) after subtracting an appropriate baseline (if necessary) from the spectrometer signals. An example of baseline correction for Bed #3 (not used here) is in Figure 3. Using Equations 1-3, calculate the average porosity, tracer mass, mean residence time, variance and variance divided by mean squared from the RTDs. Compare calculated tracer mass with injected mass - if they aren't within expected precision, examine how the baseline was determined in the spectrometer measurements (and perhaps determine differently). Examine how the variance compares to the prediction from dispersion theory (Equations 4-5); deviations denote excessive channeling.
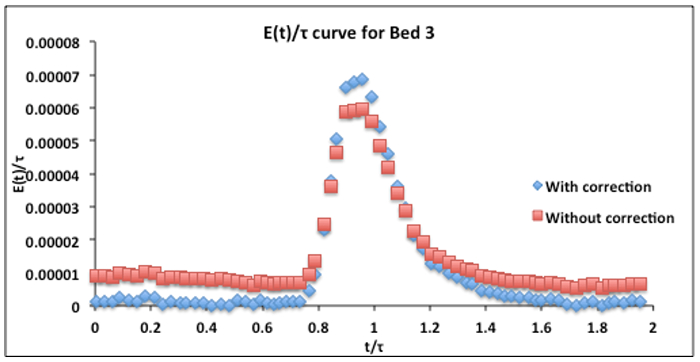
Figure 3. Bed #3 dimensionless RTD E-curve (390 mL/min, 50 ppm tracer injection) with and without baseline correction. The calculated from Equations 2 and 3 was 3.6 min. The baseline correction was made by subtracting two average baseline values, one before and one after the maximum. The one before was subtracted from all values prior to the maximum, the other after was subtraced from all values after the maximum.
Once the porosities of the beds (Equation 3) have been found, the Ergun equation can be used to predict the ΔP's for the water flow experiments. The average particle diameter must first be calculated. Because particle drag is related to area for flow, the surface-area (d2) weighting is usually the best way to obtain the average diameter for a range of particles. The average diameter can be computed as follows, obtaining the particle diameters from the information in the Materials List (ωi is the wt fraction of particles of diameter di):
 (9)
(9)
The calculated porosities can be used to pinpoint the cause of any discrepancies between predicted (by the Ergun equation) and measured ΔP's. For example, the minimum porosity for close-packed spheres is 0.36. It is unlikely that any real ε of an entire bed is less than 0.3. Predicted ΔP's >> actual ΔP's suggest channeling (short-circuiting) along the walls or in the upper portion of the bed when settling occurs. Such phenomena would result in a low ε calculated from the E-curve, leading to high predicted ΔP's. This is the case in Figure 4 for both beds #3 and 4. Note that the more expected ε = 0.36 reproduced the Ergun equation results except at a very high flow rate where a high percentage of the flow was through low voidage regions. This channeling can actually be observed in the experiment.
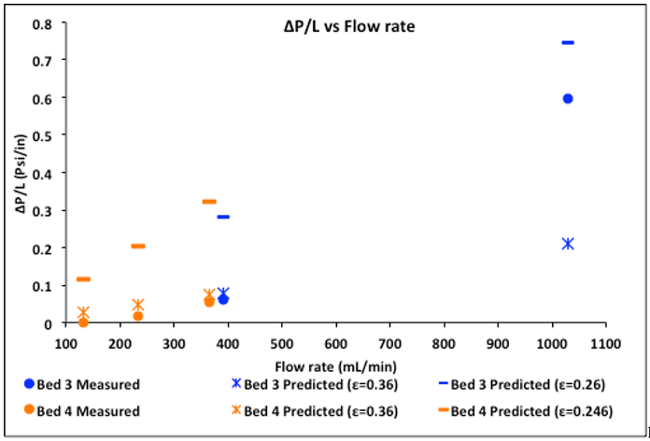
Figure 4. Experimental ΔP's compared to the predictions of the Ergun equation, both at ε = 0.36 and the ε values determined from the E-curves.
Predicted ΔP's << actual ΔP's suggest channeling only through the lower half of the bed, or partial bed blockage. For these beds, this is unlikely.
For the two-phase flows, compute predicted ΔP's by both homogeneous flow and stratified flow theories using Equations 6-9. For stratified flow, one must solve the Ergun equation and Equation 9 simultaneously to obtain α, setting Ergun ΔP/L (liquid) = Ergun ΔP/L (gas). Then compare computed vs. actual ΔP's and see which theory applies best, or if in fact either theory applies. Other flow regimes (e.g., slug, mist or inhomogeneous bubbly flows) are possible, as are major flow distortions due to channeling, which is often more prevalent in two-phase flows.
For two-phase flows through bed #5, the ΔP's calculated using homogeneous flow theory prove to be better than those using stratified flow theory (Table 1), although as seen neither theory applies exactly. The high actual ΔP's suggest severe channeling in a horizontal bed during two-phase flow - the liquid is confined to a small portion of the cross-sectional area. Indeed, the gas volume fractions estimated by visual inspection looked to be at least 0.90. The liquid was also confined to the non-wall region of lower voidage, which increases ΔP. The results reflect the limitations of the simpler rheological models for two-phase flow, and why far more sophisticated microrheological models are finding more use today.
Table 1: Gas volume fractions α and pressure drops in two-phase flow, bed #5.
| Q water | Q air | Q air | α (stratified) |
ΔDP (stratified) psi |
ΔDP (homogeneous) psi |
ΔDP (actual) psi |
| mL/min | ft3/min | mL/min | ||||
| 1100 | 1.62 | 45900 | 0.58 | 2.2 | 12 | 17 |
| 1100 | 1.26 | 35700 | 0.47 | 1.7 | 10 | 14 |
| 1100 | 1.11 | 31400 | 0.38 | 1.5 | 9.5 | 11 |
| 1100 | 0.930 | 26300 | 0.19 | 1.3 | 8.6 | 8 |
| 500 | 0.73 | 20700 | 0.58 | 0.66 | 3.4 | 12 |
| 500 | 0.50 | 14200 | 0.47 | 0.50 | 2.7 | 9 |
| 500 | 0.39 | 11000 | 0.38 | 0.40 | 2.7 | 6 |
| 500 | 0.16 | 4250 | 0.19 | 0.29 | 1.4 | 3 |
Başvuru ve Özet
In this experiment the real flow behavior of horizontal packed beds, both in single and two-phase flow, was contrasted to the simpler theoretical models for pressure drop and dispersion (flow spreading in the axial direction, deviating from plug flow). The utility of tracer tests in probing for maldistribution ("channeling") in such beds has been demonstrated, and it has even been shown that certain metrics calculated from the tracer tests can give some idea of the cause of the channeling. These calculations using the tracer tests, such as computing the E-curve, are normally known as "residence time distribution" (RTD) theory.
Channeling in single-phase flow can occur along walls or any other low voidage region, for example, if settling occurs in a horizontal bed. Channeling in two-phase flow can result from even more complex causes, and as seen simple two-phase flow theories seldom predict pressure drops in packed beds. Channeling increases downstream separation costs or can ruin the product. A goal of design is always to minimize the extent of channeling by finding the optimal bed and particle diameters for a given desired Q, and by packing a bed in a way to minimize settling.
The tracer method of testing is a simple way to quantify the RTD. However, the tracers are seldom the same molecules as used in the process (although they can be close, if isotopes are used). Therefore, tracer molecules may not behave in exactly the same ways as reactant or adsorbate molecules in the fluid phase. In particular, it is important that the tracer not adsorb on the solid particles, because then it cannot be fully characteristic of a fluid molecule.
The time each molecule of a reactant spends inside a chemical reactor is an important determinant of the macroscopic conversion and selectivity to the desired product. The occurrence of "dead zones" (regions of stagnant flow) often lead to poorer than expected selectivities even when the conversions are not much affected. This is one reason why RTD theory is so important in reactor design.4
Tracers are also used by environmental and petroleum engineers to help characterize subsurface solid packing structure. In these applications, two wells are drilled some distance apart; a tracer is injected into one and recovered at the other. Because the earth's subsurface is highly heterogeneous, the effluent profiles (E-curves) are typically nonsymmetrical, indicating the presence of preferential flow paths. This information helps characterize the structure of the subsurface strata, which is important for modeling petroleum recovery and contaminant transport in groundwater.
In environmental engineering, the use of partitioning tracers can be used to locate and quantify organic contaminants in subsurface strata. An inert tracer is injected to characterize the flowing (aqueous) phase between two wells. A partitioning tracer is then injected, partitioning preferentially into an organic contaminant phase if one exists. The tracer is light enough that it will eventually diffuse out of the organic phase. This behavior manifests itself as a time delay as compared to the inert tracer, and comparison of these two can be used to deduce the volume of stagnant organic phase present.
Two-phase flows are also commonly found in power plants, in non-reactor, non-adsorber applications. An example is boiling heat transfer, with the steam created in a boiler. They are also found in all distillation columns, absorbers and strippers, although in vertical rather than horizontal configuration.
Materials List
| Name | Company | Catalog Number | Comments |
| Equipment | |||
| Bed #3 – glass beads | Grainger | 25-40 mesh (50%)
60-120 mesh (50%) |
Packed in parallel |
| Bed #4 – glass beads and blast sand | Grainger | 60-120 mesh (90%) - glass
80-120 mesh (6%) - glass 120-200 mesh (4%) - sand |
Mixed together |
| Bed #5 – glass beads | Grainger | 5-10 mesh | |
| Dry test meter | Singer | Model 803 | |
| Fiber-optic UV-Vis spectrometer | Ocean Optics | Model USB2000 | Includes Ocean Optics DT-1000 light source |
| Test tubes | VWR | 10 mL | For calibration |
| Reagents | |||
| Yellow/green fluorescent dye | Cole-Parmer | 0298-17 | Used to make up tracer solutions |
Referanslar
- Encyclopedia of Chemical Engineering Equipment." Distillation Columns. http://encyclopedia.che.engin.umich.edu/Pages/SeparationsChemical/DistillationColumns/DistillationColumns.html. Accessed 9/22/16.
- Encyclopedia of Chemical Engineering Equipment." Absorbers. http://encyclopedia.che.engin.umich.edu/Pages/SeparationsChemical/Absorbers/Absorbers.html. Accessed 9/22/16.
- Nevers, N., Fluid Mechanics for Chemical Engineers, 3rd Ed., McGraw-Hill, 2004, Ch. 11. A derivation can be found in: M.M. Denn, "Process Fluid Mechanics", Prentice-Hall, 1980, Ch. 4.
- Fogler, H.S., "Elements of Chemical Reaction Engineering", Prentice-Hall, 2006, Ch. 13.1-13.3 and 14.3-14.4 (dispersion models); Levenspiel, O., "Chemical Reaction Engineering", 3rd Ed., John Wiley, 1999, Ch. 11 and 13 (dispersion models); Missen, R.W., Mims, C.A., and Saville, B.A., "Introduction to Chemical Reaction Engineering and Kinetics", John Wiley, 1999, Ch. 19 and 20.1.
- Levy, S., "Two Phase Flow in Complex Systems", John Wiley, 1999, Ch. 3.
Etiketler
Atla...
Bu koleksiyondaki videolar:

Now Playing
Single and Two-phase Flow in a Packed Bed Reactor
Chemical Engineering
18.9K Görüntüleme Sayısı

Testing the Heat Transfer Efficiency of a Finned-tube Heat Exchanger
Chemical Engineering
17.9K Görüntüleme Sayısı

Using a Tray Dryer to Investigate Convective and Conductive Heat Transfer
Chemical Engineering
43.9K Görüntüleme Sayısı

Viscosity of Propylene Glycol Solutions
Chemical Engineering
32.7K Görüntüleme Sayısı

Porosimetry of a Silica Alumina Powder
Chemical Engineering
9.6K Görüntüleme Sayısı

Demonstration of the Power Law Model Through Extrusion
Chemical Engineering
10.0K Görüntüleme Sayısı

Gas Absorber
Chemical Engineering
36.6K Görüntüleme Sayısı

Vapor-liquid Equilibrium
Chemical Engineering
88.7K Görüntüleme Sayısı

The Effect of Reflux Ratio on Tray Distillation Efficiency
Chemical Engineering
77.6K Görüntüleme Sayısı

Efficiency of Liquid-liquid Extraction
Chemical Engineering
48.4K Görüntüleme Sayısı

Liquid Phase Reactor: Sucrose Inversion
Chemical Engineering
9.7K Görüntüleme Sayısı

Crystallization of Salicylic Acid via Chemical Modification
Chemical Engineering
24.2K Görüntüleme Sayısı

Kinetics of Addition Polymerization to Polydimethylsiloxane
Chemical Engineering
16.1K Görüntüleme Sayısı

Catalytic Reactor: Hydrogenation of Ethylene
Chemical Engineering
30.4K Görüntüleme Sayısı

Evaluating the Heat Transfer of a Spin-and-Chill
Chemical Engineering
7.4K Görüntüleme Sayısı
JoVE Hakkında
Telif Hakkı © 2020 MyJove Corporation. Tüm hakları saklıdır