Buoyancy and Drag on Immersed Bodies
Przegląd
Source: Alexander S Rattner and Sanjay Adhikari; Department of Mechanical and Nuclear Engineering, The Pennsylvania State University, University Park, PA
Objects, vehicles, and organisms immersed in fluid mediums experience forces from the surrounding fluid in the form of buoyancy- a vertical upward force due to fluid weight, drag- a resistive force opposite the direction of motion, and lift- a force perpendicular to the direction of motion. Prediction and characterization of these forces is critical to engineering vehicles and understanding the motion of swimming and flying organisms.
In this experiment, the balance of buoyancy, weight, and drag forces on submerged bodies will be investigated by tracking the rise velocity of air bubbles and oil droplets in a glycerin medium. The resulting drag coefficients at terminal rise velocities will be compared with theoretical values.
Zasady
When a body rises in a fluid medium, it experiences the external forces of gravity, buoyancy, and fluid drag. The force from gravity is weight (W), and acts downward with magnitude W = mg (m is the mass of the body, and g is the gravitational acceleration, 9.8 m s-2).
The buoyancy force (Fb) acts upward, opposing gravity. Pressure increases with depth in a fluid medium due to the greater weight of fluid above deeper points in the medium. Thus, the pressure force acting upward on the bottom of an immersed body is greater than the pressure force acting downward on the top of the body, resulting in the upward buoyancy force. The buoyancy force magnitude is Fb = ρfVg, where ρf is the density of the surrounding fluid medium and V is the volume of the immersed body. This is equal to the weight of fluid displaced by the submerged body.
When a body moves through a fluid medium, it experiences frictional resistance from the fluid, called drag. The drag force (FD) acts opposite to the direction of motion, and depends on the shape and size of the body, its velocity, and the fluid properties. In general, drag force can be modeled as:
 (1)
(1)
Here, U is the velocity of the immersed body and A is the face area of the body (projected area in the direction of motion). CD is the drag coefficient, which depends on the shape of the body and its Reynolds number - a measure of the relative magnitude of inertial and viscous fluid forces on the body. Here,  , where D is a relevant length scale for the body (diameter for spheres and cylinders) and
  is the fluid viscosity.
In this experiment, air bubbles and oil droplets will be injected into a high viscosity glycerin bath, and rise to the free surface. A free body diagram on a bubble/droplet (Fig. 1) rising at the terminal velocity (not accelerating) gives the vertical force balance: FB-W-FD = 0. Substituting earlier results, and assuming a spherical bubble (volume V = (1/6)πD3, face area A = (1/4)πD2) yields the following result (Eqn. 2). Here,  is the density of the fluid inside the bubble/droplet.
 (2)
(2)
In this experiment, the drag coefficient ( ) for spheres will be measured based on the rise velocity of different size bubbles and droplets. These data will be compared with the theoretical result of [1,2] for low Reynolds numbers (
 ).
).
 (3)
(3)

Figure 1: Force balance on rising gas bubble or oil droplet
Procedura
1. Fabrication of gas injection test section (see schematic and photograph, Fig. 2)
- Drill a hole in the bottom of a tall, flat walled plastic container. Install a through-wall bulkhead fitting through this hole. Install a reducing fitting to a ~3.2 mm tube compression connection in the bulkhead fitting outlet. This will be the bubble/droplet injection port.
- Insert a short length (~1 cm) of 3.2 mm diameter soft rubber cord in the compression connection, and tighten the fitting nut. Using a sewing pin, puncture a thin hole through the rubber cord. This will be the valve for injecting bubbles/droplets into the fluid container.
- Fill the container with glycerin to a level of ~25 cm. Pour the glycerin slowly as a film down the container sidewall to help reduce bubble entrainment in the container. Wait for ~2 hours to allow larger bubbles to rise out of the container.
- Mount a video camera on a tripod facing the container, with the upper portion of the liquid in view. Mount a bright light on the other side of the container, facing the camera (backlighting). Insert a diffuser sheet between the light and container to ensure even illumination.
2. Performing experiments
- Insert a ruler or flat object of known size into the glycerin container, above the injection port, facing the camera. Record a brief video of the object. This will serve a scale to to map from bubble size in px and rise velocity in px s-1 to m and m s-1, respectively.
- Using a syringe with a thin needle (e.g., 20 gauge). Inject gas bubbles of varying sizes through the rubber valve into the liquid. Use the camera to record videos of the bubbles rising through the liquid.
- Mix oil-based food coloring with soybean vegetable oil (or other low-viscosity vegetable oil). Using the syringe, inject colored oil droplets of varying sizes into the glycerin container. Record videos of the droplets rising.
3. Analysis
- Using software such as VLC media player, export image snapshots from the video of the ruler (Step 2.1). In an image editing software measure the pixel distance across a known length of the device. The length scaling factor can then be determined as
 , where Lm is the physical length of the object in meters and Lpx is the object length in pixels in the image.
 - For each bubble or droplet rise velocity video, extract image snapshots from when the bubbles/droplets enter and exit the camera view window. Measure the bubble/droplet (horizontal) diameters in an image editing software (Dpx). Measure the average rise velocities (Upx) as the difference in bubble/droplet nose positions divided by elapsed video times between initial and final image snapshots. Convert these pixel values to physical values as: D = sDpx and U = sUpx.
- Evaluate bubble and droplet Reynolds numbers () and drag coefficients (Eqn. 2). Plot these values and compare with theoretical results from Eqn. 3. Fluid properties at room temperature (22°C) are:
• Glycerin: ρf = 1300 kg m-3, µf = 3.7 kg m-1 s-1
• Air: ρb = 1.19 kg m-3
• Soybean oil: ρb = 920 kg m-3
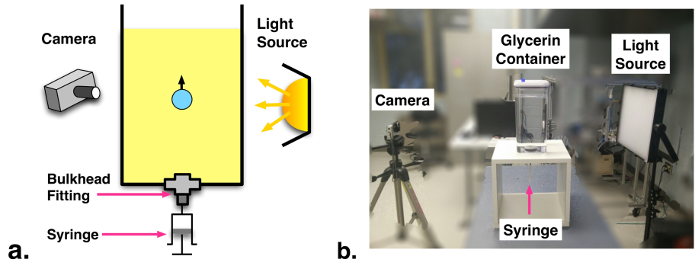
Figure 2: (a) Schematic and (b) photograph of experimental facility.
Wyniki
A series of rising air bubbles and oil droplets of varying diameters are presented in Fig. 3. The small bubbles and droplets rise at lower velocities due to relatively stronger drag forces. At these low velocity and length scales, strong surface tension forces result in nearly spherical bubbles and droplets. The largest bubbles approach Re ~ 2, resulting in somewhat flattened tails in the wake region. The largest oil droplets only approach Re ~ 0.2 due to their greater weights. The large droplets form slightly teardrop shapes, likely due to the high inertia (density) of the oil circulating inside the droplets. In contrast, the low density air in the gas bubbles has negligible inertia.
Measured drag coefficients (Eqn. 2) are compared with theoretical values for air bubbles and oil droplets (Eqn. 3) in Fig. 4. The most significant sources of uncertainty in this study stem from the glycerin viscosity value, which varies sharply with temperature, and the diameters of the smallest bubbles/droplets. Here, uncertainty propagation is performed assuming ± 0.2 kg m-1 s-1 for glycerin viscosity (corresponds to ~ ±1°C) and ±1.5 mm for bubble diameter (~3 px). Overall, qualitatively close agreement is observed with theory in Fig. 4, with most measured CD values matching theoretical results within experimental uncertainty.
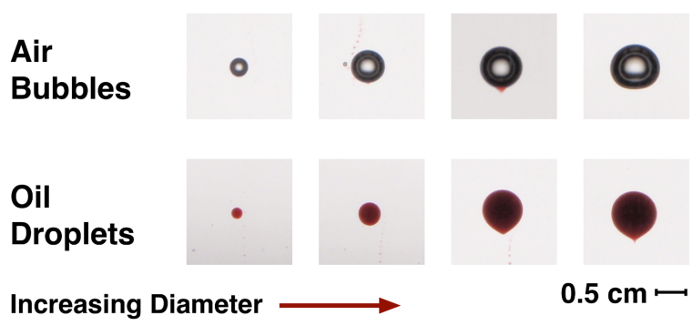
Figure 3: Image series of rising gas bubbles and oil droplets of varying diameters

Figure 4: Measured drag coefficients and Reynolds number for rising bubbles and droplets compared with theoretical model (Eqn. 3).
Wniosek i Podsumowanie
This experiment demonstrated the measurement of drag coefficient for rising bubbles and droplets in a fluid medium. Drag coefficients were determined by accounting for weight, buoyancy, and drag forces. Results were compared with a theoretical model for bubble/droplet CD at low Reynolds numbers.These results could be directly applicable to the design of industrial heat and mass exchangers, such as steam generators in power plants. In steam generators, vapor bubbles must be removed from the heated area by buoyancy or fluid flow to allow fresh liquid to reach the heating elements. In chemical reactors, gas bubbles are often injected to improve mixing. Characterization of bubble motion through liquid is thus needed to inform system design.
Vehicles such as cars, planes, and boats experience significant forces from drag. For example, at highway speeds, a typical sedan may require ~40 horsepower just to overcome aerodynamic resistance. Careful design of vehicle shape and intake/exhaust pathways can control airflow around a vehicle and reduce drag. In boats, submarines, and hot air balloons/blimps the buoyancy force balances the vehicle weight and must be considered carefully. By applying the principles introduced here, we can predict weight, buoyancy, and drag forces in engineering systems.
When analyzing the flows affecting small or deformable objects, such as bubbles and droplets, it is often necessary to indirectly measure lift and drag forces based on object velocity. When analyzing larger objects, such as airplane wings or car bodies, scale models can be mounted on fixed force gages in wind tunnels, and subjected to external flows. In such cases, drag (and lift) forces can be measured directly (Eqn. 1). Engineers apply such information to optimize the shapes of vehicles for reduced drag and ensure that engines provide sufficient power to overcome fluid resistance.
Odniesienia
- J.S. Hadamard, Motion of liquid drops (viscous), Comp. Rend. Acad. Sci. Paris. 154 (1911) 1735-1755.
- W. Rybczynski, On the translatory motion of a fluid sphere in a viscous medium, Bull. Acad. Sci., Cracow, Ser. A. (1911) 40.
Tagi
Przejdź do...
Filmy z tej kolekcji:

Now Playing
Buoyancy and Drag on Immersed Bodies
Mechanical Engineering
29.9K Wyświetleń

Stability of Floating Vessels
Mechanical Engineering
22.4K Wyświetleń

Propulsion and Thrust
Mechanical Engineering
21.6K Wyświetleń

Piping Networks and Pressure Losses
Mechanical Engineering
58.0K Wyświetleń

Quenching and Boiling
Mechanical Engineering
7.7K Wyświetleń

Hydraulic Jumps
Mechanical Engineering
40.9K Wyświetleń

Heat Exchanger Analysis
Mechanical Engineering
28.0K Wyświetleń

Introduction to Refrigeration
Mechanical Engineering
24.6K Wyświetleń

Hot Wire Anemometry
Mechanical Engineering
15.5K Wyświetleń

Measuring Turbulent Flows
Mechanical Engineering
13.5K Wyświetleń

Visualization of Flow Past a Bluff Body
Mechanical Engineering
11.8K Wyświetleń

Jet Impinging on an Inclined Plate
Mechanical Engineering
10.7K Wyświetleń

Conservation of Energy Approach to System Analysis
Mechanical Engineering
7.4K Wyświetleń

Mass Conservation and Flow Rate Measurements
Mechanical Engineering
22.6K Wyświetleń

Determination of Impingement Forces on a Flat Plate with the Control Volume Method
Mechanical Engineering
26.0K Wyświetleń
Copyright © 2025 MyJoVE Corporation. Wszelkie prawa zastrzeżone