
Performing 1D Thin Layer Chromatography
Visión general
Source: Laboratory of Dr. Yuri Bolshan — University of Ontario Institute of Technology
Thin layer chromatography (TLC) is a chromatographic method used to separate mixtures of non-volatile compounds. A TLC plate consists of a thin layer of adsorbent material (the stationary phase) fixed to an appropriate solid support such as plastic, aluminum, or glass1. The sample(s) and reference compound(s) are dissolved in an appropriate solvent and applied near the bottom edge of the TLC plate in small spots. The TLC plate is developed by immersing the bottom edge in the developing solvent consisting of an appropriate mobile phase. Capillary action allows the mobile phase to move up the adsorbent layer. As the solvent moves up the TLC plate, it carries with it the components of each spot and separates them based on their physical interactions with the mobile and stationary phases.
Principios
Chromatography involves the separation of a mixture of compounds by distributing the components between two phases2. The stationary phase is fixed in place while the mobile phase is allowed to flow through the stationary phase, carrying the components of the mixture with it. The properties of compounds such as solubility in the mobile phase and the strength of interaction with the stationary phase affect the rate at which they are carried through the medium. Since different types of compounds have different physical properties, they are carried at different rates allowing for separation of the components of a mixture.
This video will demonstrate the separation and visualization of mixtures of compounds using the technique of one-dimensional thin layer chromatography (TLC).
Procedimiento
1. TLC Plates
- Common adsorbents for TLC are silica gel, alumina, and cellulose. TLC plates are commercially available with a variety of properties. Choose a TLC plate and cut it down to an appropriate size (approximately 5 cm x 5 cm is sufficient for most applications). For glass-backed TLC plates, score the glass using a ruler and a glass cutter, then carefully break along the line.
2. Spotting
- Dissolve the sample in a suitable solvent to make an approximately 1% solution. If possible the solvent should be nonpolar. Column chromatography fractions and other dilute solutions may be used without dilution if the solute is present at a concentration between 0.2% and 2.0%.
- Mark the baseline with a pencil about 1.0 cm from the bottom of the plate. Position the spots at least 1.0 cm from the edge of the plate and label them appropriately.
- Spots may be applied using a glass capillary. To spot the TLC plate, dip the capillary into the solution to draw in a small quantity of liquid. Gently touch the tip to the desired location on the TLC plate and remove it immediately.
- Alternatively, apply spots with a microliter syringe by delivering approximately 1 μL of solution for each application.
- Spots may be applied successively at each location, taking care not to disturb the surface of the adsorbent with the spotter. Allow solvent to dry in between applications.
3. Choosing a Developing Solvent
- It is preferable to use the least polar solvent possible for good separation. Common solvents for TLC include hexane, ethyl acetate, dichloromethane, and methanol (Table 1).
- A convenient way to find an appropriate mobile phase is to spot the TLC plate with a sample. Apply enough solvent directly to the spot to form a circle of solvent 1–2 cm in diameter. Mark the circumference of the circle. Upon visualization an appropriate solvent will show well-separated rings, with the outermost ring about 50% of the distance from the center to the solvent front.
- It may be necessary to adjust the polarity of the mobile phase by choosing two miscible solvents and testing them in varying proportions. Examples of common mixtures are hexanes with ethyl acetate and dichloromethane with methanol.
4. Development
- Place the spotted TLC plate in a developing chamber containing the appropriate developing solvent. The solvent line should be below the baseline marked on the TLC plate.
- The developing chamber can be a jar with a lid, or a beaker covered with aluminum foil or plastic film. Use the smallest container available that will accommodate the TLC plate.
- Do not allow the solvent to reach the top edge of the plate. When the solvent front (the boundary where the wet part of the adsorbent ends) is 5–10 mm from the top the plate, remove the TLC plate from the developing chamber and mark the solvent front with a pencil before the solvent dries.
5. Visualization
- Colored spots may be visualized immediately and marked with a pencil. Often, spots are not visible and therefore must be visualized by some other method.
- Often, the TLC adsorbent contains a fluorescent indicator. Spots may be visualized using a hand-held ultraviolet (UV) lamp. Compounds that quench fluorescence will appear as dark spots when the plate is irradiated with short-wave (254 nm) UV light. Fluorescent compounds will produce bright spots when irradiated with UV light of an appropriate wavelength. Mark the center of each spot with a pencil.
- Spots may also be visualized by applying a visualizing reagent or stain to the TLC plate. The visualizing reagent may be applied by dipping the plate into the reagent, or by wiping the plate with a cotton ball saturated with a noncorrosive reagent.
- A 20% solution of phosphomolybdic acid in ethanol is useful for the visualization of most organic compounds. The spots appear upon heating of the plate with a heat gun or in an oven.
- Other reagents may be used for visualization of specific classes of compounds. For example, ninhydrin reagent is used for amino acid visualization, and 2,4-dinitrophenylhydrazine for aldehydes and ketones.
6. Analysis
- The retardation factor (Rf) is the ratio of the distance a compound travels up a TLC plate to the distance the solvent travels. This may be determined by measuring the distance from the baseline to the center of the spot and dividing the value by the distance from the baseline to the solvent front.
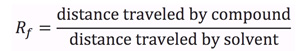
- The Rf of a compound is characteristic of its physical properties and dependent on factors such as temperature, sample size, and thickness and activity of the adsorbent, temperature, and sample size.
- To confirm that an unknown is identical to a known compound, a standard should be spotted on the same TLC plate. Identical substances will have the same characteristic Rf.
Resultados
An example of a typical TLC plate is shown in Figure 1. An unknown compound 'A' may be compared to known standards 'B' through 'E'. Determination of the Rf value for each component is achieved by spotting of each respective compound, developing the TLC plate, and visualization. The Rf of unknown compound 'A' is calculated by measuring the spot height (y) and dividing by the solvent height (z). Comparing this value to the Rf determined for each of the standards allows for the identification of the unknown compound.
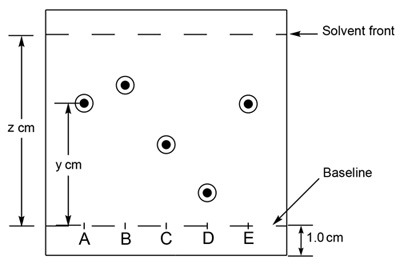
Figure 1. Schematic of a TLC plate. The retardation factor (Rf) should be consistent between experiments as long as the conditions are held constant.
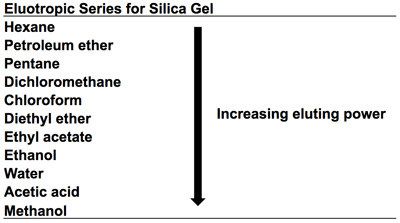
Table 1. Eluotropic Series for Silica Gel. A list of common mobile phases in order of increasing eluting power.
Aplicación y resumen
TLC has a number of practical applications in the laboratory. TLC may be used to identify unknown compounds and unknown components of mixtures via comparison with standards. TLC is commonly used to monitor the course of a chemical reaction, and to assess the purity of the product through the comparison of relative amounts of reactants, products, and by-products on successive chromatograms over time. TLC can also be used to determine if a substance purified by other methods (such as recrystallization or distillation) still contains a significant amount of impurity.
When similar compounds cannot be resolved with TLC, they can be further separated based on another physical property, known as a two-dimensional separation. In one example, TLC was used to separate broad lipid classes (triglycerides, sterols, fatty acids, etc.) secreted by mammalian sebaceous glands. The different classes were then further separated by mass spectrometry3.
In microbiology, TLC is used in bioautography screenings for novel plant-based antimicrobial compounds4. Once compounds have been separated from an extract of the plant in question, the bands can be applied directly to microbial cultures. Bands that are observed to inhibit growth are then further studied as likely candidates.
TLC is a straightforward method to determine an appropriate mobile phase for separation of a mixture by column chromatography. Additionally, it is used to determine the composition of the various fractions collected during a column chromatography separation, so that fractions containing the desired compound can be identified and collected.
Divulgaciones
Tags
Saltar a...
Vídeos de esta colección:

Now Playing
Performing 1D Thin Layer Chromatography
Organic Chemistry
290.2K Vistas

Introducción a la catálisis
Organic Chemistry
34.7K Vistas

Montaje de un sistema de reflujo para reacciones químicas calientes
Organic Chemistry
168.6K Vistas

Realizar reacciones por debajo de la temperatura ambiente
Organic Chemistry
70.7K Vistas

Líneas de Schlenk para transferencia de disolventes
Organic Chemistry
41.7K Vistas

Desgasificación de líquidos con ciclos de congelación-bomba-descongelación
Organic Chemistry
56.4K Vistas

Preparación de equipos y reactivos anhidros
Organic Chemistry
79.4K Vistas

Purificación de compuestos por recristalización
Organic Chemistry
710.6K Vistas

Separación de mezclas por precipitación
Organic Chemistry
158.1K Vistas

Extracción sólido-líquida
Organic Chemistry
238.3K Vistas

Evaporación rotatoria para eliminar solventes
Organic Chemistry
213.0K Vistas

Destilación fraccionada
Organic Chemistry
335.0K Vistas

Crecimiento de cristales para el análisis de difracción de rayos x
Organic Chemistry
32.9K Vistas

Cromatografía en columna
Organic Chemistry
361.3K Vistas

Espectroscopia de resonancia magnética nuclear (RMN)
Organic Chemistry
249.1K Vistas
ACERCA DE JoVE
Copyright © 2025 MyJoVE Corporation. Todos los derechos reservados