
Liquid Phase Reactor: Sucrose Inversion
Overview
Source: Kerry M. Dooley and Michael G. Benton, Department of Chemical Engineering, Louisiana State University, Baton Rouge, LA
Both batch and continuous flow reactors are used in catalytic reactions. Packed beds, which use solid catalysts and a continuous flow, are the most common configuration. In the absence of an extensive recycle stream, such packed bed reactors are typically modeled as "plug flow". The other most common continuous reactor is a stirred tank, which is assumed to be perfectly mixed.1 One reason for the prevalence of packed bed reactors is that, unlike most stirred tank designs, a large wall area to reactor volume ratio promotes more rapid heat transfer. For almost all reactors, heat must either be added or withdrawn to control the temperature for the desired reaction to take place.
The kinetics of catalytic reactions are often more complex than the simple 1st order, 2nd order, etc. kinetics found in textbooks. The reaction rates can also be affected by rates of mass transfer - reaction cannot take place faster than the rate at which reactants are supplied to the surface or the rate at which products are removed - and heat transfer. For these reasons, experimentation is almost always necessary to determine the reaction kinetics prior to designing large-scale equipment. In this experiment, we explore how to conduct such experiments and how to interpret them by finding a reaction rate expression and an apparent rate constant.
This experiment explores the use of a packed bed reactor to determine the kinetics of sucrose inversion. This reaction is typical of those characterized by a solid catalyst with liquid phase reactants and products.
sucrose → glucose (dextrose) + fructose(1)
A packed bed reactor will be operated at different flow rates to control the space time, which is related to residence time and is analogous to elapsed time in a batch reactor. The catalyst, a solid acid, will first be prepped by exchanging protons for any other cations present. Then, the reactor will be heated to the desired temperature (isothermal operation) with the flow of reactants. When the temperature has equilibrated, product sampling will begin. The samples will be analyzed by a polarimeter, which measures optical rotation. The mixture's optical rotation can be related to the conversion of sucrose, which can then be used in standard kinetics analyses to determine the order of the reaction, with respect to the reactant sucrose, and the apparent rate constant. The effects of fluid mechanics - no axial mixing (plug flow) vs. some axial mixing (stirred tanks in series) - on the kinetics will be analyzed as well.
Principles
Compared to continuous stirred tank reactors (CSTRs), plug flow reactors (PFRs) are usually better suited for fast reactions and large heat effects.2 However, pressure drop and the development of "hot spots" can be problematic. Therefore, catalyst particle sizes can't be too small and careful startup procedures must be followed.
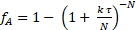
A PFR is mathematically equivalent to a large number of small, equally-sized CSTRs in series whose total volume or catalyst weight matches that of the system. When mixing occurs in the axial direction, the number of tanks, N, needed to describe reactor operation decreases. The model is called the "Tanks in Series" model. The parameters N and τ (space time) of the model can sometimes be obtained from the mean and variance of the residence time distribution (E-curve) of the reactor. For a PFR, the mean can be calculated exactly, and the variance is zero. For a real reactor, τ is usually estimated, and N is regressed from the model (Equation 2):
 (2)
(2)
where "i" is the reactor number, CAo is the feed concentration of the limiting reactant (in this case, sucrose), ΔfAi is the change in fractional conversion of "A" in the i the stirred tank, and rAi is the rate of reaction evaluated at the tank exit concentrations. This rate must be positive. Solving the mass balance for equal-sized CSTRs in series can also be used to determine the order of reaction for "A" using data from a real reactor and assuming the temperature can be kept reasonably constant and that N is known.
The forward rate equation for a catalytic reaction is almost always 1st order in catalyst concentration and some positive order ≤2 in any reactant concentration. Products can sometimes inhibit the catalyst, causing the reactant's order to appear less than it really is. Even reactants can inhibit the catalyst, resulting in orders for a reactant closer to zero. For these reasons, catalytic reactions are often expressed by a "power-law" model:2
 (3)
(3)
where  is the concentration of limiting reactant, k' is the apparent rate constant, and
  is the apparent reaction order. This model presupposes thatthe catalyst concentration is constant (it is absorbed into the true rate constant to give k'). In real life, catalysts often deactivate, i.e., Ccat [in mmol acid sites/gcat] decreases due to accumulation of catalyst poisons. For this reason one must either account for deactivation (express Ccat as a function of time onstream) or (preferably) collect data over a time period where the catalyst is relatively stable.
The kinetics of sucrose inversion are usually found to be first order in sucrose concentration and first order in concentration of catalyst sites. Lifshutz and Dranoff report a second-order rate constant k of ~0.029 mL/(mmol acid sites • min) for a catalyst similar to the one used here at 60 °C with an activation energy of 77 kJ/mol.4 Gilliland et al. report ~1.21 mL/(mmol acid sites • min) with an activation energy of 84 kJ/mol for a similar catalyst at these conditions.4 The significant differences in k can arise from several factors: (a) effects of heat and mass transfer on the kinetics; (b) poor flow distribution; (c) poor temperature control; and (d) varying states of catalyst activation.
The space time (analogous to residence time) for a catalytic reactor is usually expressed as  = W/Q, where W is the weight of catalyst and Q is the volumetric flowrate of feed. The units on the rate constant are adjusted to account for the units on space time (i.e., for a 1st order reaction the units on k' would be the same as for 1/). Figure 1 illustrates the behavior of reactions of various kinetics orders in both a PFR and in a tanks-in-series model consisting of two tanks. Note that for positive orders, the PFR is always superior.
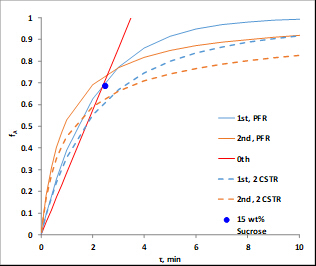
Figure 1. Computed fractional conversions (vs. space time) of sucrose using rate constants derived from the data for several sucrose feeds at 60°C.
To determine the amount of sugar, a polarimeter is used, which measures the degree of rotation of the light polarized by the analyte compound. Sugars are examples of compounds with enantiomers that can be differentiated by their optical activity, the ability to rotate light. A polarimeter is especially suited to measurement of concentrations in this experiment because the reactant sucrose rotates light to the right (positive optical rotation), whereas the products glucose and fructose rotate to the left (negative optical rotation).
Procedure
Catalyst properties are: size = 20 - 40 mesh; weight = 223 g; water content = 30 wt. %; apparent (bulk) density = 1.01 g/mL; acid site concentration = 4.6 mmol acid sites/g dry weight; surface area = 50 m2/g; macroporosity (macropore volume/total volume of cat.) = 0.34; average macropore size = 80 nm. A P&ID diagram of the unit is shown in Figure 2. For this experiment, only bed #1, the organics tank, pump and rotameter are used. Samples are collected at the upper drain. T505 is the temperature controller.
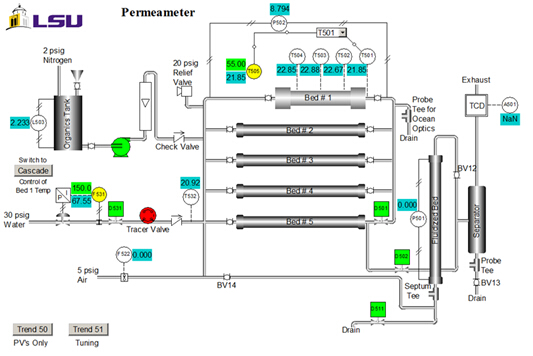
Figure 2. P&ID representation of the apparatus (control system interface).
1. Starting up the Reactor
- Access the distributed control system interface. From the Unit item on the menu, select Perm. The Perm P&ID schematic (Figure 2) will appear. All data can be collected into an Excel spreadsheet. Click "Trend 50" on the interface to obtain the key process variables with respect to time.
- Open the inlet and exit valves to the catalytic reactor bed (Bed #1). Be sure that the inlet and exit valves to the other beds are closed, and that the control valve (F531) and on-off valve (D531) on the city water supply are also closed.
- Add dilute acid (0.25 M H2SO4) to the feed tank (2 L).
- Turn on the feed pump to a constant speed (at least 3 on the dial), and set the rotameter to give the desired flow rate (40 - 70 mL/min). If the rotameter cannot control flow in this range, increase the pump speed to the next higher setting.
- Once acid has been fed, add 200 mL or more of DI water to the feed tank. The acid protons will exchange for whatever other ions (Na+, Ca2+) are attached to the sulfonic acid anions. This is because even DI water contains impurities and municipal water contains even more. This is called "regenerating" the catalyst.
- Prepare at least 10 L of feed solution with 15 wt% sucrose in DI water. When preparing the sucrose solution, add the sucrose slowly to the water while stirring at room temperature. Use both a magnetic stirrer and a paddle.
- Add the feed into the organics tank.
2. Packed Bed Reactor Operation
- To begin sucrose feed flow, turn on the pump, and adjust flow as desired using the pump's speed controller and the rotameter. The speed controller is for gross adjustment, whereas the rotameter is for fine adjustment.
- Program the setpoint for T505 to 50°C, and set it to AUTO. The system is programmed to cut off the heaters if the bed temperature reaches 90°C, or if the pressure drop, as measured by the d/p transmitter, falls below 1 in. on the H2O column pressure, which indicates that there is no feed.
- A typical temperature for the reaction is 60°C. When the reactor temperature first exceeds 50°C, move the set point to this desired final temperature. A temperature profile may be observed across the catalyst section, which can be visualized by examining thermocouples T502 and T503.
- Collect 25 mL samples of the reaction products at the upper drain in test tubes or sample bottles 10 min apart. Do not collect samples until at least two bed residence times (the bed open volume is ~1.2 L) have passed.
3. Shutting Down the System
- Set the T-505, Bed #1 temperature control to zero output on MANUAL.
- Shut off flow to the reactor once the temperature begins to decrease.
- Close the block valves on Bed #1.
4. Using the Polarimeter
Analyze reaction product samples and the initial feed with the polarimeter. For a 15 wt. % sucrose feed, conversions should be in the range of 80 to 120 mL/min. Pure sucrose, glucose and fructose should be used as the calibration standards. See the appendix for more details on polarimetry.
- Turn on the sodium lamp and allow it to warm up for approximately 5 to 10 min. A yellow light will be visible.
- Check the zero position of the dial. At zero, a uniform dark field with no dark/light fringes, should be observed.
- Add 25 mL of the initial feed solution to a clean tube. Make sure the tube is completely filled. Use the same tube for both calibrations and measurement because the reading is path length dependent.
- Place the tube in the polarimeter. The tube should be facing up to remove any trapped air from the line of sight and the bulb should be near the eyepiece.
- Close the cover. If the solution rotates polarized light, dark/light fringes should be observed through the lens.
- Rotate the dial until the fringes disappear and a uniform dark field is observed.
- Read the rotation angle through the magnifying glass using the vernier scale. The dial divisions are 1 degree each and each vernier division is 0.05°. To adjust the focus, rotate the black dial located below the eyepiece.
- Repeat for each sample. Use DI water to clean the tube before each measurement.
Results
The polarimeter determines the fractional conversions of sucrose after reaction in a packed bed reactor. A previous polarimeter calibration for a three different sucrose feeds is shown in Figure 3.
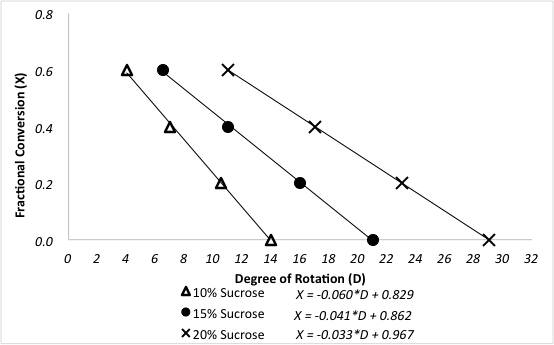
Figure 3. Relationship between degree of rotation and fractional conversion of sucrose for different feed concentrations.
Sample data are presented in Figure 4 for the reaction at 60 °C at varying sucrose feed concentrations. Fractional conversions were calculated directly from the polarimeter calibration curve using the following equation, where D is the degrees of rotation from the polarimeter:
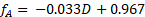 (4)
(4)
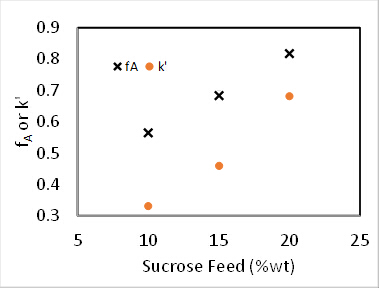
Figure 4. Sucrose inversion reaction at 60°C, 100 mL/min feed rate.
For both 0th and 1st order reactions, the conversion in a PFR is independent of feed concentration.2 Additionally, k' should be invariant for 1st order kinetics. Assuming the reactor to be a PFR, the 2nd order rate constant, k2 (mL/mmol sites • min), was determined by accounting for the 1st order dependence the catalyst, and the pseudo-1st order rate constant k' (mL/gcat • min) was determined by ignoring the 1st order dependence of the catalyst. The results of the pseudo-k' calculations are plotted in Figure 4. And the value of k2 was found by dividing k' by the concentration of catalyst (mmol acid sites/gcat) given previously.
 (5)
(5)
To determine whether the reaction kinetics were closer to 0, 0.5, 1, 1.5 or 2nd order in sucrose, nonlinear regression of the mass balance was used, and the sum of squared errors was minimized for all three runs. In order to use nonlinear regression, an objective function was formulated based on the integrated PFR mass balance and the respective reaction order. For example, the following is the objective function for a 1.5 kinetic order in sucrose concentration:
 (6)
(6)
Other objective functions can be formulated from the standard PFR mass balance solutions, which can be found in all kinetics textbooks.2 The experimental data in Figure 4 were fit to the integrated PFR mass balances for 1, 1.5 and 2 orders with respect to sucrose. The sum of squared errors for the three reaction orders were determined to be 0.39, 0.16 and 1.3, respectively. Therefore, the best fit was found to be n = 1.5 order. This leads to a k' value of 35 (mL/gcat • min).
It was initially thought that the kinetics were 1st order with respect to sucrose.2-3 Using this assumption, one can determine the number of equal volume CSTRs, N, in series that are required to model this reactor. Again, the sum of squared errors in the mass balance for all three runs were minimized to determine both N and k'. The data were fit to the tanks-in-series model for 1st order reactions:
 (7)
(7)
It was found that N = 2.1 "tanks" and k' = 0.62 mL/gcat • min. This is not a great fit because the reaction order is not exactly 1. The data suggest a sucrose order > 1. The relative standard deviations of fA were at most 2%, which is easily accounted for by the variation in temperature (as high as 9 °C). There was no evidence of catalyst deactivation. The fractional conversions for both a PFR and for two CSTR tanks in series was computed using the k's from nonlinear regression and plotted in Figure 1. For zeroth order, there was no difference between a PFR and CSTRs in series because the rate is independent of sucrose concentration. If the curves for 6 or greater CSTRs had been plotted, they would have coincided closely with the PFR curves. The predicted fractional conversions for two CSTR tanks in series is slower than a PFR for all reaction orders. The experimental data for 15 wt% sucrose is actually closer to a first-order reaction in PFR.
The error in k' can be estimated by comparing the differences in computed k' values at the average temperature deviation (4.5 °C) to the temperature of the reaction, 60 °C, using the Arrhenius equation and averaging the two literature activation energies. The estimated k' for 1.5 order kinetics at 64.5 °C is 52 (mL/mol)0.5 mL • gcat-1 • min-1, which is almost 50% higher than the regressed value of 35 (mL/mol)0.5 mL • gcat-1 • min-1. Slight variations in temperature can affect the k' greatly.
Application and Summary
The reaction does not behave exactly as expected because the apparent order n is > 1. Of all the phenomena that can cause such deviations in real reactors, deviations from ideal PFR behavior caused by axial mixing are suggested by the fact that fitting to the tanks-in-series model gives only a small number of tanks - for a perfect PFR, N should be at least 6. Such deviations are often found in relatively short beds, especially if the flow is multiphase (some water is vaporized in the reactor). However, another cause of the deviation is less apparent but probably even more important. The reaction is highly exothermic, and as mentioned, the temperature oscillated by as much as 9°C (mostly above the set point). The more sucrose in the feed, the more heat that will be generated. As might be expected, the oscillations were most significant with the 20 wt% feed. This suggests another reason for an apparent order n > 1: the more heat generated at a higher concentration of feed increases the reactor temperature more, which in turn increases the reaction rate resulting in a derived apparent order > the actual order. If the temperature is inadequately controlled, the reactor temperature might increase to the adiabatic limit. Deviations from ideal PFR behavior in both flow and temperature can affect the apparent kinetics derived from actual reactors, putting a premium on careful reactor scale-up to duplicate pilot-plant conditions of fluid flow and heat transfer.
Packed bed reactors have many uses in the chemical industry. Sulfuric acid, a chemical used to make hundreds of different products, is commonly manufactured in part using packed bed chemical reactors in series. Over 200 million tons are produced annually.In this reaction, sulfur dioxide and air are passed through fixed bed reactors in series (with intermediate heat exchangers for heat removal) containing a supported vanadium oxide catalyst at high temperatures.4 The SO2 is oxidized to SO3, which, when absorbed in water, makes sulfuric acid.
A more recent use for packed bed reactors is in production of biodiesel by transesterifying triglycerides, or esterifying fatty acids, with methanol. While biodiesel is produced in different ways, packed bed reactors can be advantageous for continuous production. Biodiesel is considered a renewable energy source because it is produced from algae or waste foodstuffs, and because it is biodegradable and non-toxic. Regardless of the catalyst used, it must be thoroughly purged from the product after the reaction, because even small amounts can render the fuel unusable.5
APPENDIX A – USING THE POLARIMETER
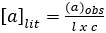
Polarimetry measures the extent to which a substance interacts with plane polarized light (light which consists of waves that vibrate only in one plane). It can rotate the polarized light to the left, to the right, or not at all. If it rotates polarized light to the left or to the right, it is “optically active”. If a compound does not have a chiral center, it will not rotate polarized light. The number of degrees and the direction of rotation are measured to give the observed rotation. The observed rotation is corrected for the length of the cell used and the solution concentration, using the following equation:
 (A1)
(A1)
where: a = specific rotation (degrees) (literature value), l = path length (dm), and c = concentration (g/mL).
Comparing the corrected observed rotation to literature values can aid in the identification of an unknown compound. However, if the compounds are known, it is more common to prepare calibration standards of the unknowns and correlate the observed rotation to concentration.
References
- J. Sauer, N. Dahmen and E. Henrich. "Chemical Reactor Types." Ullman's Encycylopedia of Industrial Chemistry (2015). Web. 15 Oct. 2016.
- H.S. Fogler, "Elements of Chemical Reaction Engineering," 4th Ed., Prentice-Hall, Upper Saddle River, NJ, 2006, Ch. 2-4; O. Levenspiel, "Chemical Reaction Engineering," 3rd Ed., John Wiley, New York, 1999, Ch. 4-6; C.G. Hill, Jr. and T.W. Root, "Introduction to Chemical Engineering Kinetics and Reactor Design," 2nd Ed., John Wiley, New York, 2014, Ch. 8.
- N. Lifshutz and J. S. Dranoff, Ind. Eng. Chem. Proc. Des. Dev., 7, 266-269 (1968).
- E.R. Gilliland, H. J. Bixler, and J. E. O'Connell, Ind. Eng. Chem. Fundam., 10, 185-191 (1971).
- "Sulfuric Acid." The Essential Chemical Industry. Univ. of York, 2016. http://www.essentialchemicalindustry.org/chemicals/sulfuric-acid.html. Accessed 10/20/16.
- E. Lotero, Y. Liu, D.E. Lopez, K. Suwannakarn, D.A. Bruce and J.G. Goodwin, Jr., Ind. Eng. Chem. Res.,44, 5353-5363 (2005); A. Buasri, N. Chaiyut, V. Loryuenyong, C. Rodklum, T. Chaikwan, and N. Kumphan, Appl. Sci.2, 641-653 (2012); doi:10.3390/app2030641.
Skip to...
Videos from this collection:

Now Playing
Liquid Phase Reactor: Sucrose Inversion
Chemical Engineering
9.7K Views

Testing the Heat Transfer Efficiency of a Finned-tube Heat Exchanger
Chemical Engineering
17.9K Views

Using a Tray Dryer to Investigate Convective and Conductive Heat Transfer
Chemical Engineering
43.9K Views

Viscosity of Propylene Glycol Solutions
Chemical Engineering
32.7K Views

Porosimetry of a Silica Alumina Powder
Chemical Engineering
9.6K Views

Demonstration of the Power Law Model Through Extrusion
Chemical Engineering
10.0K Views

Gas Absorber
Chemical Engineering
36.6K Views

Vapor-liquid Equilibrium
Chemical Engineering
88.7K Views

The Effect of Reflux Ratio on Tray Distillation Efficiency
Chemical Engineering
77.7K Views

Efficiency of Liquid-liquid Extraction
Chemical Engineering
48.4K Views

Crystallization of Salicylic Acid via Chemical Modification
Chemical Engineering
24.2K Views

Single and Two-phase Flow in a Packed Bed Reactor
Chemical Engineering
18.9K Views

Kinetics of Addition Polymerization to Polydimethylsiloxane
Chemical Engineering
16.1K Views

Catalytic Reactor: Hydrogenation of Ethylene
Chemical Engineering
30.4K Views

Evaluating the Heat Transfer of a Spin-and-Chill
Chemical Engineering
7.4K Views
Copyright © 2025 MyJoVE Corporation. All rights reserved