Tree Survey: Point-Centered Quarter Sampling Method
Overview
A number of methods are available for sampling forest communities. Point-centered quarter is one such method. It is used to gather information on the density, frequency, and coverage of tree species found in a forest. This information provides the ability to estimate the number of individual trees encountered, how often a certain tree occurs, how common the tree is compared to other trees, and the size of the tree. Compared to the standard plot analysis, the point-centered quarter method is more efficient, which is a major advantage. In a fixed-area plot sampling, a small portion of the total area of the forest is examined. In this small subsample, the density is determined directly by counting and identifying each tree. The ratio between size of the subplot and the overall forest size is used to determine the density for the entire forest.
Principles
In the point-centered quarter method, a point in the forest is identified and the area around it is separated into four quarters. In each quarter, the nearest tree with a diameter-at-breast-height (dbh) of ≥ 40 cm is identified. This is considered the “large tree” sample. In each quarter, the nearest tree with a dbh > 2.5 cm and < 40 cm is identified. This is considered the “small tree” sample. The dbh is the diameter (in cm) of a tree measured at 4½ feet above the existing grade. Identifying a large tree and small tree in each quadrant provides the ability to compare the overstory (the trees in a forest whose crowns constitute the highest layer of vegetation in a forest, typically forming the canopy) to the understory (vegetation growing beneath the forest canopy without penetrating it to any extent).
Using these measurements, the Basal Area and Importance Value of each tree species is calculated. The basal area is the cross-sectional area (in m2) of a single tree at breast height (4½ ft above the ground). The basal area of all trees of a species can be calculated to understand the species density in a site. This is used, instead of the number of trees per area, to take into account the size of the trees. The Importance Value of each species is calculated to understand the relative dominance of that species in a forest community. It is based on how commonly a species occurs across the forest, the total number of individuals of the species, and the total amount of forest area occupied by the species.
Procedure
1. Tree Survey
- Establish a 150 m transect in the forest.
- Place a stake every 50 m. Each stake (point) represents the center of four compass directions (N, E, W, S) that divide the sampling site into four quarters.
- In each quarter, the distance is measured from the stake to the nearest tree ≥ 40 cm, regardless of species. Only one large tree per quarter should be measured, so a total of 16 trees are recorded in the large tree category. Record the distance in cm for each.
- Collect a leaf sample from each tree. Be sure to note if the leaves are opposite, alternate, or wholred (Figure 1) before removing them. Place the sample on the herbarium paper, properly labeled with the tree number, and place in a plant press for later identification.
- Using a field measurement tape, measure the diameter of the tree at 4½ feet above the existing grade (dbh). Record the dbh. If using a dbh tape, read the diameter directly off the tape. If using a regular measuring tape, measure the circumference of the tree and then calculate the diameter using the formula C = π d.
- Repeat steps 1.3 – 1.5 for the nearest tree < 40 cm and > 2.5 cm in each quadrant. These trees are labeled the small tree category.
- Using the leaf samples, identify the species of each tree in the 16 large trees and the 16 small trees categories.

Figure 1. Examples of opposite, alternate, and whorled leaf arrangements.
2. Calculations
(Do separate analyses for large trees and small trees.)
- Calculate the mean point-to-tree distance for the entire sample of large trees, regardless of species. Calculate the mean point-to-tree distance for the entire sample of small trees, regardless of species.
- Calculate the average density (the number of trees/hectare) for both the large trees and the small trees.

- Determine the density by species for both the large trees and small trees. Then, count the number of individuals in the sample for each species and record (Table 1). The total number of individuals counted is 16.
Relative Density = (number of individuals of a species/16) x 100%
And
Density = (Relative Density/100) x Average Density - Determine and record the basal area by species (Table 2).
- Convert the diameter measures into areas for all trees sampled (a = π r2).
- Calculate the mean basal area for each species, i.e. take the average.
- For each species, calculate the Basal Area and Relative Basal Area.
Basal Area = Density x Average Basal Area
And
Relative Basal Area = (Basal Area / Total Basal Area) x 100
The Total Basal Area is the total basal area for all species (sum all BAs).
- Determine and record frequency by species (Table 3).
Frequency = (no. of points at which species occurs/total no. of points sampled)
And
Relative Frequency = (Frequency/Total Frequency for all species) x 100- The frequency of each species is determined by comparing the number of points at which that species occurred out of the 4 points sampled. For example, if an American Elm is found at all 4 of the points, the frequency would be 4/4 = 1. If a Silver Maple is found at 2 of the 4 points, the frequency would be 2/4 = 0.5.
- Calculate and record an Importance Value and Relative Importance Value by species (Table 4).
Importance Value = Relative Density + Relative Frequency + Relative Basal Area
And
Relative Importance Value = (Importance Value /Total Imp. Value for all species) x100 - Make a graph that depicts the importance value for each species on the y-axis and the species on the x-axis. Place them on the y-axis in order of Increasing Importance values. There should be one line for large trees and one line for small trees.
Large Trees |
|||
| # of individuals | Relative Density (%) | Density (trees/hectare) |
|
| Species 1 _______ | |||
| Species 2 _______ | |||
| Species 3 _______ | |||
| Species 4 _______ | |||
| Species 5 _______ | |||
| Species 6 _______ | |||
Small Trees |
|||
| # of individuals | Relative Density (%) | Density (trees/hectare) |
|
| Species 1 _______ | |||
| Species 2 _______ | |||
| Species 3 _______ | |||
| Species 4 _______ | |||
| Species 5 _______ | |||
| Species 6 _______ | |||
Table 1. A table to fill out information regarding the density of large and small trees.
Large Trees |
|||
| Average Basal Area (m2) |
Basal Area (m2) |
Relative Basal Area | |
| Species 1 _______________ | |||
| Species 2 _______________ | |||
| Species 3 _______________ | |||
| Species 4 _______________ | |||
| Species 5 _______________ | |||
| Species 6 _______________ | |||
| TOTAL | Total Basal Area = | ||
Small Trees |
|||
| Average Basal Area (m2) |
Basal Area (m2) |
Relative Basal Area | |
| Species 1 _______________ | |||
| Species 2 _______________ | |||
| Species 3 _______________ | |||
| Species 4 _______________ | |||
| Species 5 _______________ | |||
| Species 6 _______________ | |||
| TOTAL | Total Basal Area = | ||
Table 2. A table to fill out information regarding the basal area of large and small trees.
Large Trees |
|||
| # of points | Frequency | Relative Frequency | |
| Species 1 _______________ | |||
| Species 2 _______________ | |||
| Species 3 _______________ | |||
| Species 4 _______________ | |||
| Species 5 _______________ | |||
| Species 6 _______________ | |||
| TOTAL | Total Frequency = | ||
Small Trees |
|||
| # of points | Frequency | Relative Frequency | |
| Species 1 _______________ | |||
| Species 2 _______________ | |||
| Species 3 _______________ | |||
| Species 4 _______________ | |||
| Species 5 _______________ | |||
| Species 6 _______________ | |||
| TOTAL | Total Frequency = | ||
Table 3. A table to fill out information regarding the frequency of large and small trees.
Large Trees |
|||||
| Relative Density |
Relative Frequency |
Relative Basal Area |
Importance Value |
Relative Importance Value |
|
| Species 1 _______________ | |||||
| Species 2 _______________ | |||||
| Species 3 _______________ | |||||
| Species 4 _______________ | |||||
| Species 5 _______________ | |||||
| Species 6 _______________ | |||||
| Total IV = | |||||
Small Trees |
|||||
| Relative Density |
Relative Frequency |
Relative Basal Area |
Importance Value |
Relative Importance Value |
|
| Species 1 _______________ | |||||
| Species 2 _______________ | |||||
| Species 3 _______________ | |||||
| Species 4 _______________ | |||||
| Species 5 _______________ | |||||
| Species 6 _______________ | |||||
| Total IV = | |||||
Table 4. A table to fill out information regarding the Importance Value and Relative Importance Value of large and small trees.
Results
The point-centered quarter tree survey method produces three quantitative measures: the relative density, the relative frequency, and the relative basal area. These three values are added together to give the Importance Value of that species. This is then converted to a relative importance value (Table 5).
The importance value of a species can reach a maximum of 300 in a survey that only finds one species present. A high importance value does not necessarily mean that the species is important to the health of the forest; it merely means that the species currently dominates the forest structure (Figure 2).
Trees are an important natural resource that help a city’s environment, health, and overall quality of life. Therefore, having a good understanding of the composition of the forest is essential to maintaining this resource. For example, if the forest is very diverse, it can help minimize the impact from a species-specific insect or disease. If the understory shows a high frequency of invasive trees, it may indicate that they are beginning to outcompete and displace the native trees.

Figure 2. A bar graph of the Importance Value of trees in Sommes Woods.
Data Table: LARGE CATEGORY (dbh ≥ 40 cm) |
|||||||
| Tree Number | Point Number | Quadrant | Tree Species | Distance from point | Dbh | ||
| cm | m | cm | m | ||||
| 1L | 1 | NE | American Basswood | 500 | 5.0 | 49.1 | .491 |
| 2L | 1 | SE | Silver Maple | 12300 | 12.3 | 51.2 | .512 |
| 3L | 1 | NW | American Elm | 530 | 5.3 | 72.3 | .723 |
| 4L | 1 | SW | Silver Maple | 620 | 6.2 | 50.1 | .501 |
| 5L | 2 | NE | White Ash | 890 | 8.9 | 49.3 | .493 |
| 6L | 2 | SE | Northern Red Oak | 560 | 5.6 | 52.2 | .522 |
| 7L | 2 | NW | American Elm | 10500 | 10.5 | 63.4 | .634 |
| 8L | 2 | SW | White Ash | 12200 | 12.2 | 70.5 | .705 |
| 9L | 3 | NE | Northern Red Oak | 750 | 7.5 | 42.2 | .422 |
| 10L | 3 | SE | American Elm | 880 | 8.8 | 45.1 | .451 |
| 11L | 3 | NW | Northern Red Oak | 13100 | 13.1 | 52.0 | .520 |
| 12L | 3 | SW | White Ash | 14000 | 14.0 | 63.5 | .635 |
| 13L | 4 | NE | Silver Maple | 10200 | 10.2 | 70.1 | .701 |
| 14L | 4 | SE | Silver Maple | 650 | 6.5 | 72.6 | .726 |
| 15L | 4 | NW | White Ash | 320 | 3.2 | 82.1 | .821 |
| 16L | 4 | SW | Northern Red Oak | 12200 | 12.2 | 42.5 | .425 |
Data Table: SMALL CATEGORY (dbh < 40 cm) |
|||||||
| Tree Number | Point Number | Quadrant | Tree Species | Distance from point | Dbh | ||
| cm | m | cm | m | ||||
| 1S | 1 | NE | Sugar Maple | 750 | 7.5 | 10.3 | .103 |
| 2S | 1 | SE | White Ash | 520 | 5.2 | 12.1 | .121 |
| 3S | 1 | NW | White Ash | 360 | 3.6 | 9.5 | .095 |
| 4S | 1 | SW | Amur Honeysuckle | 650 | 6.5 | 14.1 | .141 |
| 5S | 2 | NE | European Buckthorn | 330 | 3.3 | 3.4 | .034 |
| 6S | 2 | SE | White Ash | 420 | 4.2 | 30.2 | .302 |
| 7S | 2 | NW | Sugar Maple | 510 | 5.1 | 22.5 | .225 |
| 8S | 2 | SW | Amur Honeysuckle | 660 | 6.6 | 17.2 | .171 |
| 9S | 3 | NE | Sugar Maple | 810 | 8.1 | 31.1 | .311 |
| 10S | 3 | SE | Amur Honeysuckle | 430 | 4.3 | 21.5 | .215 |
| 11S | 3 | NW | White Ash | 370 | 3.7 | 18.0 | .180 |
| 12S | 3 | SW | European Buckthorn | 470 | 4.7 | 5.6 | .056 |
| 13S | 4 | NE | European Buckthorn | 820 | 8.2 | 6.2 | .062 |
| 14S | 4 | SE | European Buckthorn | 650 | 6.5 | 8.5 | .085 |
| 15S | 4 | NW | European Buckthorn | 490 | 4.9 | 9.1 | .091 |
| 16S | 4 | SW | Sugar Maple | 310 | 3.1 | 13.3 | .133 |
Table 5. A table detailing representative results gathered from the point-centered tree survey method.
Application and Summary
Tree surveys are an important technique for both private and public stakeholders. They can provide helpful information to allow land managers to make informed decisions. A community may want to do a tree inventory to determine if there is a need for a forestry program. For example, the survey may reveal many dead or diseased trees (Figure 3) and indicate the need for more plantings. The survey may also help the community set up a maintenance schedule to prevent damage from hazardous trees. Lastly, the survey can help communities with land management decisions. Knowing the species diversity in a forest can allow the managers develop a plan for planting (Figure 4). For example, they can set guidelines such as, “Do not plant trees from a species that comprise more than x% of the forest.”
Tree surveys help quantify a forest’s value as a natural resource. Knowing the forest structure allows forest managers to calculate the worth of the services that the trees provide, such as air pollution control, carbon capture and storage, and energy use reductions.
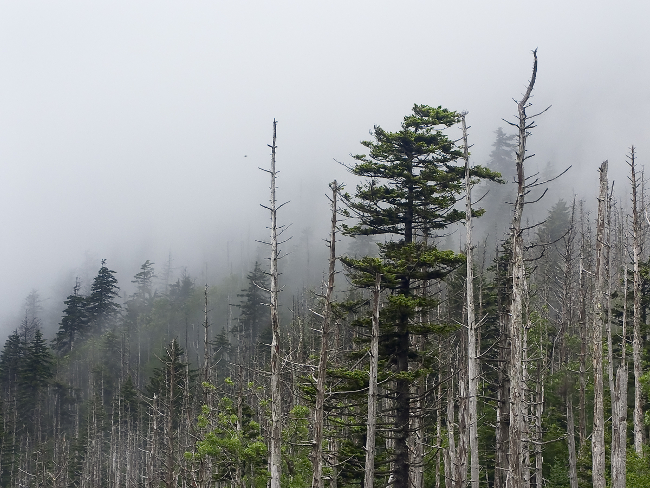
Figure 3. A photo of a forest with potentially diseased trees. A tree survey could help detect the presence of dying trees, so managers could plant new trees to maintain forest levels.

Figure 4. A photo of a healthy, diverse forest. A tree survey could help managers develop a plan for planting proper trees to maintain levels particular species numbers (so one tree type doesn’t take over a forest, for example).
Tags
Skip to...
Videos from this collection:

Now Playing
Tree Survey: Point-Centered Quarter Sampling Method
Environmental Science
49.4K Views

Tree Identification: How To Use a Dichotomous Key
Environmental Science
81.2K Views

Using GIS to Investigate Urban Forestry
Environmental Science
12.6K Views

Proton Exchange Membrane Fuel Cells
Environmental Science
22.1K Views

Biofuels: Producing Ethanol from Cellulosic Material
Environmental Science
53.1K Views

Testing For Genetically Modified Foods
Environmental Science
89.7K Views

Turbidity and Total Solids in Surface Water
Environmental Science
35.8K Views

Dissolved Oxygen in Surface Water
Environmental Science
55.7K Views

Nutrients in Aquatic Ecosystems
Environmental Science
38.8K Views

Measuring Tropospheric Ozone
Environmental Science
26.4K Views

Determination Of NOx in Automobile Exhaust Using UV-VIS Spectroscopy
Environmental Science
30.1K Views

Lead Analysis of Soil Using Atomic Absorption Spectroscopy
Environmental Science
125.4K Views

Carbon and Nitrogen Analysis of Environmental Samples
Environmental Science
29.4K Views

Soil Nutrient Analysis: Nitrogen, Phosphorus, and Potassium
Environmental Science
215.8K Views

Analysis of Earthworm Populations in Soil
Environmental Science
16.5K Views
Copyright © 2025 MyJoVE Corporation. All rights reserved