Lead Analysis of Soil Using Atomic Absorption Spectroscopy
Overview
Source: Laboratories of Margaret Workman and Kimberly Frye - Depaul University
Lead occurs naturally in soil, in levels ranging from 10-50 ppm. However, with the widespread use of lead in paint and gasoline in addition to contamination by industry, urban soils often have concentrations of lead significantly greater than background levels – up to 10,000 ppm in some places. Ongoing problems arise from the fact that lead does not biodegrade, and instead remains in the soil.
Serious health risks are associated with lead poisoning, where children are particularly at risk. Millions of children in the U.S. are exposed to soil containing lead. This exposure can cause developmental and behavioral problems in children. These problems include learning disabilities, inattention, delayed growth, and brain damage. The Environmental Protection Agency has set a standard for lead in soil at 400 ppm for play areas and 1,200 ppm for non-play areas.
Lead is also of concern in soil, when it’s used for gardening. Plants take up lead from the soil. Therefore, vegetables or herbs grown in contaminated soil can lead to lead poisoning. In addition, contaminated soil particles can be breathed in while gardening or brought into the house on clothing and footwear. It is recommended that soils with lead levels greater than 400 ppm should not be used for gardening. It is further recommended that soil with lead levels between 100 and 400 ppm not be used for leafy vegetables or herbs, because lead can be stored in the leaves. On a similar note, root vegetables should not be grown in this soil, because lead can also accumulate in plant roots.
Principles
Atomic Absorption Spectrometry, or AAS, is an elemental analysis technique that provides quantitative information on over 50 different elements. Concentrations as low as parts per billion (ppb) can be determined for some elements, with parts per million (ppm) being more common for various metals. This method has several benefits over others. For example, this technique measures the total concentration of an element, regardless of its form. In addition, the wavelength used is specific to the element being tested, so there is no interference from other elements in the sample, making it a fast and easy technique.
AAS is based on the absorption of discrete wavelengths of light by ground-state, gas-phase atoms. A hollow cathode lamp is used to emit light with the specific frequency. Atoms of different elements absorb characteristic wavelengths of light. The energy absorbed excites the electrons in the target element from their ground state to a higher energy state. The amount of light absorbed is proportional to the concentration of the element in the sample. Using a standard curve, the concentration of the element in the sample can then be determined.
Procedure
1. Soil Collection and Preparation
- In undisturbed areas, collect soil from the upper 1-2 inches of the soil. If sampling vegetable gardens, collect 6-inch deep samples. Use a soil auger to collect a 1-inch diameter soil core from sample area.
- Mix the sample thoroughly by shaking for 2 min and sieve using a USS #10 sieve.
- Dry the soil in a 40 °C oven for 24 h.
2. Sample Digestion
- Using an analytical balance, weigh out 1 g of the soil sample and place in a digestion tube. Record the weight of the sample to four decimal places.
- In a hood, add 5 mL of water to the digestion tube.
- Add 5 mL of concentrated HNO3 to the digestion tube.
- Mix the slurry with a stirring rod. Cover the digestion tube with a teardrop glass stopper.
- Put the digestion tube in the block digester and heat the sample to 95 °C and reflux for 10 min without boiling (Figure 1). Remember that this contains concentrated acid.
- Allow the tubes to cool. Add 5 mL of concentrated HNO3 to the digestion tube, replace the drop glass, and reflux for an additional 30 min. If brown fumes are generated, repeat this step over and over until no brown fumes are given off by the sample.
- Evaporate the solution to a 5 mL volume without boiling.
- Allow the tubes to cool, and then add 2 mL of distilled water and 3 mL of 30% H2O2. Cover with the glass stopper and heat to begin the peroxide reaction. Be sure that the solution does not boil over. Heat until the bubbling stops and allow to cool.
- Continue to add 30% H2O2 in 1 mL increments, warming until the bubbling is minimal. Do not add more than a total of 10 mL of the 30% H2O2.
- Cover the sample with the glass teardrop stoppers and heat until the volume is reduced to 5 mL without boiling.
- Add 10 mL concentrated HCl to the sample and cover with the glass teardrop stopper. Heat to 95 °C and reflux for 15 min.
- Allow the tubes to cool. If there are particulates, filter the sample using a glass fiber filter and collect filtrate in a 100-mL volumetric flask. Dilute the sample volume to 100 mL with distilled water.

Figure 1. Digestion tubes in a block digester.
3. Analyzing Samples with an Atomic Absorption Spectrometer
- Turn on the computer and the spectrometer.
- Set parameters on the instrument. (Parameters and procedures may vary depending on the brand of instrument used.) Set the acetylene pressure to >700 kPa (~100 psi), the acetylene valve set to 11 psi, and the air valve 45 psi.
- Open the SpectraAA software
- Open a new worksheet.
- Choose “Add Method” and click on Pb to do a Lead Analysis.
- Set Type/Mode parameters to the following:
- Type = Flame
- Element = Pb
- Sampling Mode = Manual
- Instrument Mode = Absorbance
- Flame Type = Air/Acetylene
- Air Flow = 13.5
- Acetylene Flow = 2.0
- Online Diluter Type = SIPS
- Set the Measurements parameters to the following:
- Measurement Mode = PROMT
- Calibration Mode = Concentration
- Times: Measurement = 10
- Times: Read Delay = 10
- Replicates: Standard = 3
- Replicates: Sample = 3
- Precision (%): Standard = 1.0
- Precision (%): Sample = 1.0
- Set the Optical parameters to the following:
- Lamp Position = #4
- Lamp Current (mA) = 10.0 mA
- Wavelength = 217.0 nm
- Slit = 1.0 nm
- Background = BC Off
- Set the SIPS parameters to the following:
- Nebulizer Uptake Rate = 5.0 mL/min
- Right Pump = none
- Standard Additions = Unselect
- Calibration Mode = Auto Set Std Concentrations
- Dual Pump Calibration = Unselect
- Under the Standards tab, a list of standards automatically populates for the particular test. A 1,000 ppm Pb standard for atomic absorption spectrometry purchased from a chemical supply company is used and automatically diluted by the instrument. A new calibration curve is generated each time a new set of samples is run.
- Exit the Edit Method menu and click on the “Labels” tab. Input information regarding sample names and number of samples.
- Using the “Analysis” tab, use the “Select” button to highlight the samples to be analyzed.
- Turn on the flame by pressing the ignite button on the instrument.
- Zero the instrument by aspirating a blank and pressing the “Alt” and “Read” keys simultaneously.
- Place the pump tubing in the blank solution and press “Start.” Once the calibration has been performed, place the pump tubing in the sample and press the “Read” key. Continue for all samples.
- Turn off the instrument by pressing the red power off button on the instrument. Turn off all gas tanks and remove all samples.
Results
The software creates the calibration curve and automatically determines the concentration of the Pb in the samples (Figure 2).

Figure 2. The calibration curve and the concentration of the Pb in the samples automatically determined by the software.
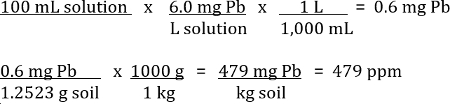
The values given on the worksheet are mg/L of Pb in the sample solution. Additional calculations must be done to convert this number to the ppm of Pb in the soil sample.
Example:
For a soil sample that weighed 1.2523 g before digestion was measured by the AAS to have 6.0 mg/L of Pb in the 100 mL solution sample (Table 1).
| Soil Lead Level (ppm) | Level of Contamination |
| Less than 150 | None to very low |
| 150-400 | Low |
| 400-1,000 | Medium |
| 1,000-2,000 | High |
| Greater than 2,000 | Very High |
Table 1. Soil lead levels measured in ppm and the corresponding levels of contamination.
Application and Summary
Atomic Absorption Spectrometry is a useful technique to analyze a wide range of environmental samples (e.g., water, soil, sludge, and sediment) for a large number of elements (e.g., heavy metals). This experiment highlights the use of flame AAS to determine the Pb content in soil. However, it could also be used to measure concentrations of Cu, Fe, Mn, K, Na, Mg, and Zn in soils.
Zinc is an important micronutrient and is needed for protein synthesis. Zn helps regulate the expression of genes needed to protect cells when under environmental stress conditions. Zinc deficiency is a large problem in crop and pasture plants around the world, resulting in decreased yields. It is estimated that half of all soils used for cereal production have a zinc deficiency. This leads to a zinc deficiency in the grain. As a result, zinc deficiency in humans is a serious nutritional problem worldwide, affecting 1/3 of the world’s population. A typical range of zinc in soils is 10 – 300 mg/kg with a mean of 55 mg/kg.
Iron is the fourth most abundant element on Earth. However, it is mostly found in forms not available for plants, such as in silicate minerals or iron oxides. Iron is involved in photosynthesis, chlorophyll formation, nitrogen fixation, and many enzymatic reactions in plants. Iron deficiency in soil is rare, but it can become unavailable in excessively alkaline soils. Symptoms of iron deficiency in soil include leaves turning yellow and a decrease in yield. A typical range of iron in soils is 100 – 100,000 ppm with a mean of 26,000 ppm.
Copper is an essential micronutrient for plants. Copper promotes seed production, plays a role in chlorophyll formation, and is essential for enzyme activity. Copper deficiency can be seen by light green to yellow leaves. The leaf tips die back and become twisted. If the deficiency is severe enough, growth of the grain can stop and the plants die. Available copper in soils can vary from 1 to 200 ppm. Availability of copper is related to the soil pH – as pH increases, the availability of copper decreases.
Atomic Absorption Spectrometry can also be used on non-environmental samples, including:
Water analysis (Ca, Mg, Fe, Al, Ba, Cr)
Food analysis (Cd, Pb, Al, Cu, Fe)
Additives in oils (Ba, Ca, Na, Li, Zn, Mg, V, Pb, Sb)
Fertilizers (K, B, Mo)
Clinical samples (blood, serum, plasma, urine, Ca, Mg, Li, Na, K, Fe, Cu, Zn, Au, Pb)
Cosmetics (Pb)
Mining (Au)
References
- Robinson, J.W., Skelly Frame, E.M., Frame II, G.M. Undergraduate Instrumental Analysis. 6th Ed. Marcel Dekker, New York (2005).
- United States Environmental Protection Agency. “Lead based paint poisoning prevention in certain residential structures.” CFR 40 Part 745. http://www.ecfr.gov. (2015).
Skip to...
Videos from this collection:

Now Playing
Lead Analysis of Soil Using Atomic Absorption Spectroscopy
Environmental Science
125.4K Views

Tree Identification: How To Use a Dichotomous Key
Environmental Science
81.2K Views

Tree Survey: Point-Centered Quarter Sampling Method
Environmental Science
49.4K Views

Using GIS to Investigate Urban Forestry
Environmental Science
12.6K Views

Proton Exchange Membrane Fuel Cells
Environmental Science
22.1K Views

Biofuels: Producing Ethanol from Cellulosic Material
Environmental Science
53.2K Views

Testing For Genetically Modified Foods
Environmental Science
89.7K Views

Turbidity and Total Solids in Surface Water
Environmental Science
35.8K Views

Dissolved Oxygen in Surface Water
Environmental Science
55.8K Views

Nutrients in Aquatic Ecosystems
Environmental Science
38.9K Views

Measuring Tropospheric Ozone
Environmental Science
26.4K Views

Determination Of NOx in Automobile Exhaust Using UV-VIS Spectroscopy
Environmental Science
30.1K Views

Carbon and Nitrogen Analysis of Environmental Samples
Environmental Science
29.4K Views

Soil Nutrient Analysis: Nitrogen, Phosphorus, and Potassium
Environmental Science
215.8K Views

Analysis of Earthworm Populations in Soil
Environmental Science
16.5K Views
Copyright © 2025 MyJoVE Corporation. All rights reserved