Testing For Genetically Modified Foods
Overview
Source: Laboratories of Margaret Workman and Kimberly Frye - Depaul University
Genetic modification of foods has been a controversial issue due to debated concerns over health and environmental safety. This experiment demonstrates technical understanding of how food DNA is genetically identified, allowing for educated decision making about the safety and potential dangers of using genetically modified organisms (GMOs) in food supplies.
Polymerase Chain Reaction (PCR) is used to amplify food DNA to test for the presence of genetically modified DNA in food products. Presence of specific DNA bands is detected by using gel electrophoresis to pull extracted food DNA through a 3% agarose gel, a concentration dense enough to separate the bands of DNA containing the genetically modified DNA. Several controls are used in the electrophoresis procedure to ensure DNA is successfully extracted from test foods (plant primer), and to provide known examples of both genetically modified DNA (purchased genetically modified DNA) and non-genetically modified DNA (purchased certified non-GMO food control).
Principles
Polymerase Chain Reaction (PCR) identifies sequences of DNA that have been inserted into the GM plant. In contrast to proteins, DNA is a relatively stable molecule, thus DNA fragments can be isolated from highly processed goods and are sufficiently intact to be amplified by PCR. Genetic engineers use only a small number of regulatory sequences (promoter and terminator sequences) to control the expression of the inserted genes, and so these sequences are common to the majority of GM crops. The two sequences identified in this procedure are two of the most common regulatory sequences, 35S promoter gene from cauliflower mosaic virus (CaMV) and the nopaline synthase (NOS) terminator gene from Agrobacterium tumefaciens.
PCR involves repetitive cycles, each consisting of template denaturation, primer annealing, and extension of the annealed primer by Taq DNA polymerase. Once DNA is extracted from food, a thermal cycler is used to rapidly manipulate temperature, causing the stages of the PCR cycles.
The denaturing stage occurs when samples are rapidly heated to 94 °C, causing the DNA strands to separate. Rapid cooling to 59 °C allows primers to anneal to the separated DNA strands, then reheat to 72 °C for Taq DNA polymerase to extend the primers, making complete copies of each DNA strand and completing one thermal cycle.
The amplified DNA can then be run through an agarose gel with electrophoresis to separate the DNA into visible bands for identification of the 35S promoter gene and the NOS terminator. Amplified DNA is loaded into wells at one end of the gel, using a purchased loading dye that helps weigh down the sample to prevent dissolution into the surrounding buffer. The loading dye also provides a visual, so the movement of DNA can be seen during electrophoresis in the dye “front.” The electrophoresis process works by using an electric current separated into cathode and anode ends. DNA is loaded into the gel on the end closest to the cathode side of the chamber, and the negative charge of DNA is attracted to the anode end of the chamber and is pulled through the agarose. Larger sequences of DNA (increased number of base pairs) cannot move as easily through agarose and will separate out early, while the smaller sequences are able to travel farther down the gel toward the anode end.
A staining process helps by binding to the DNA in order to add contrast between the background gel and the banks of DNA for better visualization of results. Using provided known locations for the different sizes of DNA sequences each test gel can be analyzed for the presence or absence of the 35S promoter and NOS terminator genes.
Controls are used to ensure DNA is extracted properly and to provide a comparison to the test food samples. Purchased plant primer is added to each sample to provide nucleic acids common to all plants. This allows for a quality control check on the DNA extraction process, because any plant DNA extracted should be extended with this primer during PCR and should also be seen on the gel after electrophoresis is complete. Purchased primer for the 35S and NOS genes are used as a positive control to provide DNA bands on the gel for genetic modification. If the GMO-positive template control does not amplify, there is a problem with the PCR reaction and a GMO-negative result from the test food cannot be trusted. A certified non-GMO food product is also purchased and used as a negative control to show what DNA separation looks like when no genetically modified material is present.
Procedure
1. Extraction of DNA From Food Samples
- Add 500 µL of purchased PCR mix matrix to each of the 2 screw-cap tubes using a transfer pipet or 200-1,000 µL adjustable-volume micropipette. Pipette up and down with the pipet between each aliquot to evenly mix the PCR matrix.
- Label one screw-cap tube “non-GMO” and the other “test”.
- Weigh out 0.5 g of certified non-GMO food and put it into the mortar.
- Add 2.5 mL of distilled water and grind with pestle for 2 min to form a slurry.
- Add another 2.5 mL of distilled water and continue grinding with pestle until slurry becomes smooth enough to pipet.
- Pipet 50 µL of ground slurry to the screw-cap tube containing 500 µL of PCR premix labeled “non-GMO” using the 50-µL mark on a graduated pipet. Recap tube.
- Repeat steps 1.3–1.6 to prepare the test food sample.
- Pipet 50 µL of ground test food slurry to the screw-cap tube labeled “test”. Recap tube.
- Vortex the non-GMO food and test food PCR tubes for 1 min and place tubes in 95 °C water bath for 5 min. If no vortex is available, flick the tube several times to mix before placing in water bath.
- Place tubes in a centrifuge for 5 min. A solid pellet should form at the bottom of the tube. If pellet is not formed after 5 min, centrifuge again for 2 min intervals until pellet forms.
- Tubes can be used immediately for PCR or stored in a refrigerator for up to 1 week.
2. Setting Up PCR Reactions
- Number PCR tubes 1–6 and initial them. The numbers should correspond to the following tube contents listed in Table 1.
- Place each labeled PCR tube in a microtube holder with caps open.
- Using a fresh tip for each addition, add 20 µL of the primer indicated on Table 1 to each PCR tube. Cap tubes.
- Using a fresh tip for each tube, add 20 µL of the DNA sample indicated on Table 1 to each PCR tube, being sure to pipette only from the supernatant and avoiding the solid pellet at the bottom of the tubes.
- After each DNA sample is pipetted into the corresponding PCR tube, use pipette to mix DNA and primer by pipetting gently up and down; recap tubes.
- Place PCR tubes in thermal cycler and program the cycler for:
Initial Denature: 1 cycle at 94 °C for 2 min.
Amplification: 40 cycles at 94 °C for 1 min (denature), 59 °C for 1 min (annealing), and 72 °C for 2 min (extension).
Final Extension: 1 cycle at 72 °C for 10 min.
Hold: 4 °C indefinitely.
3. 3% Agarose Gel Preparation
- Using lab or masking tape, securely tape off the open ends of the gel tray. Ensure tape is sealed to the edges of the tray to prevent molten agarose from leaking out.
- Weigh out 3 g of agarose into a 250-mL or larger Erlenmeyer flask.
- Add 100 mL of 1x TAE buffer (purchased or prepared from concentrate).
- Using a magnetic hot plate with a stir bar, heat the beaker until agarose is completely dissolved in the buffer and the solution is boiling and turns clear. Alternatively, a microwave oven can be used by placing beaker in oven and heating for 30 s intervals, using a stir rod to mix every 10 s, repeating until mixture is boiling and turns clear.
- Invert a 50-mL Erlenmeyer flask into the opening of the 250-mL flask to act as a reflux, preventing agarose solution from evaporating.
- Allow agarose solution to cool to 60 °C, and pour 30-50 mL into each taped gel tray.
- Place a gel comb into the first pair of notches to create gel wells.
- Allow gel to cool completely before removing tape and comb. Gel will solidify and turn from clear to cloudy when ready, approximately 10-20 min.
4. Electrophoresis of PCR Products
- Place a pre-made 3% agarose gel onto a gel tray or use a gel tray that has been used to cast a poured 3% agarose gel.
- Slide gel tray into the electrophoresis chamber with the wells closest to the cathode (black) end.
- Pour 1x TAE buffer into the chamber, enough to have 2 mm of buffer above the top of the gel tray.
- Obtain PCR tubes from the thermal cycler and place in microtube holder.
- Using a fresh pipette tip each time, add 10 µL of purchased Orange G loading dye (LD) to each sample and mix well.
- Load 20 µl of the molecular weight ruler and 20 µL of each sample into the gel in the order indicated (Table 2).
- Run gel electrophoresis for 30 min at 100 V.
- Remove gel tray from chamber and slide gel to remove from tray. Place gel in a staining tray.
- Immerse gel in purchased DNA gel stain for 5 min, carefully shaking tray to help distribute the stain throughout the gel.
- Transfer the gel into a washing container and rinse with tap water (40-55 °C) for approximately 10 s.
- Destain by washing 3x in warm tap water for 6 min each with gentle shaking for best results. If necessary, continue destaining in warm water until the desired contrast is reached.
| Tube number | Primer | Dna Sample |
| 1 | 20 µL Plant primer (green) | 20 µL Non-GMO food control DNA |
| 2 | 20 µL GMO primer (red) | 20 µL Non-GMO food control DNA |
| 3 | 20 µL Plant primer (green) | 20 µL Test food DNA |
| 4 | 20 µL GMO primer (red) | 20 µL Test food DNA |
| 5 | 20 µL Plant primer (green) | 20 µL GMO positive control DNA |
| 6 | 20 µL GMO primer (red) | 20 µL GMO positive control DNA |
Table 1. List of the appropriate tube numbers, primers, and DNA samples.
| Well 1 | Sample 1 Non-GMO food control with plant primers 20 µL. |
| Well 2 | Sample 2 Non-GMO food control with GMO primers 20 µL. |
| Well 3 | Sample 3 Test food with plant primers 20 µL. |
| Well 4 | Sample 4 Test food with GMO primers 20 µL. |
| Well 5 | Sample 5 GMO positive DNA with plant primers 20 µL. |
| Well 6 | Sample 6 GMO positive DNA with GMO primers 20 µL. |
| Well 7 | PCR molecular weight ruler 20 µL. |
| Well 8 | Leave empty. |
Table 2. The appropriate order to load 20 µL of the molecular weight ruler and 20 µL of each sample into the gel.
Results
After destaining, gels can be analyzed by looking at test food lanes (Table 3) to determine if the DNA bands for the 35S promoter and NOS terminator genes are present in the known locations on the gel. Placing the gel on a UV light box can help provide increased contrast (Figure 1). Alternatively, gels can be placed on white or yellow paper to provide a contrasting background to highlight DNA bands (Figure 2).

Figure 1. A destained gel showing separated bands of DNA. Agarose gel following agarose gel electrophoresis on UV light box.

Figure 2. Diagram of known locations for the 35S promoter and NOS terminator DNA. The presence or absence of a 200 bp band in lane 5 indicates whether or not the test food contains GMOs.
| Lane 1: Non-GMO food with plant primers | 455 bp |
| Lane 2: Non-GMO food with GMO primers | No band |
| Lane 3: Test food with plant primers | 455 bp |
| Lane 4: Test food with GMO primers | 200 bp or no band |
| Lane 5: GMO-positive template with plant primers | 455 bp |
| Lane 6: GMO-positive template with GMO primers | 200 bp |
| Lane 7: PCR molecular weight ruler | 1,000, 700, 500, 200, 100 bp |
Table 3. PCR Sample Band Sizes (base pairs (bp)).
Application and Summary
Polymerase Chain Reaction (PCR) is used to amplify DNA, allowing for a wide range of DNA lab testing. One area of testing now possible with PCR is to identify GMOs by testing for presence or absence of the DNA sequences used in the genetic modification of food crops. Typically, a crop is genetically modified to confer an advantage against natural deterrents to ideal yields, e.g. pests (Figure 3), diseases, drought conditions (Figure 4), etc. Because the advantage is gained by inserting genetic material from a different species into the crop plant’s own DNA, potential human health and environmental risks have been identified with the use of GMOs. One environmental concern is the ability of the genetically modified DNA to be exchanged unintentionally through pollination processes, which could lead to genetically modified DNA entering the genomes of crops intended to be sold as non-GMOs.
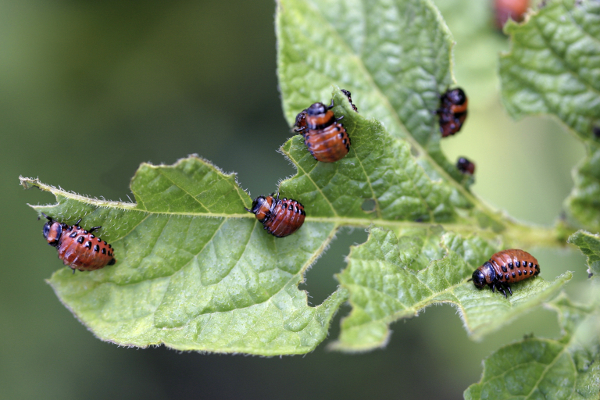
Figure 3. Larvae of Colorado beetle, devouring leaves of a potato.
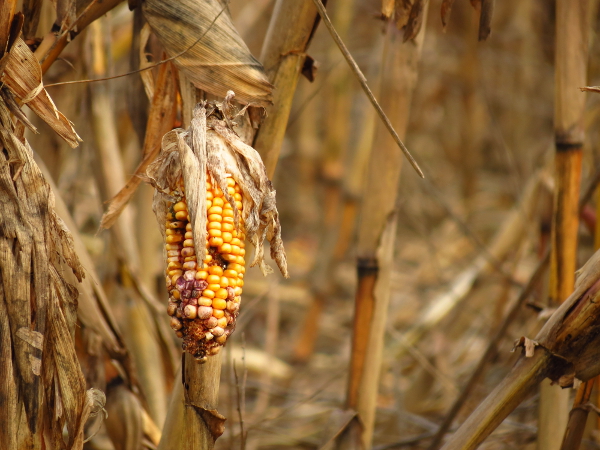
Figure 4. Corn destroyed by drought.
Skip to...
Videos from this collection:

Now Playing
Testing For Genetically Modified Foods
Environmental Science
89.7K Views

Tree Identification: How To Use a Dichotomous Key
Environmental Science
81.2K Views

Tree Survey: Point-Centered Quarter Sampling Method
Environmental Science
49.4K Views

Using GIS to Investigate Urban Forestry
Environmental Science
12.6K Views

Proton Exchange Membrane Fuel Cells
Environmental Science
22.1K Views

Biofuels: Producing Ethanol from Cellulosic Material
Environmental Science
53.2K Views

Turbidity and Total Solids in Surface Water
Environmental Science
35.8K Views

Dissolved Oxygen in Surface Water
Environmental Science
55.7K Views

Nutrients in Aquatic Ecosystems
Environmental Science
38.9K Views

Measuring Tropospheric Ozone
Environmental Science
26.4K Views

Determination Of NOx in Automobile Exhaust Using UV-VIS Spectroscopy
Environmental Science
30.1K Views

Lead Analysis of Soil Using Atomic Absorption Spectroscopy
Environmental Science
125.4K Views

Carbon and Nitrogen Analysis of Environmental Samples
Environmental Science
29.4K Views

Soil Nutrient Analysis: Nitrogen, Phosphorus, and Potassium
Environmental Science
215.8K Views

Analysis of Earthworm Populations in Soil
Environmental Science
16.5K Views
Copyright © 2025 MyJoVE Corporation. All rights reserved