
Stress-Strain Characteristics of Aluminum
Genel Bakış
Source: Roberto Leon, Department of Civil and Environmental Engineering, Virginia Tech, Blacksburg, VA
Aluminum is one of the most abundant materials in our lives, as it is omnipresent in everything from soda cans to airplane components. Its widespread use is relatively recent (1900AD), primarily because aluminum does not occur in its free state, but rather in combination with oxygen and other elements, often in the form of Al2O3. Aluminum was originally obtained from bauxite mineral deposits in tropical countries, and its refinement requires very high-energy consumption. The high cost of producing quality aluminum is another reason why it is a very widely recycled material.
Aluminum, especially when alloyed with one or more of several common elements, has been increasingly used in architectural, transportation, chemical, and electrical applications. Today, aluminum is surpassed only by steel in its use as a structural material. Aluminum is available, like most other metals, as flat-rolled products, extrusions, forgings, and castings. Aluminum offers superior strength-to-weight ratio, corrosion resistance, ease of fabrication, non-magnetic properties, high thermal and electrical conductivity, as well as ease of alloying.
İlkeler
Both from its position in the periodic table, with an atomic number of 13 at the limit between metallic and non-metallic elements, and from its face-centered cubic (FCC) structure, it is clear that aluminum is one of the most chemically active elements. In fact, it has a very strong affinity for oxygen, which would seem to make aluminum easily prone to corrosion. Interestingly, the surface of a newly produced aluminum will react instantly with oxygen, producing a thin, relatively stable and inert oxide layer that protects the base metal both from oxidation and other types of chemical attacks. This surface property, in addition to its relative lightweight nature and hardness, is what makes aluminum a very desirable construction material.
The oxide coating on aluminum surfaces is generally very thin (about 50 to 100 Å) and adheres tightly to the base material, unlike the typical iron oxides that are common in steels. The oxide layer is so thin that it does not affect the mechanical properties of aluminum, and is almost transparent to the eye, thereby not detracting from the aesthetic qualities of the material. There are a number of anodizing techniques that can be used to increase the thickness of this oxide layer to improve its corrosion and abrasion resistance. One potential disadvantage of aluminum to consider before using it is that it melts at a relatively low temperature, and thus is not suitable for high-temperature applications.
Aluminum is lightweight, having a density roughly 1/3 of that of steel; this 1/3 relationship also holds true for the modulus of elasticity, which is often taken as about 70GPa (10,000 ksi) for aluminum. Its strength and other mechanical properties, which are very low in its pure state, can be substantially improved by alloying and heat treatment, just as is the case for steel. Strengthening can also be achieved through cold working or strain hardening, where the material is rolled or drawn through dies resulting in a reduction in area of the sheet or bars.
The principal alloying additions to aluminum are copper, manganese, silicon, magnesium, and zinc. Other elements are also added in smaller amounts for grain refinement and to develop special properties:
- Copper has appreciable solubility in aluminum and imparts a substantial strengthening effect through the age-hardening characteristics of the alloy. Many aluminum alloys contain copper either as the major addition or among the principal alloying elements, in concentrations of 1 to 10%.
- Manganese has limited solid solubility in aluminum, but in concentrations of about 1% forms an important series of non- heat-treatable wrought aluminum alloys.
- Silicon lowers the melting point and increases the fluidity of aluminum. A moderate increase in strength is also provided by silicon additions.
- Magnesium provides substantial strengthening and improvement of the work-hardening characteristics of aluminum. It has a relatively high solubility in solid aluminum but Al-Mg alloys containing less than 7% Mg do not show appreciable heat-treatment characteristics. Magnesium is also added in combination with other elements, notably copper and zinc, for even greater improvements in strength.
- Zinc is employed in casting alloys and in conjunction with magnesium in wrought alloys to produce heat-treatable alloys having the highest strength among aluminum alloys.
- Tin improves the antifriction characteristic of aluminum, and cast Al-Sn alloys are often used for bearings.
- Copper and silicon are alloyed together in the commonly used 3xx.x series casting alloys. Desirable ranges of characteristics and properties are obtained in both heat-treatable and non-heat- treatable alloys.
- Magnesium and silicon are added in approximate proportions to form Mg2Si, which is a basis for age-hardening in both wrought and cast alloys.
Two general types of aluminum products are commonly recognized: wrought and cast. Any aluminum formed by flowing material into a sand or permanent mold, to be die cast, or to be cast by any other process where the casting is the final form, is termed a cast aluminum; any other product is taken as a wrought product. In the USA, aluminum wrought alloys (sheet, plate, extrusions, and forgings) have a four-digit identification number, while cast alloys have a three-digit number to the left of the decimal point and one digit to the right of the decimal point (see Table 1). The first digit defines the major alloying ingredient for both wrought and cast alloys. The major alloying ingredient is usually 5 percent or less (by weight) in wrought alloys and the same or higher in cast alloys. Most of the alloys contain two to four other elements but in a much smaller amount than the major alloying ingredient. In the wrought alloy designation, the last two digits in the 1XXX series give the minimum aluminum percentage above 99.00%. In the 2XXX through 9XXX series, the last two digits specify the individual alloys registered for the series. The second digit designates a modification of the original alloy. The alloy designation system is similar for castings. In this case, the second and third digits give the minimum aluminum percentage above 99.00% for the lXX.X alloys. In the 2XX.X through 9XX.X series, the second two numbers are the individual alloys registered in the series. For cast alloys, the number to the right of the decimal point gives product form: 0 for castings, and 1 and 2 (narrower composition limits than 1) for ingot. Alloys in the 2, 6 and 7 groups are heat treatable.
Table 1: Wrought and Cast Aluminum Alloy Designation System.
| Wrought Alloys | Cast Alloys | ||
| Alloy | Major alloying ingredient | Alloy | Major alloying ingredient |
| 1XXX | 99% minimum aluminum | lXXX.X | 99% minimum aluminum |
| 2XXX | Copper | 3XX.X | Silicon, with copper and/or magnesium |
| 3XXX | Manganese | 4XX.X | Silicon |
| 4XXX | Silicon | 5XX.X | Magnesium |
| 5XXX | Magnesium | 7XX.X | Zinc |
| 6XXX | Magnesium and silicon | 8XX.X | Tin |
| 7XXX | Zinc | ||
| 8XXX | Other elements | ||
In addition, a temper number is used to indicate how the product was fabricated, and applies to both wrought and cast products. F and O tempers apply to all alloys and product forms. Tempers designated TXXXX apply to alloys and product forms that receive and respond to a thermal treatment after fabrication. These alloys are said to be heat-treatable. Wrought alloys in the 2XXX, 6XXX, and 7XXX series and the cast alloys are generally in this group. Non-heat-treatable alloys gain their strength and other characteristics by strain hardening, and a temper of H is specified. Included in this group are the 1 XXX, 3XXX, and 5XXX series. More details on tempers are contained in various Aluminum Association reference documents.
The basic tempers are:
- "F" or fabricated: Applies to products of forming processes in which no special control over thermal or work hardening conditions is employed.
- "0" or annealed: Applies to wrought products, which have been heated to effect recrystallization and to produce the lowest strength condition, and to cast products, which are annealed to improve ductility and dimensional stability.
- "H" or strain-hardened: Applies to wrought products which are strengthened by strain-hardening through cold-working; the strain-hardening may be followed by supplementary thermal treatment which produces some reduction in strength. The H is always followed by two or more digits. There are three basic strain-hardening categories: HI, H2 and H3, where the first digit indicates the basic operations (1= strain hardened only; 2 = strain-hardened and partially annealed; 3 = strain-hardened and stabilized). The second digit indicates the degree of strain-hardening (1= quarter; 2 = half; 3 = full; and 4 = extra hard).
- "W" or solution heat-treated: An unstable temper applicable only to alloys which spontaneously age at room temperature after solution heat-treatment.
- "T" or thermally treated: Applies to products which are heat-treated, sometimes with supplementary strain-hardening, to produce a stable temper other than F or 0. The T is always followed by one or more digits. Basically, heat-treatable aluminum alloys will naturally age at room temperature following quenching and will be strengthened by precipitation-hardening.
Fig. 1 shows a typical stress-strain curve for the 6061 T6 aluminum. This is a material with good strength and stiffness, easy to finish and anodize. 6061 T6 aluminum is commonly used in casings for many electronic products, such as laptops and televisions.
The stress-strain curve in Fig. 1 does not exhibit a sharp yield point, but rather a gradual decrease in modulus of elasticity. To determine a yield point for engineering purposes, ASTM and other organizations have adopted the 0.2% offset approach. As shown in Fig. 2, this requires determining a best-fit line for the linear portion of the behavior, and drawing a line with a similar slope beginning at 0.2% strain. The strength at which this second line intersects the stress-strain curve is arbitrarily defined as the yield strength.

Figure 1: Typical stress-strain curve for a heat-treated aluminum.

Figure 2: Definition of yield strength for materials without an obvious yield point.
Prosedür
Tension Testing of Aluminum
The purpose of this experiment is:
- To acquaint students with the standard laboratory test for determining the tensile properties of metallic materials in any form (ASTM E8),
- To compare the properties of commonly used engineering metallic materials (structural steel and aluminum), and
- To compare the tested properties of metals to published values.
It will be assumed that a universal testing machine (UTM) with deformation control and associated testing and data acquisition capabilities is available. Follow step-by-step the procedures to perform tensile tests provided by the manufacturer of the UTM, paying particular attention to the safety guidelines. Do not proceed if you are uncertain about any step; clarify any doubts with your lab instructor as you can seriously injure yourself or those around you if you do not follow proper precautions. Also make sure you know all emergency stop procedures and that you are familiar with the software running the machine.
The procedure below is generic and is meant to cover most important steps; there may be significant deviations from it depending on the available equipment.
1. Prepare Specimen:
- Obtain a cylindrical test specimen for a common aluminum such as 6061T6.
- Measure the diameter of the test specimen to the nearest 0.002 in. at several locations near the middle using a caliper.
- Hold the specimen firmly and mark, using a file, an approximate 2 in. gage length. Note: Mark the gage length carefully so that it is clearly etched, but not so deep as to become a stress concentration that can lead to fracture.
- Measure the actual marked gage length to the nearest 0.002 in. using a caliper.
- If possible, install a longitudinal strain gage as described in the JoVE video on "Material Constants".
- Collect all available information on the calibration data and resolution of all instruments being used to help assess potential experimental errors and confidence limits. These two issues are key to obtaining meaningful results, but are beyond the scope of what is discussed here.
2. Test the Specimen:
Turn on the testing machine and initialize the software. Make sure that you have set up any appropriate graphing and data acquisition capabilities within the software. At a minimum, you should display the stress-strain curve and have displays for the load and strain.
- Select an appropriate testing procedure within the software that is compatible with the ASTM E8 testing protocol. Please note the strain rate being used and whether two rates, one for the elastic and one for the inelastic range, are being used. Set any appropriate actions in the software (e.g., for the machine to stop at 5% strain so you can safely remove the extensometer and to keep the maximum value of load that is reached).
- Manually raise the crosshead such that the full length of the specimen fits easily between the grips. Carefully insert the specimen into the top grips to about 80 % of the grip depth; align the specimen inside the grips and tighten slightly so as to prevent the specimen from falling. Note: DO NOT tighten the grip to its full pressure at this stage.
- Slowly lower the top crosshead. Once the specimen is within about 80% of the bottom grip depth, make sure the specimen is properly aligned within the bottom grips (i.e. with the bottom grips in their fully opened position, the specimen should "float" in the middle of the bottom grip opening). Specimen misalignment, which will result in additional flexural and torsional stresses during testing, is one of the most common errors encountered when carrying out tension tests. If the alignment of the instrument itself is poor, work with a technician to properly align the grips.
- Apply appropriate lateral pressure to the specimen through the grips to ensure that no slipping occurs during testing. Note: There will be a small axial load at this point, as the tightening process introduces a preload into the specimen; your testing machines may have software adjustments to minimize this preload. Record the preload value.
- Attach the electronic extensometer securely to the specimen as per manufacturer's specification. Note: The extensometer blades do not need to be positioned exactly on the gage marks on the specimen but should be approximately centered on the specimen.
- Carefully check that you have properly executed all procedures up to this point; if possible, have a supervisor verify if the specimen is ready for testing.
- Start the loading to begin applying the tensile load to the specimen and observe the live reading of applied load on the computer display. Note: If the measured load does not increase, the specimen is slipping through the grips and needs to be reattached. If this occurs, stop the test and restart the experiment from step 2.3.
- Sometimes prior to sample failure, the test will be automatically paused without unloading the specimen (Step 2.7). At this point, remove the extensometer. If the specimens break with the extensometer in place, you will destroy the extensometer, a very expensive piece of equipment.
- Resume applying tensile load until failure. Upon reaching the maximum load, the measured loads will begin to decrease. At this point, the specimen will begin necking and final fracture should occur within this necked region through ductile or semi-ductile tearing.
- After the test is finished, raise the crosshead, loosen the top grips, and pull out the broken piece of specimen from the top grip. Once the top half of the specimen is removed, loosen the bottom grip and remove the other half of the specimen.
- Record the value at the maximum tensile load and print a copy of the stress-strain curve. Save the data recorded digitally to the hard disk and on at least one removable media device.
- Carefully fit ends of the fractured specimen together and measure the distance between the gage marks to the nearest 0.002 in. Record the final gage length.
- Measure the diameter of the specimen at the smallest cross section to the nearest 0.002 in.
- Document the fractured specimen with pictures and diagrams.
3. Data Analysis
- Using the data from Table 1, calculate the % elongation, and reduction of area for each type of metallic material.
elongation = = 8.6%
reduction of area = = 36.5%
 - Describe, categorize and record the predominant fracture mode for each specimen.
- Determine material properties as described in JoVE video on "Stress-Strain Characteristics of Steels". Organize the data in a spreadsheet such that the strain up to 0.004 is given by the strain gage and between 0.004 and 0.05 by the extensometer (the upper limit for the extensometer is the value of strain at which it was removed from the test; this value changes depending on the deformation capacity of the specimen). Use the crosshead displacement and %elongation to estimate ultimate strain. If a strain gage is not used, be sure to correct for any initial slip of the extensometer. One can count squares in the graph to obtain the toughness (area under stress-strain curve).
- Using a textbook or other suitable reference, determine the elastic modulus, yield strength, and ultimate strength of the materials used. Compare the published values to the test results.
Sonuçlar
From the measurements and Fig. 3, heat treated aluminum, such as the 6061T6 used in this test, will typically exhibit % elongations in the 8%-13% range. It is important to note that almost all the deformation is localized in a small volume and thus the %elongation is only an average; locally the strain could be much higher. Note also that the %reduction of area is also a very difficult measurement to make as the surfaces are uneven; thus this value will range considerably.
| Specimen Nominal Diameter | 0.335 | in. |
| Center Diameter | 0.340 | in. |
| Specimen Length | 10.0 | in. |
| Length of Tapered Section | 4.0 | in. |
| Original Gage Length | 1.987 | in. |
| Distance to Grips | 5.471 | in. |
| Crosshead Speed to Yield | 0.05 | in./min |
| Crosshead Speed after Yield | 0.5 | in./min |
| Preload | 200 | lbs. |
| Tensile Yield Load | 3800 | lbs. |
| Max. Tensile Load | 4100 | lbs . |
| Load at Fracture | 3000 | lbs. |
| Final Gage Length | 2.157 | in. |
| Final Diameter | 0.271 | in. |
Table 1. Results of tension tests on circular 6061 T6 aluminum specimens.
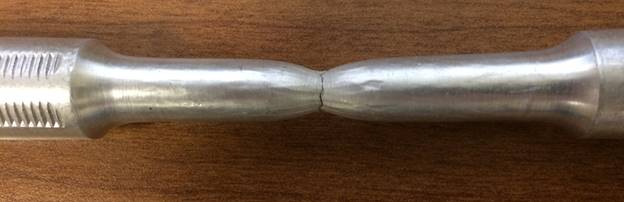
Figure 3 - Necking in aluminum specimen.

Figure 4 - Typical semi-ductile failure surface.
In general, these will vary from a ductile shear (cup-cone) fracture to a brittle cleavage fracture. The failure shown in Fig. 3 and Fig. 4 is consistent with this process, but less ductility can be seen in this aluminum as compared to the hot rolled steel in JoVE video on "Stress-Strain Characteristics of Steels". Thus this failure can be characterized as semi-ductile even if the %elongation is relatively large. Typical results are shown in Fig. 1.
Başvuru ve Özet
This experiment described how to obtain a stress-strain curve for a typical aluminum. Differences in the stress-strain curves can be traced to either difference in the processing (e.g., casting, extruding, heat treating or cold working) and chemical composition (e.g., type and percent of alloys). These processes and alloys increase the strength of aluminum by a factor of 20 to 60 times that of the pure material. The tests showed that aluminum is a ductile material when loaded in uniaxial tension.
Aluminum is a very versatile and tough material. The Aluminum Association states that "… its applications span from everyday items like fuel-efficient vehicles, smart phones, zippers and foil to wiring the nation's power grid, the apex of the Washington Monument and housing the International Space Station. …An amazing 75 percent of all aluminum ever produced is still in use. Recycled aluminum production requires only 8 percent of the energy and creates 8 percent of the emissions compared with primary production."
The most important application of the tension test described here is in the quality control process during the manufacturing of aluminum. ASTM standards require that such test be run on representative samples of each heat of aluminum, and such results must be traceable to established benchmarks. Aluminum manufacturers use standards such as ISO/TS 16949 and similar for QC/QA of materials for the automotive and related industries.
Aluminum foil in the cooking industry relies upon tensile tests to ensure that the foil is pliable enough to be easily maneuvered by hand. The same goes for soda cans- strong enough to stay in place when held, but easily crushable when desired.
Atla...
Bu koleksiyondaki videolar:

Now Playing
Stress-Strain Characteristics of Aluminum
Structural Engineering
88.7K Görüntüleme Sayısı

Material Constants
Structural Engineering
23.5K Görüntüleme Sayısı

Stress-Strain Characteristics of Steels
Structural Engineering
109.6K Görüntüleme Sayısı

Charpy Impact Test of Cold Formed and Hot Rolled Steels Under Diverse Temperature Conditions
Structural Engineering
32.2K Görüntüleme Sayısı

Rockwell Hardness Test and the Effect of Treatment on Steel
Structural Engineering
28.4K Görüntüleme Sayısı

Buckling of Steel Columns
Structural Engineering
36.1K Görüntüleme Sayısı

Dynamics of Structures
Structural Engineering
11.5K Görüntüleme Sayısı

Fatigue of Metals
Structural Engineering
40.8K Görüntüleme Sayısı

Tension Tests of Polymers
Structural Engineering
25.4K Görüntüleme Sayısı

Tension Test of Fiber-Reinforced Polymeric Materials
Structural Engineering
14.4K Görüntüleme Sayısı

Aggregates for Concrete and Asphaltic Mixes
Structural Engineering
12.2K Görüntüleme Sayısı

Tests on Fresh Concrete
Structural Engineering
25.8K Görüntüleme Sayısı

Compression Tests on Hardened Concrete
Structural Engineering
15.2K Görüntüleme Sayısı

Tests of Hardened Concrete in Tension
Structural Engineering
23.5K Görüntüleme Sayısı

Tests on Wood
Structural Engineering
32.9K Görüntüleme Sayısı
JoVE Hakkında
Telif Hakkı © 2020 MyJove Corporation. Tüm hakları saklıdır