Spectrophotometric Determination of an Equilibrium Constant
Genel Bakış
Source: Laboratory of Dr. Michael Evans — Georgia Institute of Technology
The equilibrium constant, K, for a chemical system is the ratio of product concentrations to reactant concentrations at equilibrium, each raised to the power of their respective stoichiometric coefficients. Measurement of K involves determination of these concentrations for systems in chemical equilibrium.
Reaction systems containing a single colored component can be studied spectrophotometrically. The relation between absorbance and concentration for the colored component is measured and used to determine its concentration in the reaction system of interest. Concentrations of the colorless components can be calculated indirectly using the balanced chemical equation and the measured concentration of the colored component.
In this video, the Beer's law curve for Fe(SCN)2+ is determined empirically and applied to the measurement of K for the following reaction:

Four reaction systems with different initial concentrations of reactants are investigated to illustrate that K remains constant irrespective of initial concentrations.
İlkeler
Every chemical reaction is associated with an equilibrium constant K, which reflects the ratio of product concentrations to reactant concentrations at chemical equilibrium. For the generic reaction a A + b B  c C + d D, the equilibrium constant is defined as

where the concentrations on the right-hand side of the equation are molarities at equilibrium. This equation is known as the equilibrium expression for the reaction. In chemical systems that are not in equilibrium, the forward and reverse reactions occur at different rates until the concentrations of reactants and products satisfy the equilibrium expression.
To measure the value of K for a system in chemical equilibrium, it is necessary to determine the concentrations of reactants and products either directly or indirectly. Spectrophotometric methods for the determination of K involve direct measurement of the concentration of one colored component and indirect measurement of the others. Visible spectroscopy of the colored component at known concentrations reveals the relation between absorbance and concentration for this component. According to Beer's law, this relation has the form

where e is the molar absorptivity of the component in L/mol-cm, l is the path length of light through the sample in cm, c is the molarity of the component in mol/L, and A is the absorbance.
The Beer's law curve for the colored component can be applied to a reaction system in equilibrium to determine the concentration of this component from absorbance measurements (Figure 1). Concentrations of the remaining reactants and products can then be calculated by adjusting initial concentrations based on the measured molarity of the colored species.
The system studied here is the reaction of iron (III) cation with thiocyanate anion to form an iron (III) thiocyanate complex.
The equilibrium expression for this reaction system is

where the eq subscript denotes equilibrium concentrations. The iron (III) thiocyanate product is orange, but both reactants are colorless in aqueous solution. Hence, [Fe(SCN)2+]eq can be determined directly from absorbance measurements.

Equilibrium concentrations of the reactants can be calculated by subtracting the equilibrium concentration of the product from the initial concentrations of the reactants. An Initial-Change-Equilibrium (ICE) table illustrates how initial and equilibrium concentrations are related (Table 1).
Repeated trials of this experiment involving different initial concentrations of reactants should yield the same value of K, as the value of K is independent of concentration.
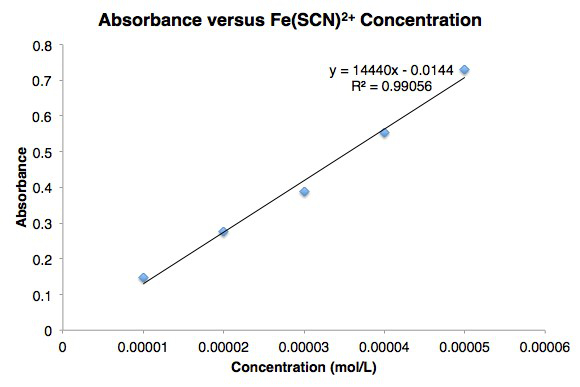
Figure 1. Beer's law curve for iron (III) thiocyanate.
| Fe3+ | SCN– | Fe(SCN)2+ | |
| Initial | [Fe3+]i | [SCN–]i | 0 |
| Change | –[Fe(SCN)2+]eq | –[Fe(SCN)2+]eq | +[Fe(SCN)2+]eq |
| Equilibrium | [Fe3+]i – [Fe(SCN)2+]eq | [SCN–]i – [Fe(SCN)2+]eq | [Fe(SCN)2+]eq |
Table 1. An Initial-Change-Equilibrium (ICE) table that illustrates how initial and equilibrium concentrations are related.
Prosedür
1. Determining the Beer's Law Curve for Fe(SCN)2+
- Calibrate a visible spectrophotometer using distilled water as a blank.
- Add 1.0 mL of 1.0 × 10⁻⁴ M Fe(NO3)3 solution to a test tube.
- To the same test tube, add 5.0 mL of 0.50 M KSCN solution.
- To the same test tube, add 4.0 mL of 0.10 M HNO3 solution. Cover the tube with a gloved finger and gently shake to mix.
- Use a Pasteur pipette to transfer a small quantity of the solution to a cuvette. Ensure that the liquid level is above the path of the light beam in the spectrophotometer.
- Place the cuvette in the spectrophotometer, so the light passes through the transparent sides.
- Acquire a spectrum and record the λmax value and the absorbance at λmax.
- In order to construct a Beer's law curve, additional solutions with known concentrations of Fe(SCN)2+ must be prepared and measured. Repeat steps 2 – 7 using the volumes of Fe(NO3)3, KSCN, and HNO3 solutions in Table 2. Make sure to use the same cuvette for all measurements, rinsing 3 times with distilled water in between each sample.
- Plot the measured absorbance versus the concentrations of Fe(SCN)2+ in each test tube and determine the line of best fit for the data. The slope of this line is the molar absorptivity and the path length is 1 cm.
2. Measuring K for the Iron (III) Thiocyanate System
- Prepare 4 medium test tubes containing the indicated volumes of 0.0025 M Fe(NO3)3, 0.0025 M KSCN, and 0.10 M HNO3 solutions in Table 3.
- Cover each tube with a finger and gently shake to mix. Allow them to stand for at least 10 min. This resting period ensures that the solutions are at chemical equilibrium.
- Use a Pasteur pipette to transfer a small quantity of solution 6 to a cuvette. Ensure that the liquid level is above the path of the light beam in the spectrophotometer.
- Acquire a spectrum and record the absorbance at λmax.
- Multiple reactions with different initial concentrations of reactants can be studied to illustrate that K does not depend on concentration. To determine K for different initial conditions, repeat steps 3 and 4 for solutions 7 – 9.
| Tube Number | Volume 1.0 x 10⁻⁴ M Fe(NO3)3 (mL) |
Volume 0.50 M KSCN (mL) |
Volume 0.10 M HNO3 (mL) |
| 1 | 1.0 | 5.0 | 4.0 |
| 2 | 2.0 | 5.0 | 3.0 |
| 3 | 3.0 | 5.0 | 2.0 |
| 4 | 4.0 | 5.0 | 1.0 |
| 5 | 5.0 | 5.0 | 0.0 |
Table 2. Appropriate volumes of Fe(NO3)3, KSCN, and HNO3 solutions to be placed in tubes 2 - 5.
| Tube Number | Volume 0.0025 M Fe(NO3)3 (mL) |
Volume 0.0025 M KSCN (mL) |
Volume 0.10 M HNO3 (mL) |
| 6 | 1.0 | 1.0 | 5.0 |
| 7 | 1.0 | 2.0 | 4.0 |
| 8 | 2.0 | 2.0 | 3.0 |
| 9 | 2.0 | 3.0 | 2.0 |
Table 3. Appropriate volumes of 0.0025 M Fe(NO3)3, 0.0025 M KSCN, and 0.10 M HNO3 solutions.
Sonuçlar
Table 4 lists the absorbance and concentration data for solutions 1 – 5. Concentrations of Fe(SCN)2+ were determined from initial concentrations of Fe3+ under the assumption that all of the Fe3+ is converted to Fe(SCN)2+. A large excess of SCN- was used in tubes 1 – 5 to ensure that this assumption holds true.
The molarity [Fe(SCN)2+] and absorbance are plotted in Figure 2. The measured absorbances agree well with Beer's law.
Table 5 lists measured absorbances and calculated K values for tubes 6 – 9. K values were determined using the ICE table method. Initial reactant concentrations were based on the known molarities of Fe3+ and SCN- in the reactant solutions and the total volume of the reaction (10 mL). The equilibrium concentration of Fe(SCN)2+ was determined by dividing measured absorbance by the molar absorptivity of Fe(SCN)2+. Because all of the product was formed from the 1:1 reaction of Fe3+ and SCN-, the equilibrium concentration of Fe(SCN)2+ corresponds to the decrease in concentration of the reactants. Table 6 shows the process for test tube 6.
The equilibrium constant is calculated from the concentrations in the equilibrium row. For test tube 6,

The mean K value was 147 ± 11, illustrating that K is roughly constant over the range of concentrations studied.

Figure 2. Line graph of Absorbance versus Concentration for Fe(SCN)2+.
| Tube | [Fe(SCN)2+] (mol/L) | Absorbance |
| 1 | 1.00 x 10⁻⁵ | 0.10 |
| 2 | 2.00 x 10⁻⁵ | 0.20 |
| 3 | 3.00 x 10⁻⁵ | 0.25 |
| 4 | 4.00 x 10⁻⁵ | 0.32 |
| 5 | 5.00 x 10⁻⁵ | 0.42 |
Table 4. Absorbance versus Concentration Data for Fe(SCN)2+.
| Tube | Absorbance | K |
| 6 | 0.120 | 136 |
| 7 | 0.268 | 161 |
| 8 | 0.461 | 142 |
| 9 | 0.695 | 150 |
Table 5. Measured absorbance values and calculated K for the reaction of iron (III) with thiocyanate.
| [Fe3+] (mol/L) | [SCN–] (mol/L) | [Fe(SCN)2+] (mol/L) | |
| Initial | 3.57 x 10⁻⁴ | 3.57 x 10⁻⁴ | 0 |
| Change | –1.58 x 10⁻⁵ | –1.58 x 10⁻⁵ | +1.58 x 10⁻⁵ |
| Equilibrium | 3.41 x 10⁻⁴ | 3.41 x 10⁻⁴ | 1.58 x 10⁻⁵ |
Table 6. The ICE table that illustrates the process used for test tube 6.
Başvuru ve Özet
The equilibrium constant provides useful information about the extent to which a reaction will proceed to form products over time. Reactions with a large value of K, much larger than 1, will form products nearly complete given enough time (Figure 3). Reactions with a value of K less than 1 will not proceed forward to a significant degree. The equilibrium constant thus serves as a measure of the feasibility of a chemical reaction.

Figure 3. The equilibrium constant of this reaction is greater than 1. A significant amount of colored product forms in each case, even though the initial concentrations of reactants differ.
The equilibrium constant also provides useful thermodynamic information about the changes in free energy, enthalpy, and entropy in the course of a chemical reaction. The equilibrium constant is related to the free energy change of reaction:

The free energy change of reaction is in turn related to the enthalpy and entropy changes of reaction:

Measurements of the temperature dependence of K can reveal the enthalpy change ΔH and the entropy change ΔS for a reaction. In addition to providing chemists with insight into patterns in molecular behavior, tables of thermodynamic data can be used to identify reactions with favorable thermodynamic properties. For example, redox reactions that release large amounts of energy (associated with negative ΔG values) are attractive candidates for batteries.
Values of K for acid dissociation reactions (Ka values) are useful for predicting the outcomes of acid-base reactions, which are thermodynamically controlled. Strong acids are associated with large Ka values and weak acids with small Ka values. pH indicators are weak acids with differently colored acidic and basic forms, and the pKa (the negative base-10 logarithm of Ka) of an indicator represents the pH at which a color change occurs as an acid or base is added to a solution of the indicator.
Similarly, Ka values are used in the preparation of buffer solutions to achieve a target pH value. The pKa of a weak acid represents the pH at which the acid and its conjugate base are present in the solution in equal concentrations. When equal amounts of a weak acid and its conjugate base are dissolved in a solution, the pH of the solution equals the pKa of the weak acid.
Atla...
Bu koleksiyondaki videolar:

Now Playing
Spectrophotometric Determination of an Equilibrium Constant
General Chemistry
158.3K Görüntüleme Sayısı

Common Lab Glassware and Uses
General Chemistry
654.8K Görüntüleme Sayısı

Solutions and Concentrations
General Chemistry
273.4K Görüntüleme Sayısı

Determining the Density of a Solid and Liquid
General Chemistry
555.2K Görüntüleme Sayısı

Determining the Mass Percent Composition in an Aqueous Solution
General Chemistry
383.2K Görüntüleme Sayısı

Determining the Empirical Formula
General Chemistry
180.4K Görüntüleme Sayısı

Determining the Solubility Rules of Ionic Compounds
General Chemistry
141.1K Görüntüleme Sayısı

Using a pH Meter
General Chemistry
344.7K Görüntüleme Sayısı

Introduction to Titration
General Chemistry
423.7K Görüntüleme Sayısı

Ideal Gas Law
General Chemistry
78.2K Görüntüleme Sayısı

Le Châtelier's Principle
General Chemistry
264.7K Görüntüleme Sayısı

Freezing-Point Depression to Determine an Unknown Compound
General Chemistry
160.6K Görüntüleme Sayısı

Determining Rate Laws and the Order of Reaction
General Chemistry
195.8K Görüntüleme Sayısı

Using Differential Scanning Calorimetry to Measure Changes in Enthalpy
General Chemistry
44.4K Görüntüleme Sayısı

Coordination Chemistry Complexes
General Chemistry
91.2K Görüntüleme Sayısı
JoVE Hakkında
Telif Hakkı © 2020 MyJove Corporation. Tüm hakları saklıdır