Method Article
Multi-system Monitoring for Identification of Seizures, Arrhythmias and Apnea in Conscious Restrained Rabbits
W tym Artykule
Podsumowanie
Using simultaneous video-EEG-ECG-oximetry-capnography, we developed a methodology to evaluate the susceptibility of rabbit models to develop provoked arrhythmias and seizures. This novel recording system establishes a platform to test the efficacy and safety of therapeutics and can capture the complex cascade of multi-system events that culminate in sudden death.
Streszczenie
Patients with ion channelopathies are at a high risk of developing seizures and fatal cardiac arrhythmias. There is a higher prevalence of heart disease and arrhythmias in people with epilepsy (i.e., epileptic heart.) Additionally, cardiac and autonomic disturbances have been reported surrounding seizures. 1:1,000 epilepsy patients/year die of sudden unexpected death in epilepsy (SUDEP). The mechanisms for SUDEP remain incompletely understood. Electroencephalograms (EEG) and electrocardiograms (ECG) are two techniques routinely used in the clinical setting to detect and study the substrates/triggers for seizures and arrhythmias. While many studies and descriptions of this methodology are in rodents, their cardiac electrical activity differs significantly from humans. This article provides a description of a non-invasive method for recording simultaneous video-EEG-ECG-oximetry-capnography in conscious rabbits. As cardiac electrical function is similar in rabbits and humans, rabbits provide an excellent model of translational diagnostic and therapeutic studies. In addition to outlining the methodology for data acquisition, we discuss the analytical approaches for examining neuro-cardiac electrical function and pathology in rabbits. This includes arrhythmia detection, spectral analysis of EEG and a seizure scale developed for restrained rabbits.
Wprowadzenie
Electrocardiography (ECG) is routinely used in the clinical setting to assess the dynamics of cardiac electrical conduction and the electrical activation-recovery process. ECG is important for detecting, localizing, and assessing the risk of arrhythmias, ischemia, and infarctions. Typically, electrodes are affixed to the patient's chest, arms, and legs in order to provide a three-dimensional view of the heart. A positive deflection is produced when the direction of myocardial depolarization is toward the electrode and a negative deflection is produced when the direction of myocardial depolarization is away from the electrode. Electrographic components of the cardiac cycle include atrial depolarization (P wave), atrial-ventricular conduction (P-R interval), ventricular excitation (QRS complex), and ventricular repolarization (T wave). There are great similarities in ECG and action potential measures across many mammals including humans, rabbits, dogs, guinea pigs, pigs, goats, and horses1,2,3.
Rabbits are an ideal model for cardiac translational research. The rabbit heart is similar to the human heart in terms of ion channel composition, and action potential properties2,4,5. Rabbits have been used for the generation of genetic, acquired, and drug-induced models of heart disease2,4,6,7,8. There are great similarities in the cardiac ECG and action potential response to drugs in humans and rabbits7,10,11.
The heart rate and cardiac electrical activation-recovery process is very different in rodents, as compared to rabbits, humans, and other larger mammals12,13,14. The rodent heart beats ~10 times as fast as humans. In contrast, to the iso-electric ST segment in human and rabbit ECGs, there is no ST segment in rodents14,15,16. Also, rodents have a QRS-r' waveform with an inverted T wave14,15,16. Measurements of the QT interval are very different in rodents vs. humans and rabbits14,15,16. Furthermore, normal ECG values are very different in humans vs. rodents12,15,16. These differences in the ECG waveforms can be attributed to differences in the action potential morphology and the ion channels that drive cardiac repolarization9,14. While the transient outward potassium current is the major repolarizing current in the short (non-dome) cardiac action potential morphology in rodents, in humans and rabbits there is a large phase-2 dome on the action potential, and the delayed rectifier potassium currents (IKr and IKs) are the major repolarizing currents in humans and rabbits4,9,13,17. Importantly, the expression of IKr and IKs is absent/minimal in rodents, and due to the temporal activation kinetics of IKr and IKs it does not have a role in the cardiac action potential morphology9,13. Thus, rabbits provide a more translational model for assessing the mechanisms for drug-induced, acquired, and inherited ECG abnormalities and arrhythmias4,7,13. Next, as numerous studies have shown the presence of both neuronal and cardiac electrical abnormalities in primary cardiac (Long QT Syndrome18,19,20) or neuronal diseases (epilepsy21,22,23,24), it is important to study the underlying mechanisms in an animal model that closely reproduces human physiology. While rodents may be sufficient to model the human brain, rodents are not an ideal model of human cardiac physiology7.
Electroencephalography (EEG) uses electrodes, usually placed on the scalp or intracranially, to record cortical electrical function. These electrodes can detect changes in the firing rate and synchronicity of groups of nearby pyramidal neurons in the cerebral cortex25. This information can be used to assess cerebral function and awake/sleep state. Also, EEGs are useful to localize epileptiform activity, and distinguish epileptic seizures from non-epileptic events (e.g., psychogenic non-epileptiform activity and cardiogenic events). In order to diagnose epilepsy type, provoking factors, and origin of the seizure, epilepsy patients are subjected to various maneuvers which may bring on a seizure. Various methods include hyperventilation, photic stimulation, and sleep deprivation. This protocol demonstrates the use of photic stimulation to induce EEG aberrations and seizures in rabbits26,27,28,29.
Simultaneous video-EEG-ECG recordings have been extensively used in humans and rodents to assess behavioral, neuronal, and cardiac activity during the pre-ictal, ictal, and post-ictal states30. While several studies have conducted EEG and ECG recordings separately in rabbits4,31,32,33, a system for acquiring and analyzing simultaneous video-EEG-ECG in the conscious restrained rabbit is not well established34. This paper describes the design and implementation of a protocol that can record simultaneous video-EEG-ECG -capnography-oximetry data in conscious rabbits in order to assess neuro-cardiac electrical and respiratory function. Results gathered from this method can indicate the susceptibility, triggers, dynamics and concordance between arrhythmias, seizures, respiratory disturbances, and physical manifestations. An advantage of our experimental system is that we acquire conscious recordings without the need of a sedative. The rabbits remain in the restrainers for ≥5 h, with minimal movement. As anesthetics perturb neuronal, cardiac, respiratory, and autonomic function, recordings during the conscious state provide the most physiological data.
This recording system may ultimately provide detailed insights to advance the understanding of the neurologic, cardiac and respiratory mechanisms for sudden unexpected death in epilepsy (SUDEP). In addition to neurologic and cardiac monitoring above, recent evidence has also supported the role of respiratory failure as a potential contribution to sudden death after a seizure35,36. To monitor the respiratory status of the rabbits, oximetry and capnography were implemented to evaluate the status of the respiratory system before, during and after a seizure. The protocol presented here was designed with the purpose of assessing the threshold for pharmacologically and photic-stimuli induced rabbit seizures. This protocol can detect subtle EEG and ECG abnormalities that may not result in physical manifestations. In addition, this method can be used for cardiac safety and anti-arrhythmic efficacy testing of novel drugs and devices.
Protokół
All experiments were carried out in accordance with the National Institutes of Health (NIH) guidelines and Upstate Medical University Institutional Animal Care and Use Committee (IACUC). In addition, an outline of this protocol is provided in Figure 1.
1. Preparing recording equipment
- Connect the computer to an amplifier with a 64-pin headbox.
NOTE: Each animal has four straight subdermal scalp pin electrodes (7 or 13 mm) for EEGs from the 4 quadrants of the head, 3 bent subdermal chest pin electrodes (13 mm, 35˚ angle) for ECG (Einthoven’s triangle), 1 bent subdermal pin ground electrode on the right leg, and 1 straight subdermal scalp pin electrode on the center of the head serves as the reference. - To make every 8th pin on the headbox a reference, update the acquisition software settings, acquisition tab, so the Reference Electrode is “Independent” (i.e., research mode).
NOTE: This enables recordings from up to 7 animals simultaneously, each with 7 electrodes plus a dedicated reference electrode and a ground electrode, all through one amplifier, digitizer, and computer. All electrodes are acquired as unipolar channels and compared to the reference (center of the head.) Additional bipolar and augmented lead configurations/montages can be setup during or after the recording. As the setup has the capability to record from multiple animals simultaneously, a ground electrode from each animal is connected in parallel to the ground input on the amplifier (Figure 2). - Remove rabbits from their cage and weigh them to calculate the appropriate drug dose for each animal. Place the rabbits in a transport carrier and bring them to a separate room in order to minimize stress to non-experimental animals. In this study, male and female New Zealand White rabbits, and their subsequent offspring were used. Experiments were performed on rabbits > 1 month of age. At the time of the experiment, these rabbits weighed between 0.47 – 5.00 kg.
NOTE: Since the rabbits need to be in the same room and in view of the camera, do not completely isolate the rabbits. There is the potential for visual and auditory manifestations from one rabbit stressing another rabbit. Therefore, it is ideal to have one rabbit in the room at a time, which is done for the photic stimulation experiments. For all other experiments, the rabbits are spaced out as much as possible, while keeping all of them within the view of the video camera. Ideally, barriers are used or only one animal is studied at a time. This was not a major confounder as the rabbits’ heart rates remained fairly stable during the experiments and there was the frequent presence of sleep spindles. Recordings from multiple animals simultaneously assures that both control and test animal data are acquired under the same environmental conditions.
2. Implanting EEG-ECG electrodes and attaching respiratory monitors
- Remove one rabbit from the transport carrier and place in the lap of a seated investigator.
- Hold the rabbit vertically and keep it close to the investigator’s body.
- Lower the rabbit into a supine position, with the rabbit’s head at the investigator’s knees, and the rabbit’s head lower than the rest of its body.
NOTE: This maneuver relaxes the animal and minimizes the likelihood of it trying to move or escape while placing the electrodes. - Now that the rabbit is secured in a supine position, ask a second investigator to spread the fur until the skin can be identified and isolated from the underlying tissue.
- Insert 35˚ bent electrodes subdermally in each axilla (Figure 3A).
NOTE: The electrodes should be pushed through so that they are securely hooked into the skin, but do not penetrate deeper structures. Having the electrode enter and then exit out of the skin (through-and-through) reduces the chance of the leads becoming dislodged when placing the rabbit in the restrainer or if it moves during the experiment (Figure 3B). All electrodes are sterilizaed with 70% ethanol prior to placement. - Place leads on the chest posterior to the right and left forelimbs and on the abdomen anterior to the left hind limb. Place a ground pin-electrode anterior to the right hind limb on the abdomen (Figure 4A).
- Once all of the ECG leads are properly placed, return the rabbit to a prone position, with the leads running up one side of the rabbit abdomen, and transfer the rabbit into an appropriately sized restrainer (e.g., 6" x 18" x 6"). When placing the rabbit in the restrainer, pull the loose wire upward to minimize the rabbit from pulling out the electrodes with its legs. Tape the wires to the side of the restrainer so that they do not get caught under the rabbit during the experiment (Figure 4B).
- Secure the rabbit in the restrainer by lowering the restraint around the neck and locking it into place. Additionally, move the hind limbs up underneath the animal and secure the rear restraint.
NOTE: One should be able to fit 1-2 fingers within the space under the neck to assure it is not too tight. Particularly during experiments where there may be motor movement, it is important to tighten down the restraint to minimize movement, potential spinal injuries, limb dislocation, and the ability to kick out the rear restraint (Figure 4B). Rabbits have been maintained in the restrainer for ~5 h without any issues related to increased movement or signs of dehydration.- For small rabbits (e.g., less than 2 months) place a rubber booster pad under the animal to raise the rabbit up, which prevents the rabbit from resting its neck on the bottom of the head restraint (Figure 4C).
NOTE: A sudden drop in respiratory and heart rate may be secondary to neck impingement. If this occurs, loosen the neck restrainer and lift the rabbit’s head to relieve any neck compression. - When the rear restraint does not closely trace the back/spine of the rabbit, place a PVC spacer to prevent any movement that could cause spinal injuries.
NOTE: For example, ~14 cm long x 4” inner diameter PVC pipe, with the lower 25-33% removed can be placed over the rabbit with foam to provide appropriate restraint (Figure 4C).
- For small rabbits (e.g., less than 2 months) place a rubber booster pad under the animal to raise the rabbit up, which prevents the rabbit from resting its neck on the bottom of the head restraint (Figure 4C).
- Now that the rabbit is securely placed into the restrainer, insert the 7-13 mm subdermal straight pin-electrodes into the scalp (Figure 3A). Using a 45˚ angle approach of entry, run the wires up between the ears, and loosely tether the wires to the restrainer behind the head to maintain lead placement. Place 5 EEG leads in the following positions: right anterior, left anterior, right occipital, left occipital and a central reference (Cz) lead at the point between the other 4 leads (Figure 4D).
NOTE: Electrodes are properly placed when they are positioned into subcutaneous tissue against the skull. This placement minimizes artifact from the nose, ears, and other surrounding muscles. Some artifact from rhythmic nose movement is unavoidable. The anterior EEG leads should be placed medial to the rabbit’s eyes and point anteriorly. The occipital leads should be placed anterior to the ears and will point in the medial direction. Cz is placed in the center of the top of the head at a point that is between all 4 electrodes (half-way between Lambda and Bregma, along the suture line). The pin of the Cz electrode points anteriorly.- Pass the EEG wires up between the ears, to avoid the rabbit trying to bite the wires.
- Attach the pulse oximeter plethysmograph to the rabbit’s ear over the marginal ear vein.
NOTE: It may be necessary to shave excess hair from the ear to improve signal or use some gauze to keep the sensor in place.- Ensure that the heart rate on the plethysmography correlates with the heart rate from the ECG and that the oxygen saturation is displayed (Figure 5C).
- Gently place the facemask with capnography tubing over the rabbit’s mouth and nose (Figure 4H). Secure the facemask with string wrapped around the mask and attach both ends of the string to the restrainer. Attach the other end of the capnography tubing to the vital signs monitor.
NOTE: It is important to prevent the string from laying over the rabbit’s eyes during the experiment. To do this, tape the string to the middle of the restrainer between the rabbit’s ears. In order to improve the capnography signal, create a one-way valve using tape and a thin piece of nitrile that will allow oxygen to enter the T-piece, and will direct exhaled CO2 into the capnography tubing (Figure 4I).
3. Recording of video-EEG-ECG
- Perform video-EEG-ECG recording using a commercially available EEG software.
NOTE: The biopotential leads and video are time locked to later correlate the electrical and video signals (e.g., EEG spike with a myoclonic jerk). - Confirm optimal connectivity, with no baseline drift, no 60 Hz electrical noise, and high signal-to-noise ratio. Specifically, ensure that each phase of the cardiac waveform can be visualized on the ECG and that the delta, theta, and alpha waves are not visually obscured by high frequency noise on the EEG.
- If all of the electrodes are producing excessive amounts of noise, then adjust the central reference lead. If only one electrode is excessively noisy, then push that electrode deeper into the skin or reposition it until there is no metal exposed.
- Adjust the video so that all rabbits can be seen simultaneously, which allows for the correlation of motor activity with EEG findings (Figure 5A).
NOTE: The system accommodates simultaneous EEG/ECG/oximetry/capnography recordings from up to 7 rabbits. - Start the baseline recording from each animal for a minimum of 10-20 min or until the heart rate stabilizes to a calm relaxed state (200-250 bpm) and the rabbits do not exhibit large movements for at least 5 min. Acquire full bandwidth electrographic data without any filters. In order to better visualize data set the low frequency filter (=high pass filter) at 1 Hz and the high frequency filter (=low pass filter) at 59 Hz.
NOTE: Another sign that the rabbit is relaxed is the onset of EEG sleep spindles (discussed later). - Add time-locked notes during the experiment in real-time to indicate the timing of interventions (e.g., drug delivery) and neuro-cardiac events (e.g., EEG spike, motor seizures, ectopic beat, and arrhythmias), and motor/investigator artifacts.
NOTE: Due to the frequency that the investigator needs to apply an intervention (e.g., photic-stimulation, drug delivery), to minimize the stress of an investigator entering and exiting the room and opening/closing the door, the investigator remains on the opposite side of the room throughout the experiment. The investigator sits as far from the animal as possible, and remains still and quiet to minimize potentially disturbing the animals.
4. Experimental protocols
NOTE: Each of the following experiments are performed on separate days if they are performed on the same animal. There is a 2-week delay between the oral tests compound drug studies, and the acute terminal pro-convulsant drug study. When necessary, the photic-stimulation experiment is performed, followed by a 30 min wait, and then the PTZ drug study.
- To enable the rabbits to acclimate in the restrainers and for the investigator to objectively confirm stabilization of cardiorespiratory rates, instrument all rabbits with the cardiorespiratory and neuronal sensors and perform continuous video monitoring for > 1 hour, 1 - 3 times per animal.
- Photic stimulation experiment
- In addition to the method described above, place a light source with a circular reflector 30 cm in front of the rabbit at eye level, with the flash intensity set to the maximum (16 candela)29. The light source is indicated by a white dot in Figure 4E.
NOTE: A dimly lit room should be used to elicit the photosensitive response37. - As the rabbit’s eyes are on the side of the head instead of the front of its head (as in humans), place 2 mirrors on either side of the rabbit, and 1 behind the rabbit so that the light enters the rabbit’s eyes.
NOTE: A flat mirror that is ≥ 20 cm tall, by ≥ 120 cm long creates a triangular enclosure around the rabbit to ensure that the flashing light enters the rabbit’s eyes, as seen in Figure 4E. - Connect the light source to a controller that has an adjustable rate, intensity, and duration.
- Record video using a camera with a red light and infrared recording capabilities.
- Expose the rabbits to each frequency for 30 s with their eyes open and then another 30 s with a surgical mask covering their face to simulate or cause eye closure at each frequency.
NOTE: Previous studies have shown that eye closure is the most provocative maneuver for eliciting photosensitivity to seizure29. In addition, 10% of photosensitive patients only exhibit electroencephalographic signs while their eyes are closed29. A seizure can be identified clinically by observing the presence of head and whole-body myoclonic jerks, clonus, or a tonic state. The EEG recording is more thoroughly analyzed for electroencephalographic correlation (e.g., spikes, poly-spikes, and rhythmic discharges) with motor manifestations for a definitive diagnosis of seizure activity. Movements in which the EEG is obscured by muscle artifact or waves of indeterminant epileptogenicity should be reviewed by an epileptologist for confirmation. - Increase the photic stimulator frequency from 1 Hz to 25 Hz in 2 Hz increments. Then perform the same photo-stimulation protocol, but this time decrease the frequency from 60 Hz to 25 Hz in 5 Hz increments.
NOTE: If a rabbit has a seizure, the experiment should be stopped. Continue to monitor the rabbit for 30 min. Then return the rabbit to the housing room and monitor every 1 h for 3 h for full recovery. However, if the photic stimulation induces a photoparoxysmal response, then the remainder of ascending frequencies are skipped and the series is started again by descending from 60 Hz until another photoparoxysmal response occurs. This will allow for the determination of the upper and lower photic stimulation thresholds. No delay is necessary as the photoparoxysmal response will cease after the photic stimulation is discontinued. If it is unclear whether a photoparoxysmal response has occurred, the frequency is repeated after a 10 s delay38. - After the experiment is completed, remove EEG and ECG leads from the rabbit and return it to its home cage for routine care by husbandry staff.
- In addition to the method described above, place a light source with a circular reflector 30 cm in front of the rabbit at eye level, with the flash intensity set to the maximum (16 candela)29. The light source is indicated by a white dot in Figure 4E.
- Oral administration of medications
- As many drugs are taken orally, prepare oral compounds by mixing with food-grade apple sauce. Mix 0.3 mg/kg of E-4031 in 3 mL of apple sauce and load into a 3 mL oral/irrigation syringe without a needle.
NOTE: Several medications can be administered in this fashion including, test compounds, drugs that are known to alter the QT duration (moxifloxacin or E-4031), and a negative control or vehicle. Some drugs are not available in an intravenous formulation. In addition, many medications are prescribed in an oral formulation and therefore an intravenous administration may have less clinical relevance. - Lift the upper lips and slide the tip of the oral syringe into the side of the rabbit’s mouth, which is unobstructed by the rabbit’s teeth, and inject all of the medication and apple sauce into the rabbit’s mouth.
- Continue the video-EEG-ECG recording for 2 h and then return the animal to its home cage for routine care.
- On the experimental day 2 and 3, connect the rabbit to the video-EEG-ECG, record 10-20 min of baseline, then inject the same medication and record for 2 h.
- After 1 week of washout, perform 10-20 min of baseline, and then give each rabbit a single dose of placebo for 3 consecutive days and record for 2 h.
NOTE: Administration of oral medications may be designed as a crossover study, in which the placebo is given during week 1 and the medication in week 2.
- As many drugs are taken orally, prepare oral compounds by mixing with food-grade apple sauce. Mix 0.3 mg/kg of E-4031 in 3 mL of apple sauce and load into a 3 mL oral/irrigation syringe without a needle.
- Intravenous medication experiment (Pentylenetetrazol, PTZ)
- In order to visualize the marginal ear vein, shave the posterior surface of the rabbit’s ear. Use a 70% ethanol wipe to disinfect the site and dilate the marginal ear vein. This is indicated by the black dashed oval in Figure 4F.
- At this point, have one experimenter cover the rabbit’s face with their hand in order to decrease the stress of the procedure to the rabbit. A second experimenter carefully cannulates the marginal ear vein with a sterile 25-G angiocatheter.
- Once the catheter is in the vein, place a sterile injection plug at the end of the catheter so that a needle can introduce medication intravenously. The location of the injection plug is indicated by a blue circle in Figure 4G.
- Make a splint by wrapping 4 x 4 inch gauze with tape so that it forms a tube shape and placing it inside the rabbit’s ear. Then tape the splint to the ear so that the catheter is secured in place and remains upright, similar to the non-catheterized ear.
- Inject 1 mL of 10 USP units per mL of heparinized saline.
NOTE: The catheter and vessel should be visibly cleared of air and remain patent. If the catheter is not in the vessel, the syringe will not push easily and there will be accumulation of saline in the subcutaneous tissue. - Give rabbits incremental doses of PTZ intravenously from 1 mg/kg to 10 mg/kg in 1 mg/kg increments every 10 min. Make a note at the start of each dose to indicate which animal is being injected and the concentration of the medication.
NOTE: This enables assessments of the acute and additive effects of PTZ administration. Alternatively, to further assess the chronic effects of low dose PTZ, the rabbit is given repeated doses at each low dose concentration, 7 doses at 2 mg/kg, 3 doses at 5 mg/kg, then 3 doses at 10 mg/kg, each dose is separated by 10 min. - After each dose, carefully monitor the video-EEG-ECG-capnography-oximetry for any neuro-cardiac electrical and respiratory abnormalities and visual evidence of epileptiform activity. Note these changes in real-time and during post-analysis.
NOTE: Seizure activity often begins within 60 s of PTZ administration.
5.Conclusion of Non-Survival Experiments.
- If the rabbit did not experience sudden death during the course of the PTZ experiment, administer 1mL of 390 mg/mL of sodium pentobarbital for every 4.54 kg of body weight (or 1.5 mL to all rabbits), followed by a 1 mL flush of normal saline. Monitor the ECG to ensure that the rabbit undergoes cardiac arrest.
- Once the rabbit experiences cardiac arrest, quickly perform a necropsy to freshly isolate various organs, including the heart, lungs, liver, brain, skeletal muscle, and any other tissue necessary for subsequent molecular/biochemical analyses.
- Dispose of the rabbit according to institutional policies.
6. Analysis of ECG
- Use commercially available ECG analysis software to visually inspect the ECG, and to identify periods of tachycardia, bradycardia, ectopic beats and other arrhythmias (Figure 6). To reduce the amount of data to review, create a tachogram, which will increase the ease with which periods of tachycardia, bradycardia, or irregularities of the RR interval can be identified.
NOTE: ECG abnormalities (e.g., QTc prolongation) and arrhythmias are manually identified by reviewing the ECG for abnormalities in the rate (e.g., brady-/tachy-arrhythmias), rhythm (e.g., premature atrial/ventricular complexes), conduction (e.g., atrio-ventricular block), and waveform (e.g., non-sinus atrial/ventricular tachycardia and fibrillation.) Arrhythmias can be detected by reviewing the tachogram for irregularities in the RR interval. Tachycardia can be identified by sections of the tachogram in which the heart rate is above 300 beats per minute. Bradycardia is identified when the heart rate is less than 120 beats per minute on the tachogram. - Using commercially available ECG analysis software, perform standard ECG measurements (heart rate, cardiac cycle intervals) at baseline and upon provocation (e.g., investigator manipulating the animal, administration of test agents, and seizure induced ECG changes).
7. Analysis of video-EEG
- Visually scroll through the video and EEG tracing using commercially available software to identify the baseline signal (Figure 7) and the presence of expected EEG discharges such as sleep spindles (Figure 8) and vertex waves (Figure 9).
NOTE: Although full bandwidth electrographic data is acquired without any filters, data should be displayed with the low frequency filter (i.e., high pass filter) set at 1 Hz, and based on Nyquist’s theorem, the high frequency filter (i.e., low pass filter) is set at 120 Hz to avoid missing any signal. The filters can be adjusted to allow for better visualization and noise reduction (e.g., 1-59 Hz) when reviewing lower frequency (<25 Hz) EEG activity. - In addition to capnography waveforms, use nose movement artifact on the EEG to determine the presence versus absence of breathing. This can also be correlated with nose movements seen on the video recording.
- Visually scroll through the video and EEG tracing using commercially available software to distinguish epileptic vs. non-epileptic (e.g., conscious) movements for at least 1 min after each dose of PTZ (Figure 10). Scan for interictal epileptic discharges and for EEG changes before, during, and after seizures. A seizure can be identified clinically by observing the presence of head and whole-body myoclonic jerks, clonus, or a tonic state with an EEG correlate. The EEG changes may include EEG spikes, poly-spikes, and rhythmic discharges.
NOTE: Movements in which the EEG is obscured by muscle artifact or waves of indeterminant epileptogenicity should be reviewed by a neurologist for confirmation. It may be advantageous to focus the video on one rabbit to view its behavior, as well as its EEG and ECG recordings, more closely (Figure 5B). - Score the video-EEG for seizures based on the type and severity of motor manifestations, which typically occur within 1 min after PTZ injection (Table 1).
- After a photic stimulation experiment, analyze the occipital leads of the EEG for the presence and absence of the occipital driving rhythm by creating a spectral analysis plot in commercially available EEG analysis software. The occipital driving rhythm will create a peak in the spectral analysis that corresponds to the frequency of the photic stimulator (Figure 11).
NOTE: Photic stimulation may produce harmonic frequency peaks in addition to the peak of the fundamental frequency.
7. Analysis of respiratory function
- Review the output from the vital signs monitor (Figure 4I) and export the signal for further analysis.
- Note the change in respiratory pattern during a seizure and after a seizure, especially the timepoint when apnea begins.
Wyniki
The method described above is capable of detecting abnormalities in the electrical conduction system of the brain and the heart as well as respiratory disturbances. A data acquisition software is used to assess the ECG morphology and detect any abnormal heart rates, conduction disturbances, or ECG rhythms (atrial/ventricular ectopic beats, and brady-/tachy-arrhythmias) (Figure 6). In addition to visualizing the ECG morphology, the traces are analyzed to quantify the RR interval, heart rate, PR interval, P duration, QRS interval, QT interval, QTc, JT interval, and Tpeak to Tend interval. Analysis of this data shows that tachy-/brady-arrhythmias are readily detected.
In addition to analyzing ECG data, EEG data is also analyzed. Baseline EEG was collected and analyzed using spectral analysis (Figure 7). This data shows that the occipital leads have a higher amplitude than the frontal leads and that the dominant frequency in all leads is in the delta range. Being able to record EEGs from rabbits with a high signal to noise ratio is important for detecting epileptiform discharges and performing further analysis on the recording. Waves that have a similar morphology and frequency to human sleep spindles are shown in Figure 8. Vertex waves originating from the center of the head are shown in Figure 9. In addition to normal EEG changes, various conscious non-epileptic rabbit movements during baseline recordings are also noted in order to distinguish them from epileptiform discharges (Figure 10). Video-EEG recordings of the movements shown, as well as others, are available in Supplemental Movie 1-11.
Several methods were implemented to attempt to induce seizures. The first method employed photic stimulation at 1-60 Hz with the eyes open and closed (Figure 4E). Because the position of the eyes on the rabbit is lateral rather than anterior like humans, mirrors are employed to direct light into the eyes of the rabbit using a single light source. Analysis of the EEG from the photic stimulation experiment at 3 Hz shows a strong occipital driving response at the expected 3 Hz frequency (Figure 11). In addition to photic stimulation, rabbits are injected with pentylenetetrazole (PTZ, GABAA blocker) via a catheter in the left marginal ear vein (Figure 4G). Injection of PTZ causes varying degrees of seizure activity within 1 min and is associated with distinct EEG waveforms. A few representative waveforms, which include theta bursts, large amplitude theta bursts, polyspike waves, low voltage polyspike waves, rhythmic gamma bursts, and electrocerebral silence (ECS) are shown in Figure 12, Figure 13, Figure 14, Figure 15, Figure 16, Figure 17.
In order to identify a seizure several criteria are used. The video is reviewed to identify any possible seizure motor manifestations. Then to confirm that the motor activity was the result of epileptic activity, the EEG signal is assessed for a temporally correlated EEG spike, polyspike, sharp wave, or rhythmic discharge. When in doubt, the video-EEG is reviewed by a second investigator and/or an epileptologist for verification. Seizure start are defined as the first instance of rhythmic EEG discharges (EEG seizure start) and motor activity (clinical seizure start). EEG and clinical seizure end when cessation of rhythmic EEG spikes and motor activity, are observed, respectively. In addition to various EEG wave morphologies, rabbits progressed through increasingly generalized and increasingly prolonged motor seizures. A seizure scale was created because neither the Racine seizure scale, nor its modified versions, were applicable to restrained rabbits (Table 1). Videos of representative motor seizure activity are shown in Supplemental Movie 17, Supplemental Movie 18, Supplemental Movie 19, Supplemental Movie 20, Supplemental Movie 21, Supplemental Movie 22.
The method presented here is also capable of determining the multi-system cascade of events that precede seizure-mediated sudden death (Figure 18). Various pathologies include: electrocerebral silence (ECS), respiratory arrest (apnea), brady-/tachy-arrhythmias, and cardiac arrest (asystole.) During the experiments, one rabbit experienced sudden death after having a pharmacologically induced seizure. In this rabbit, there was a sequence that began with respiratory arrest, then ECS, atrioventricular block, several non-sustained tachyarrhythmias, bradycardia, and ultimately asystole.
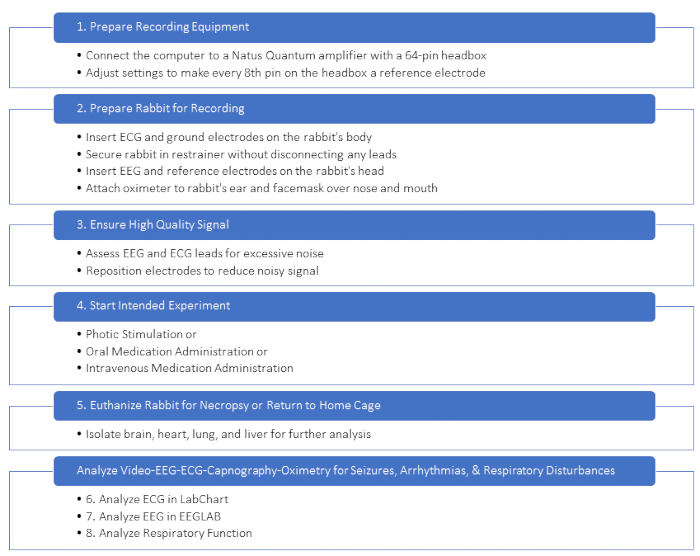
Figure 1: Overview of the experimental protocol. In order to provide an overview of the major steps in this protocol, a figure was created. This figure outlines that the recording equipment must be prepared, followed by connecting the equipment to the rabbit and ensuring that high quality signal is observed. After this step, the intended experiment can be performed, organs can be procured and the video-EEG-ECG-capnography-oximetry data analyzed.Please click here to view a larger version of this figure.
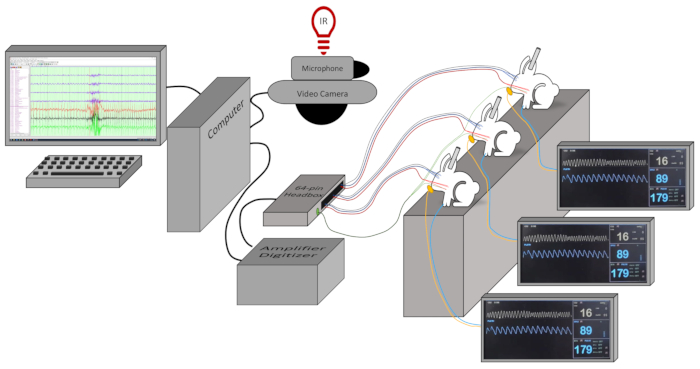
Figure 2: Experimental equipment. Diagram of experimental setup, which includes a computer, infrared light, microphone, video camera, vital signs monitor, 64-pin headbox, amplifier, digitizer, 8 electrodes (5 EEG, 3 ECG) + ground for each animal that are connected to the headbox. The leads are color coded according to the following: 4 blue EEG, 1 black EEG reference, 3 red ECG, 1 green ground. Restrainer box that holds the rabbits is not shown. This setup allows for up to 7 rabbits to be simultaneously recorded. The yellow line represents the capnography tubing and connects the facemask to the vital signs monitor. The blue line represents the oximetry wire that is connected to the vital signs monitor. Please click here to view a larger version of this figure.
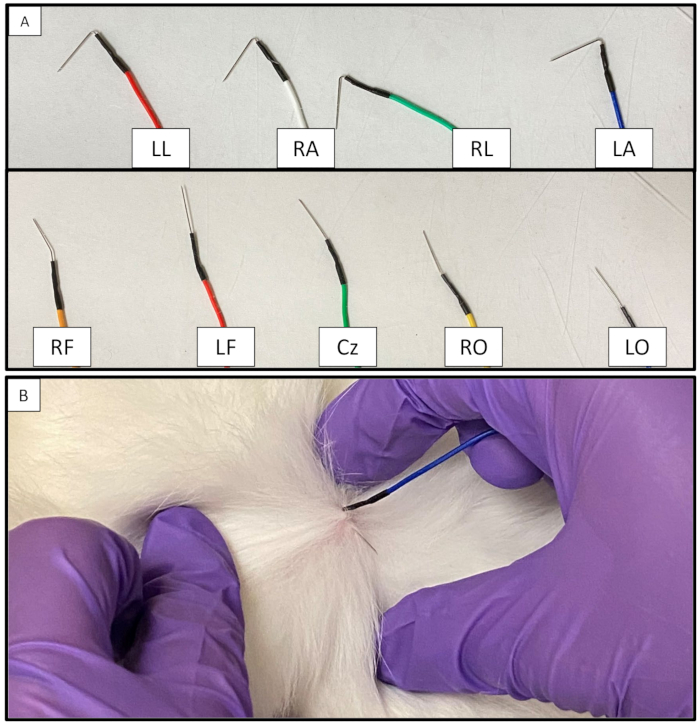
Figure 3: Picture of EEG and ECG electrodes. (A) Bent ECG electrodes and straight EEG electrodes. (B) How to hook the ECG electrode in the subcutaneous tissue of the rabbit, so that it is through and through. Abbreviations (LL: Left limb, RA: Right arm, RL: Right limb, LA: Left arm, RF: Right frontal, LF: Left frontal, Cz: Center, RO: Right occipital, LO: Left Occipital).Please click here to view a larger version of this figure.
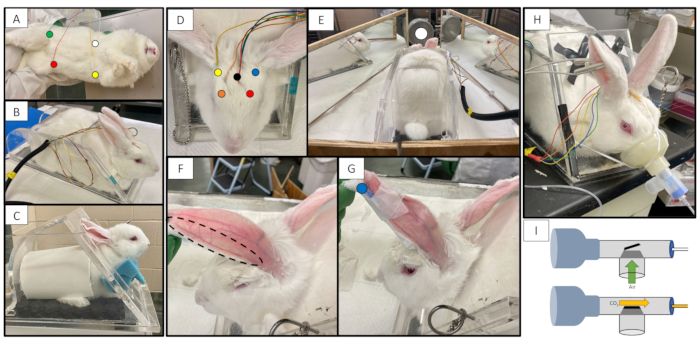
Figure 4: Rabbit connected to equipment. (A) Location of ECG electrodes, Left Arm is indicated by a yellow dot. Right Arm is indicated by a white dot. Left Leg is indicated by a red dot. Ground anterior to the right leg is indicated by a green dot. (B) Rabbit in restrainer with ECG and EEG electrodes attached. (C) Juvenile rabbit in a restrainer with appropriate modifications to accommodate a smaller rabbit, including a booster beneath the rabbit, neck foam and cut PVC pipe. (D) Rabbit in restrainer with location of EEG electrodes. Right Frontal is indicated by an orange dot. Left Frontal is indicated by a red dot. Right Occipital is indicated by a yellow dot. Left Occipital is indicated by a blue dot. The reference is indicated by a black dot. (E) Rabbit in restrainer with photic stimulator and mirror booth setup. Light source is indicated by a white dot. (F) Marginal ear vein after rabbit’s ear has been shaven and wiped with alcohol. (G) Rabbit with angiocatheter securely taped in the left marginal ear vein. Site of injection plug is indicated with a blue dot. (H) Rabbit with facemask attached to the capnography tubing by a T-piece that contains a one-way valve. (I) Diagram of the facemask and T-piece connected to the capnography tubing. During inspiration, room air is able to enter the T-piece through a one-way valve (green arrow). During expiration, CO2 leaves the T-piece by entering the capnography tubing (yellow arrow.) Because of the small amount of dead space, very little CO2 is retained in the T-piece and is generally less than 5 mmHg.Please click here to view a larger version of this figure.
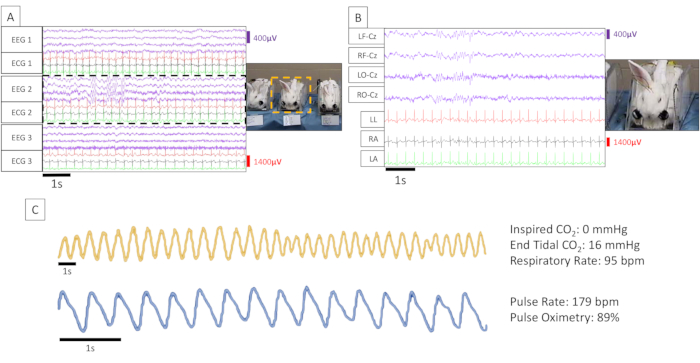
Figure 5: Simultaneous Rabbit Video-EEG-ECG-Capnography-Oximetry. (A) Simultaneous video-EEG-ECG recording of 3 rabbits. (B) Zoomed in view of simultaneous video-EEG-ECG recording from Rabbit #2. (LL: Left limb, RA: Right arm, LA: Left arm) (C) Simultaneous recording of capnography (yellow) and plethysmography (blue). Measurements showing inspired CO2, end tidal CO2, respiratory rate, pulse rate and pulse oximetry are included in the figure.Please click here to view a larger version of this figure.

Figure 6: Rabbit ECG. (A) Baseline ECG. Leads are shown in the standard bipolar frontal plane limb lead configuration and in the unipolar configuration (RA: Right arm, LL: Left limb, LA: Left arm) with the Cz lead on the head as a reference. (B) Premature ventricular complexes. (C) Sinus bradycardia. (D) Sinus tachycardia. (E) Baseline rabbit ECG tracing with P wave start, P wave peak, P wave end, QRS wave start, QRS wave peak, QRS wave end, ST segment height, T wave peak, T wave end labeled. (F) ECG measurements. All measurements are in milliseconds except for heart rate, which is in beats per minute.Please click here to view a larger version of this figure.
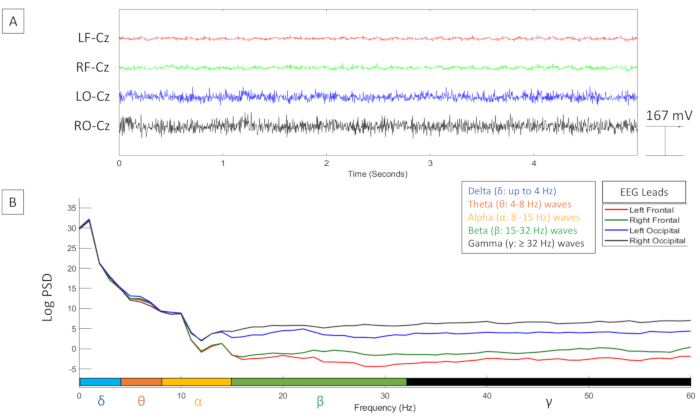
Figure 7: Baseline EEG and spectral analysis. (A) EEG tracing during baseline recording. (B) Spectral analysis of the EEG shows delta wave activity is the dominant frequency in all leads. Delta (δ: up to 4 Hz) Theta (θ: 4-8 Hz) waves Alpha (α: 8 -15 Hz) waves Beta (β: 15-32 Hz) waves Gamma (γ: ≥ 32 Hz) waves. Y Axis is Log Power Spectral Density 10*log10(μV2/Hz). Full bandwidth electrographic data was acquired without any filters, but data was displayed with low frequency filter (=high pass filter) set at 1 Hz and high frequency filter (=low pass filter) set at 120 Hz. Video-EEG-ECG recordings are shown in Supplemental Movies 1 and 2.Please click here to view a larger version of this figure.
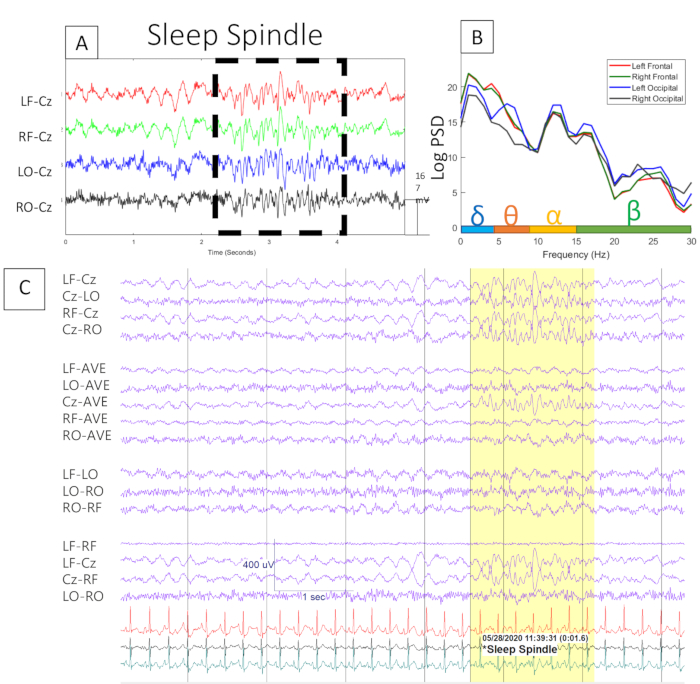
Figure 8: Sleep spindle EEG tracing and spectral analysis. (A) EEG tracing during sleep spindles. (B) Spectral analysis of the EEG shows the presence of an additional wave at 12-15 Hz, which is similar to the frequency associated with sleep spindles in humans. Delta (δ: up to 4 Hz) Theta (θ: 4-8 Hz) waves Alpha (α: 8 -15 Hz) waves Beta (β: 15-32 Hz) waves Gamma (γ: ≥ 32 Hz) waves. Y Axis is Log Power Spectral Density 10*log10(μV2/Hz). (C) Multiple EEG montages of a sleep spindle demonstrate that they arise from the center of the head (Cz), which is consistent with human findings. Full bandwidth electrographic data was acquired without any filters, but data was displayed with low frequency filter (=high pass filter) set at 1 Hz and high frequency filter (=low pass filter) set at 59 Hz.Please click here to view a larger version of this figure.
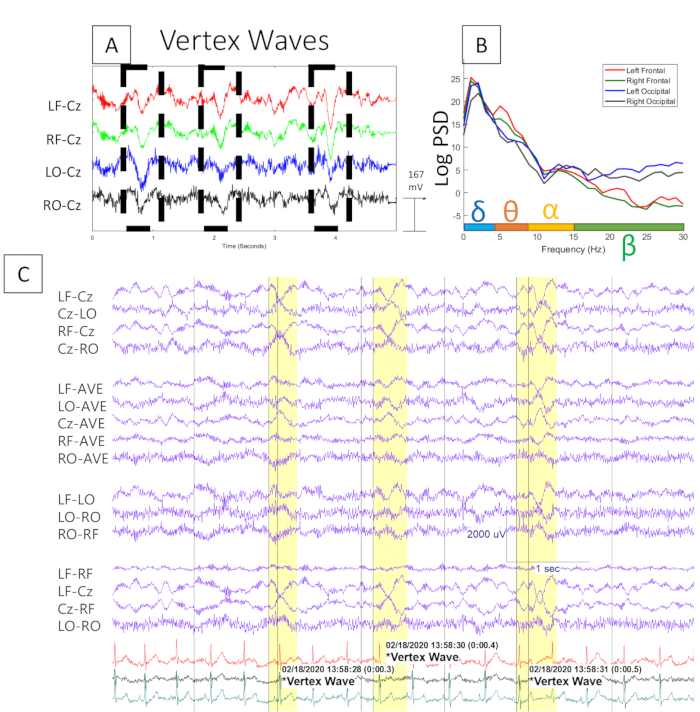
Figure 9: Vertex wave tracing and spectral analysis. (A) EEG tracing of multiple vertex waves. (B) Spectral analysis of the vertex waves does not show an appreciable difference in the frequency of the vertex waves. Although this is expected because visually the frequency is less than 1 Hz. (C) Multiple EEG montages of vertex waves show that they arise from the center of the head, which is consistent with human findings. Full bandwidth electrographic data was acquired without any filters, but data was displayed with low frequency filter (=high pass filter) set at 1 Hz and high frequency filter (=low pass filter) set at 59 Hz. Y Axis is Log Power Spectral Density 10*log10(μV2/Hz).Please click here to view a larger version of this figure.
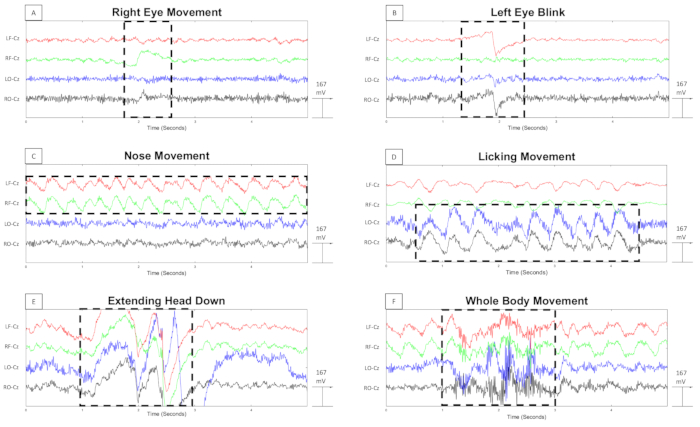
Figure 10: EEG artifacts caused by rabbit movement. (A) EEG during saccade of the right eye. (B) EEG during a left eye blink. (C) EEG during rhythmic movement of the nose which is associated with the presence of breathing. (D) EEG during licking movement. (E) EEG during an episode of the rabbit extending its head down. (F) EEG during complex conscious movements of the entire body. Video-EEG of these movements are available in Supplemental Movies 3-11. Full bandwidth electrographic data was acquired without any filters, but data was displayed with low frequency filter (=high pass filter) set at 1 Hz and high frequency filter (=low pass filter) set at 59 Hz.Please click here to view a larger version of this figure.
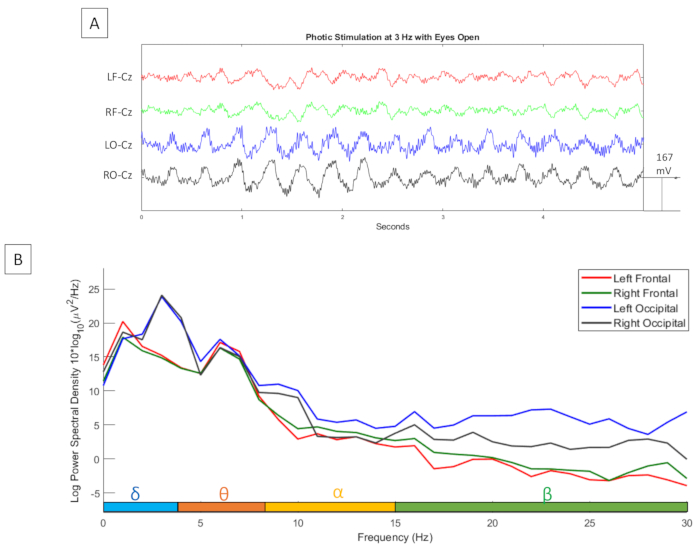
Figure 11: EEG during photic stimulation. (A) EEG tracing during 3 Hz photic stimulation with the rabbit’s eyes open. (B) Spectral analysis of 3 Hz photic stimulation with peaks at 3 Hz seen in the occipital leads, but not the frontal leads. Full bandwidth electrographic data was acquired without any filters, but data was displayed with low frequency filter (=high pass filter) set at 1 Hz and high frequency filter (=low pass filter) set at 59 Hz. Y Axis is Log Power Spectral Density 10*log10(μV2/Hz).Please click here to view a larger version of this figure.
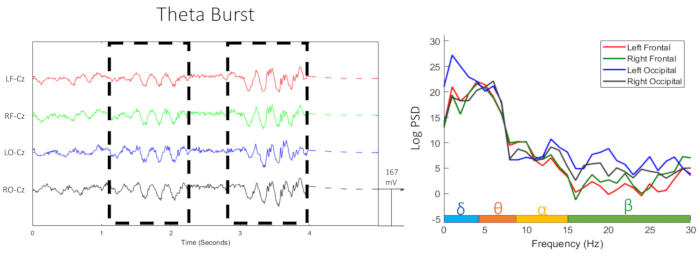
Figure 12: EEG tracing and spectral analysis of theta bursts. Theta bursts are intermittently seen in all EEG leads. The frequency of these waves is around 4-6 Hz. Delta (δ: up to 4 Hz) Theta (θ: 4-8 Hz) waves Alpha (α: 8 -15 Hz) waves Beta (β: 15-32 Hz) waves Gamma (γ: ≥ 32 Hz) waves. Y Axis is Log Power Spectral Density 10*log10(μV2/Hz). Full bandwidth electrographic data was acquired without any filters, but data was displayed with low frequency filter (=high pass filter) set at 1 Hz and high frequency filter (=low pass filter) set at 59 Hz. Y Axis is Log Power Spectral Density 10*log10(μV2/Hz).Please click here to view a larger version of this figure.
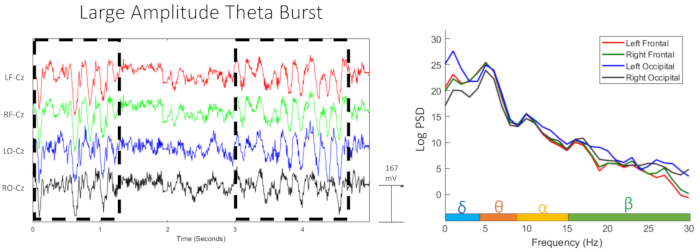
Figure 13: EEG tracing and spectral analysis of large amplitude theta bursts. Large amplitude theta bursts are similar in appearance and frequency to theta waves, but with a larger amplitude. The rapid change in amplitude makes some of these waves look sharper. Delta (δ: up to 4 Hz) Theta (θ: 4-8 Hz) waves Alpha (α: 8 -15 Hz) waves Beta (β: 15-32 Hz) waves Gamma (γ: ≥ 32 Hz) waves. Y Axis is Log Power Spectral Density 10*log10(μV2/Hz). Full bandwidth electrographic data was acquired without any filters, but data was displayed with low frequency filter (=high pass filter) set at 1 Hz and high frequency filter (=low pass filter) set at 59 Hz. Y Axis is Log Power Spectral Density 10*log10(μV2/Hz). Video-EEG-ECG recording is shown in Supplemental Movie 12.Please click here to view a larger version of this figure.

Figure 14: EEG tracing and spectral analysis of polyspike waves. Polyspike waves are intermittently and simultaneously seen in all leads. On spectral analysis, there are multiple harmonic peaks with a fundamental frequency around 6 Hz. Delta (δ: up to 4 Hz) Theta (θ: 4-8 Hz) waves Alpha (α: 8 -15 Hz) waves Beta (β: 15-32 Hz) waves Gamma (γ: ≥ 32 Hz) waves. Y Axis is Log Power Spectral Density 10*log10(μV2/Hz). Full bandwidth electrographic data was acquired without any filters, but data was displayed with low frequency filter (=high pass filter) set at 1 Hz and high frequency filter (=low pass filter) set at 59 Hz. Y Axis is Log Power Spectral Density 10*log10(μV2/Hz). Video-EEG-ECG recording is shown in Supplemental Movie 13.Please click here to view a larger version of this figure.

Figure 15: EEG tracing and spectral analysis of low voltage polyspike waves. Low voltage polyspike waves are similar to polyspike waves, but have a lower amplitude. The spectral analysis is similar to that of polyspikes. Delta (δ: up to 4 Hz) Theta (θ: 4-8 Hz) waves Alpha (α: 8 -15 Hz) waves Beta (β: 15-32 Hz) waves Gamma (γ: ≥ 32 Hz) waves. Y Axis is Log Power Spectral Density 10*log10(μV2/Hz). Full bandwidth electrographic data was acquired without any filters, but data was displayed with low frequency filter (=high pass filter) set at 1 Hz and high frequency filter (=low pass filter) set at 59 Hz. Y Axis is Log Power Spectral Density 10*log10(μV2/Hz).Please click here to view a larger version of this figure.

Figure 16: EEG tracing and spectral analysis of rhythmic gamma bursts. Rhythmic gamma bursts in a bursting pattern are seen most clearly in the anterior leads. On the frequency analysis there is an additional peak seen around 50-55 Hz in the anterior leads. Delta (δ: up to 4 Hz) Theta (θ: 4-8 Hz) waves Alpha (α: 8 -15 Hz) waves Beta (β: 15-32 Hz) waves Gamma (γ: ≥ 32 Hz) waves. Y Axis is Log Power Spectral Density 10*log10(μV2/Hz). Full bandwidth electrographic data was acquired without any filters, but was displayed with low frequency filter (=high pass filter) set at 1 Hz and high frequency filter (=low pass filter) set at 120 Hz. Video-EEG-ECG recording is shown in Supplemental Movie 14.Please click here to view a larger version of this figure.
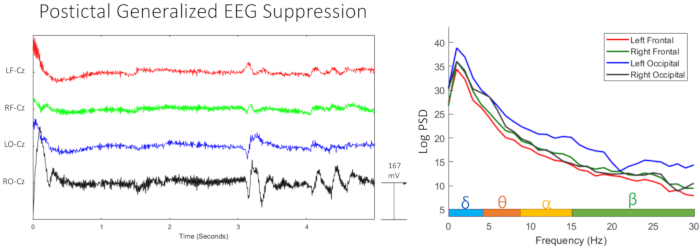
Figure 17: EEG tracing and spectral analysis of postictal generalized EEG suppression. Postictal generalized EEG suppression with the corresponding frequency histogram. Delta (δ: up to 4 Hz) Theta (θ: 4-8 Hz) waves Alpha (α: 8 -15 Hz) waves Beta (β: 15-32 Hz) waves Gamma (γ: ≥ 32 Hz) waves. Y Axis is Log Power Spectral Density 10*log10(μV2/Hz). Full bandwidth electrographic data was acquired without any filters, but data was displayed with low frequency filter (=high pass filter) set at 1 Hz and high frequency filter (=low pass filter) set at 59 Hz. Y Axis is Log Power Spectral Density 10*log10(μV2/Hz). Video-EEG-ECG recording is shown in Supplemental Movie 15.Please click here to view a larger version of this figure.
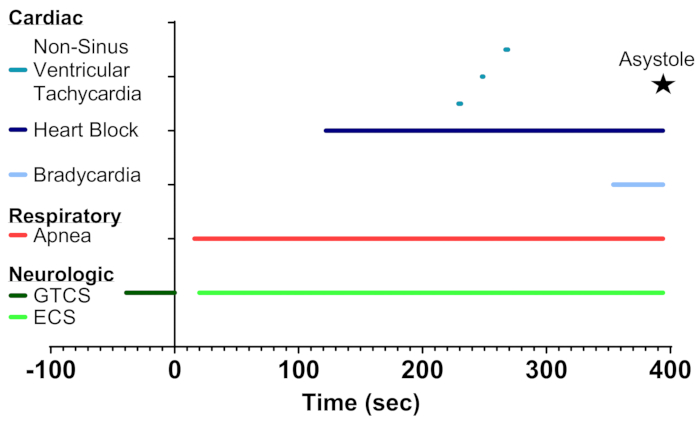
Figure 18: Sequence of sudden death after seizure. One rabbit experienced sudden death during the PTZ protocol and the sequence of death is detailed. The electroencephalographic manifestations are indicated in green. Time zero is the clinical end of the seizure. This is followed by post-ictal electrocerebral silence (ECS.) Respiratory data is shown in red and notes the onset of apnea. Electrocardiographic information is shown in shades of blue. This rabbit experienced heart block, multiple tachyarrhythmias, bradycardia, and ultimately asystole, which is indicated by the black star.Please click here to view a larger version of this figure.
Table 1: Seizure scale for restrained rabbits. Increasing seizure severity is associated with increasingly sustained and more generalized epileptic motor activity. Video examples are available in Supplemental Movies 17-22. Please click here to download this Table.
Supplemental Movie 1: Baseline rabbit video-EEG-ECG recording with lights on. After the rabbit is placed in the restrainer, the rabbit becomes more relaxed and baseline recordings can be made. The video shows that the rabbit is not moving during this recording. Please click here to download this Movie.
Supplemental Movie 2: Baseline rabbit video-EEG-ECG recording with lights off. In order for photic stimulation experiment to be performed, the lights in the room must be turned off. Turning the lights off in the room does not significantly affect the EEG or ECG recording. Importantly, the video camera has an infrared light so that the rabbit can be seen in the dark. Please click here to download this Movie.
Supplemental Movie 3: Muscle artifact from movement of the left eye. The method describe in this paper is able to discern between muscle artifact and epileptiform discharges. Although this periodic large amplitude wave could be confused with a seizure, it occurs simultaneously with movement of the left eye and is therefore more likely to be caused by muscle activity. Please click here to download this Movie.
Supplemental Movie 4: Muscle artifact from a left eye blink. The video-EEG recording is able to detect an eye blink on EEG and also determine that it occurs simultaneously with the eye blink seen on video. The eye blink is lateralized to the left sided EEG leads. Please click here to download this Movie.
Supplemental Movie 5: Muscle artifact from jaw muscle. The video-EEG is able to detect movement of small muscles of the head and neck. Video is invaluable for determining that this movement is due to muscle instead of epileptic discharges from the brain. As expected the signal associated with this movement arises from the occipital leads. Please click here to download this Movie.
Supplemental Movie 6: Muscle artifact from licking. The EEG tracing shows large rhythmic sharp waves that could be consistent with seizure activity. The video demonstrates that these waves are caused by tongue movements and are not epileptic discharges. As expected, the signal associated with this movement arises from the occipital leads. Please click here to download this Movie.
Supplemental Movie 7: Muscle artifact from mouth movement. New waves seen in the delta range are associated with movement of the mouth. Importantly, this can be distinguished from intermittent slowing secondary to encephalopathy by visualization of the mouth movement when the theta waves appear. Please click here to download this Movie.
Supplemental Movie 8: Muscle artifact from head turn. A large, slow and transient decrease in amplitude seen in the frontal leads is associated with turning of the rabbit’s head. It is important to note that there are no epileptic discharges preceding the movement. Please click here to download this Movie.
Supplemental Movie 9: Muscle artifact from head extension. A large, slow and transient increase in amplitude is seen in all leads when the rabbit is lifting its head. There are no epileptic discharges preceding the movement. Please click here to download this Movie.
Supplemental Movie 10: Muscle artifact from head flexion. A very large decrease in amplitude in all leads is seen when the rabbit extends its head downwards. There are no epileptic discharges preceding the movement. Please click here to download this Movie.
Supplemental Movie 11: Muscle artifact from complex movement. While in the restrainer, the rabbit makes a complex movement involving its head and its whole body. This occurred during the baseline recording, before any seizure-inducing medications were given. This rapidly occurring movement was recorded as a high amplitude and high frequency burst on the EEG. Additionally, the rhythmic sharp waves seen in the frontal leads are due to movement of the nose, which can be seen to be synchronous with the waves on the video. Please click here to download this Movie.
Supplemental Movie 12: Video-EEG of large amplitude theta bursts. After PTZ injection some rabbits displayed an intermittent slowing of the EEG in all leads. These abnormal waves were not usually associated with movement. Although these bursts of waves in the theta range are not typical of seizure activity, they are associated with encephalopathy in humans. Please click here to download this Movie.
Supplemental Movie 13: Video-EEG of polyspikes. Sharp waves can be seen immediately after injection, during a seizure or during the postictal period. These findings are similar to those found in humans and are associated with seizure activity. During the polyspikes, the right ear is also noticed to be twitching, a physical manifestation of the seizure. Please click here to download this Movie.
Supplemental Movie 14: Video-EEG of rhythmic gamma burst. High frequency bursts, like the ones shown in the video, often occur in the postictal period and occasionally after subthreshold doses of PTZ. The physiologic cause of these high frequency gamma bursts is unknown. Please click here to download this Movie.
Supplemental Movie 15: Video-EEG of postictal generalized EEG suppression. In the postictal period, especially after a generalized tonic-clonic seizure, there is often suppression of the EEG in all leads. Large amplitude deflections during the postictal period are shown to be caused by muscle artifact from myoclonic jerks. Please click here to download this Movie.
Supplemental Movie 16: Video-EEG of electrocerebral silence. This video demonstrates the high signal to noise ratio of this method. With minimal EEG activity, there is no appreciative signal from the EEG. This specificity is important when determining the time of brain death. In addition, it should be noted that often there is residual cardiac function after brain death has occurred. Please click here to download this Movie.
Supplemental Movie 17: Video-EEG of seizure scale stage 0. The Seizure Scale is designed to grade the severity of motor seizures by determining the spread and duration of the seizure. At stage 0, there is no visible seizure activity, although there may be epileptic discharges seen on EEG. Please click here to download this Movie.
Supplemental Movie 18: Video-EEG of seizure scale stage 1. Stage 1 of the Seizure Scale is identified by the presence of a brief partial seizure. Generally partial seizures are limited to the head, rather than any other body part. This may manifest as single head jerks, single ear twitches or other brief, non-rhythmic motor activity associated with epileptic discharges on EEG. Please click here to download this Movie.
Supplemental Movie 19: Video-EEG of seizure scale stage 2. Stage 2 of the Seizure Scale is identified by a non-sustained generalized seizure. Frequently the whole body will undergo a myoclonic jerk. This is distinguished from later stages by a lack of rhythmicity. Please click here to download this Movie.
Supplemental Movie 20: Video-EEG of seizure scale stage 3. Stage 3 of the Seizure Scale is identified by a sustained, rhythmic seizure that is limited to the head in terms of motor manifestations. The rabbit shown has rhythmic twitching of the ears, and eyelids. The rabbit experiences a brief whole body myoclonic jerk but does not progress to rhythmic whole-body jerking. Please click here to download this Movie.
Supplemental Movie 21: Video-EEG of seizure scale stage 4. Stage 4 of the Seizure Scale is identified by a sustained, rhythmic seizure that involved the entire body. As can be seen in the video, the rabbit’s body is involved in myoclonus while there is relatively little movement of the ears, eyes and head. Please click here to download this Movie.
Supplemental Movie 22: Video-EEG of seizure scale stage 5. The final stage of the Seizure Scale if identified by the presence of both the tonic and clonic phases of the seizure. Initially there is disorganized movement of the entire body. This is followed by the tonic stage, then by the clonic stage of the seizure until the seizure resolves. Occasionally rabbits experience sudden death after this stage, but rarely do they die following a seizure of a lower severity. Please click here to download this Movie.
Dyskusje
This experimental setup facilitates detailed simultaneous video-EEG-ECG-oximetry-capnography recordings and analyses in rabbits, particularly in models of cardiac and/or neuronal diseases. The results of this article show that this method is capable of detecting seizures and arrhythmias and differentiating them from electrographic artifacts. Expected results were obtained when giving rabbits a proconvulsant, which induced seizures. The data obtained from the video-EEG recordings were able to be further analyzed to differentiate voluntary movements vs. increasing severity of motor seizures and electroencephalographic abnormalities, including photic driving response, encephalopathy and epileptiform discharges. Various types of epileptiform discharges were further characterized and correlated with motor activity. Analysis of the ECG demonstrated a method that produced a high signal-to-noise ratio and allowed for identification and quantification of each electrical correlate of the cardiac cycle. This method was also able to detect the presence of cardiac abnormalities, including premature ventricular complexes, bradycardia, heart block, tachycardia, tachy-arrhythmias and asystole. The development of a robust method to further investigate neuro-cardiac interactions of multi-system diseases provides an important technological advance that is necessary in order to better understand these diseases. In addition, monitoring of respiratory function over time facilitates a better understanding of respiratory failure after seizures and its contribution to sudden death.
This set-up also provides a robust system for drug studies, such as cardiac safety testing. Research projects that employ these techniques are able to investigate the interaction between the neuronal, cardiac, and respiratory manifestations in real-time. Although many studies have been conducted on rodent hearts, results in the rabbit heart are better for translational studies, as the ion channel expression, action potential properties, and ECG measures are similar to humans. As this is a clinically used video-EEG-ECG set-up, in the future the same design can be applied to large mammals, such as pigs, dogs or sheep. Additionally, this recording setup can be used for intracranial EEG monitoring in the freely moving rabbit, which enables more extensive recordings at various physiological states, surrounding spontaneous neuro-cardiac events, and preceding sudden death. These methods will be invaluable for elucidating the mechanism of SUDEP and for finding novel therapies directed at treating diseases of the brain and heart.
The protocol presented in this article has many critical steps that must be followed to produce data with a high signal to noise ratio. Importantly before the experiment begins, the rabbit must be secured in the restrainer to limit large body movements that could result in spinal injury. All electrodes are checked for signal quality. If all electrodes are noisy, then the reference electrode can be replaced to improve the signal. If single electrodes are noisy, then that one electrode should be pushed deeper into the skin or removed and re-implanted. During the experiment, movement of the rabbits may cause electrodes to be displaced. As soon as possible, try to replace the electrodes without obstructing the view of the camera so that data can still be gathered from the experiment.
An advantage of the methodology outlined in this study is it facilitates the investigator to screen a large number of animals, and is cost effective. There are limitations of this protocol. Although, few studies have been performed to specifically investigate the physiologic impact of restraint on rabbits, we found that rabbits tolerated restraint extremely well. Many studies of the auditory system have been performed on awake rabbits in light restraints. Under these conditions, rabbits sit quietly for hours without any signs of stress or discomfort39. After being placed in the restrainer, rabbits rarely try to escape the restrainer. They exhibit a heart rate that is near baseline and often fall asleep, as noted by the presence of sleep spindles on the EEG. Rabbits do not exhibit visual, heart rate, or any other manifestations to suggest they are stressed.
A future direction is to develop a system for telemetric EEG and ECG recording. This would allow for more detailed analysis during various physiological states, the detection of spontaneous seizures, and the cascade of neuro-cardiac changes preceding sudden unexpected death in epilepsy (SUDEP.) Due to technological constraints and a relative lack of literature on EEG in rabbits, the method presented was developed first. In order to adapt this method to freely moving rabbits, it would require continuous video monitoring, intra-cranial EEG implants, and subcutaneous ECG electrodes. Yet, chronic respiratory capnography would not be feasible. Due to institutional regulations (IACUC), the methodology is for ≤5-hours recordings in the restrainer. In rodents, it is common to assess the threshold, dynamics, and types of seizures using provocative measures, such as febrile, auditory, maximal electro-shock, hyperventilation, sleep deprivation, and drug induced seizures16,40,41,42,43. This protocol would allow for testing of any of the previously mentioned provocative measures.
Ujawnienia
The authors have nothing to disclose.
Podziękowania
Authors acknowledge this study was supported by grants from the American Heart Association, American Epilepsy Society, and SUNY Upstate Department of Pharmacology.
Materiały
| Name | Company | Catalog Number | Comments |
| 0.9% Sodium Chloride Irrigation, USP - Flexible Container | PFIZER (HOSPIRA) | 7983-09 | Dilutant |
| 10cc Luer Lock syringe with 20G x 1" Needle | Sur-Vet | SS-10L2025 | Used as a flush after drug injection |
| 4x4 gauze sponges | Fisher Scientific | 22-415-469 | Rolled in a tube to splint ear with angiocatheter |
| Apple Sauce | Kirkland | 897971 | Vehicle for oral medications |
| Computer | Dell | Optiplex 5040 | Acquisition computer |
| E-4031 | Tocris | 1808 | Agent known to prolong the QT interval |
| ECG Electrode | RhythmLink | RLSND116-2.5 | 13mm 35-degree bent (0.4 mm diameter) subdermal pin electrodes |
| EEG Electrode | RhythmLink | RLSP513 | 5-twist 13mm straight (0.4mm diameter) subdermal pin electrodes |
| EEGLAB (2020) | Swartz Center for Computational Neuroscience | Open Access | Can perform spectral analysis of EEG |
| Ethernet-to-ethernet adapter | Linksys | USB3G16 | Adapter for connecting the camera to the computer |
| Euthanasia-III Solution | Med-Pharmex | ANADA 200-280 | Contains pentobarbital sodium and phenytoin sodium, controlled substance |
| Foam padding | Generic | N/A | Reduces pressure applied to the neck of small rabbits by the restrainer in order to prevent the adverse cardiorespiratory effects of neck compression |
| Heparin Lock Flush | Medline | EMZ50051240 | To maintain patency of angiocatheter |
| IR Light | Bosch | EX12LED-3BD-8W | Facilitates recordings in the dark |
| LabChart Pro (2019, Version 8.1.16) | ADInstruments | N/A | ECG Analysis |
| JELCO PROTECTIV Safety I.V. Catheters, 25 gauge | Smiths Medical | 3060 | Used to catherize marginal ear vein |
| MATLAB (R2019b, Update 5) | MathWorks | N/A | Required to run EEGLAB |
| Microphone | Sony Stereo | ECM-D570P | Recording of audible manifestions of seizures |
| Micropore Medical Tape, Paper, White | 3M | 1530-1 | Used to secure wires and create ear splint |
| Natus NeuroWorks | Natus | LC101-8 | Acquisition and review software |
| Pentylenetetrazol (1 - 10 mg/kg always in 1mL volume) | Sigma-Aldrich | 88580 | Dilutions prepared in saline |
| Photic Stimulator | Grass | PS22 | Stimulator to control frequency, delay, duration, intensity of the light pulses |
| Plastic wire organizer / bundler | 12Vwire.com | LM-12-100-BLK | Bundle wires to cut down on noise |
| PS 22 Photic Stimulator | Grass Instruments | BZA641035 | Strobe light with adjustable flash frequency, delay, and intensity |
| PVC pipe | Generic | N/A | Prevents small rabbits from kicking their hind legs and causing spinal injury |
| Quantum Amplifier | Natus | 13926 | Amplifier / digitizer |
| Quantum HeadBox Amplifier | Natus | 22134 | 64-pin breakout box |
| Rabbit Restrainer | Plas-Labs | 501-TC | Various size rabbit restrainers are available. 6" x 18" x 6" in this study. |
| Rubber pad (booster) | Generic | N/A | Raises small rabbits up in the restrainer to prevent neck compression |
| SpO2 ear clip | NONIN | 61000 | PureSAT/SpO2 |
| SpO2 sensor adapter | NONIN | 13931 | XPOD PureSAT/SpO2 |
| SRG-X120 1080p PTZ Camera with HDMI, IP & 3G-SDI Output | Sony | SRG-X120 | Impela Camera |
| Terumo Sur-Vet Tuberculin Syringe 1cc 25G X 5/8" Regular Luer | Sur-Vet | 13882 | Used to inject intravenous medications |
| Veterinary Injection Plug Luer Lock | Sur-Vet | SRIP2V | Injection plug for inserting the needle for intravenous medication |
| Webcol Alcohol Prep, Sterile, Large, 2-ply | Covidien | 5110 | To prepare ear vein before catheterization |
Odniesienia
- Kaese, S., et al. The ECG in cardiovascular-relevant animal models of electrophysiology. Herzschrittmacherther Elektrophysiology. 24 (2), 84-91 (2013).
- Pogwizd, S. M., Bers, D. M. Rabbit models of heart disease. Drug Discovery Today: Disease Models. 5 (3), 185-193 (2008).
- O'Hara, T., Rudy, Y. Quantitative comparison of cardiac ventricular myocyte electrophysiology and response to drugs in human and nonhuman species. American Journal of Physiology. Heart and Circulatory Physiology. 302 (5), 1023-1030 (2012).
- Brunner, M., et al. Mechanisms of cardiac arrhythmias and sudden death in transgenic rabbits with long QT syndrome. Journal of Clinical Investigation. 118 (6), 2246-2259 (2008).
- Lengyel, C., et al. Pharmacological block of the slow component of the outward delayed rectifier current (I(Ks)) fails to lengthen rabbit ventricular muscle QT(c) and action potential duration. British Journal of Pharmacology. 132 (1), 101-110 (2001).
- Baczko, I., Hornyik, T., Brunner, M., Koren, G., Odening, K. E. Transgenic rabbit models in proarrhythmia research. Frontiers in Pharmacology. 11, 853 (2020).
- Rudy, Y., et al. Systems approach to understanding electromechanical activity in the human heart: a national heart, lung, and blood institute workshop summary. Circulation. 118 (11), 1202-1211 (2008).
- Zhu, Y., Ai, X., Oster, R. A., Bers, D. M., Pogwizd, S. M. Sex differences in repolarization and slow delayed rectifier potassium current and their regulation by sympathetic stimulation in rabbits. Archives. 465 (6), 805-818 (2013).
- Nerbonne, J. M., Nichols, C. G., Schwarz, T. L., Escande, D. Genetic manipulation of cardiac K(+) channel function in mice: what have we learned, and where do we go from here. Circulation Research. 89 (11), 944-956 (2001).
- Eckardt, L., et al. Drug-related torsades de pointes in the isolated rabbit heart: comparison of clofilium, d,l-sotalol, and erythromycin. Journal of Cardiovascular Pharmacology. 32 (3), 425-434 (1998).
- Baczko, I., Jost, N., Virag, L., Bosze, Z., Varro, A. Rabbit models as tools for preclinical cardiac electrophysiological safety testing: Importance of repolarization reserve. Progress on Biophysics and Molecular Biology. 121 (2), 157-168 (2016).
- Richig, J. W., Sleeper, M. M. . Electrocardiography of Laboratory Animals. , (2019).
- Edwards, A. G., Louch, W. E. Species-dependent mechanisms of cardiac arrhythmia: A cellular focus. Clinical Medicine Insights. Cardiology. 11, 1179546816686061 (2017).
- Salama, G., London, B. Mouse models of long QT syndrome. Journal of Physiology. 578, 43-53 (2007).
- Zhang, Y., Wu, J., King, J. H., Huang, C. L., Fraser, J. A. Measurement and interpretation of electrocardiographic QT intervals in murine hearts. American Journal of Physiology. Heart and Circulation Physiology. 306 (11), 1553-1557 (2014).
- Auerbach, D. S., et al. Altered cardiac electrophysiology and SUDEP in a model of dravet syndrome. PLoS One. 8 (10), 15 (2013).
- Aiba, T., Tomaselli, G. F. Electrical remodeling in the failing heart. Current Opinion in Cardiology. 25 (1), 29-36 (2010).
- Auerbach, D. S., et al. Genetic biomarkers for the risk of seizures in long QT syndrome. Neurology. 87 (16), 1660-1668 (2016).
- Anderson, L. L., et al. Antiepileptic activity of preferential inhibitors of persistent sodium current. Epilepsia. 55 (8), 1274-1283 (2014).
- Johnson, J. N., et al. Identification of a possible pathogenic link between congenital long QT syndrome and epilepsy. Neurology. 72 (3), 224-231 (2009).
- Devinsky, O., Hesdorffer, D. C., Thurman, D. J., Lhatoo, S., Richerson, G. Sudden unexpected death in epilepsy: epidemiology, mechanisms, and prevention. Lancet Neurology. 15 (10), 1075-1088 (2016).
- Bagnall, R. D., et al. Exome-based analysis of cardiac arrhythmia, respiratory control, and epilepsy genes in sudden unexpected death in epilepsy. Annals in Neurology. 79 (4), 522-534 (2016).
- Frasier, C. R., et al. Channelopathy as a SUDEP biomarker in dravet syndrome patient-derived cardiac myocytes. Stem Cell Reports. 11 (3), 626-634 (2018).
- Glasscock, E. Genomic biomarkers of SUDEP in brain and heart. Epilepsy and Behavior. 38, 172-179 (2014).
- Olejniczak, P. Neurophysiologic basis of EEG. Journal of Clinical Neurophysiology. 23 (3), 186-189 (2006).
- Gastaut, H., Hunter, J. An experimental study of the mechanism of photic activation in idiopathic epilepsy. Electroencephalography and Clinical Neurophysiology. 2 (3), 263-287 (1950).
- Fisher, R. S., et al. Photic- and pattern-induced seizures: A review for the Epilepsy Foundation of America Working Group. Epilepsia. 46 (9), 1426-1441 (2005).
- Specchio, N., et al. Diagnosing photosensitive epilepsy: fancy new versus old fashioned techniques in patients with different epileptic syndromes. Brain Development. 33 (4), 294-300 (2011).
- Kasteleijn-Nolst Trenite, D., et al. Methodology of photic stimulation revisited: updated European algorithm for visual stimulation in the EEG laboratory. Epilepsia. 53 (1), 16-24 (2012).
- Mishra, V., Gautier, N. M., Glasscock, E. Simultaneous video-EEG-ECG monitoring to identify neurocardiac dysfunction in mouse models of epilepsy. Journal of Visualized Experiments. (131), e57300 (2018).
- Green, J. D., Maxwell, D. S., Schindler, W. J., Stumpf, C. Rabbit EEG "theta" rhythm: Its anatomical source and relation to activity in single neurons. Journal of Neurophysiology. 23 (4), 403-420 (1960).
- Petersen, J., Diperri, R., Himwich, W. A. The comparative development of the EEG in rabbit, cat and dog. Electroencephalography and Clinical Neurophysiology. 17, 557-563 (1964).
- Strain, G. M., Van Meter, W. G., Brockman, W. H. Elevation of seizure thresholds: a comparison of cerebellar stimulation, phenobarbital, and diphenylhydantoin. Epilepsia. 19 (5), 493-504 (1978).
- Cheng, Y., et al. Effectiveness of retigabine against levobupivacaine-induced central nervous system toxicity: A prospective, randomized animal study. Journal of Anesthesia. 30 (1), 109-115 (2016).
- Nascimento, F. A., et al. Pulmonary and cardiac pathology in sudden unexpected death in epilepsy (SUDEP). Epilepsy and Behavior. 73, 119-125 (2017).
- Buchanan, G. F. Impaired CO2-Induced Arousal in SIDS and SUDEP. Trends in Neuroscience. 42 (4), 242-250 (2019).
- Van Egmond, P., Binnie, C. D., Veldhuizen, R. The effect of background illumination on sensitivity to intermittent photic stimulation. Electroencephalography and Clinical Neurophysiology. 48 (5), 599-601 (1980).
- Harding, G. F., Fylan, F. Two visual mechanisms of photosensitivity. Epilepsia. 40 (10), 1446-1451 (1999).
- Kuwada, S., Stanford, T. R., Batra, R. Interaural phase-sensitive units in the inferior colliculus of the unanesthetized rabbit: effects of changing frequency. Journal of Neurophysiology. 57 (5), 1338-1360 (1987).
- Kalume, F., et al. Sudden unexpected death in a mouse model of Dravet syndrome. Journal of Clinical Investigation. 123 (4), 1798-1808 (2013).
- Xiang, C., et al. Threshold for maximal electroshock seizures (MEST) at three developmental stages in young mice. Zoology Research. 40 (3), 231-235 (2019).
- Ross, K. C., Coleman, J. R. Developmental and genetic audiogenic seizure models: behavior and biological substrates. Neuroscience and Biobehavior Reviews. 24 (6), 639-653 (2000).
- Faingold, C. L., Randall, M., Tupal, S. DBA/1 mice exhibit chronic susceptibility to audiogenic seizures followed by sudden death associated with respiratory arrest. Epilepsy and Behavior. 17 (4), 436-440 (2010).
Przedruki i uprawnienia
Zapytaj o uprawnienia na użycie tekstu lub obrazów z tego artykułu JoVE
Zapytaj o uprawnieniaThis article has been published
Video Coming Soon
Copyright © 2025 MyJoVE Corporation. Wszelkie prawa zastrzeżone