Research Article
Identification of Ferroptosis- and Hypoxia-related Genes in iPSC-derived Oligodendrocyte Precursor Cells from Multiple Sclerosis Patients
In This Article
Summary
This study provides novel insights into the interactions among hypoxia, ferroptosis, and immune infiltration in the pathogenesis of multiple sclerosis (MS) via bioinformatics analysis. By employing weighted gene coexpression network analysis (WGCNA) and protein-protein interaction (PPI) analysis, we identified three pivotal hub genes (ITGB1, ITGB8, and VIM).
Abstract
Multiple sclerosis (MS) is a chronic inflammatory disorder characterized by demyelination, with failed remyelination leading to progressive axon loss in chronic stages. Oligodendrocyte precursor cells (OPCs) are critical for remyelination. Recent studies suggest that both hypoxia and ferroptosis play crucial roles in the dysfunctional differentiation of OPCs. This research seeks to identify key genes linked to hypoxia and ferroptosis and immune infiltration characteristics in OPCs derived from induced pluripotent stem cells (iPSCs) of MS patients and to construct a diagnostic model centered on these pivotal genes.
We analyzed gene expression data from the GSE196575 and GSE147315 datasets and compared MS patients with healthy individuals. Using weighted gene coexpression network analysis (WGCNA), we pinpointed primary module genes and essential genes associated with hypoxia, ferroptosis, and MS. The ferroptosis Z score and the hypoxia Z score calculated via gene set variation analysis (GSVA) were greater in the iPSC-derived OPCs of MS patients than those of the control group. The implicated genes are predominantly linked to the PI3K/Akt/mTOR pathway, as identified through Gene Ontology (GO) and Kyoto Encyclopedia of Genes and Genomes (KEGG) pathway enrichment analyses.
A protein-protein interaction (PPI) network of crucial genes revealed 10 central hub genes (COL4A1, COL4A2, ITGB5, ITGB1, ITGB8, ITGAV, VIM, FLNA, VCL, and SPARC). The robust expression of ITGB1, ITGB8, and VIM was validated in the GSE151306 dataset, supporting their role as key hub genes. Additionally, an interaction network between transcription factors (TFs) and hub genes was established via Transcriptional Regulatory Relationships Unraveled by Sentence-based Text (TRRUST), which identified five key TFs. The results of this study could help elucidatenovel biomarkers or therapeutic targets for MS.
Introduction
Multiple sclerosis (MS) is a chronic inflammatory condition characterized by demyelination, that affects approximately 2.5 million individuals globally. The majority of those diagnosed with MS exhibit a relapsing-remitting (RR) disease course. During the relapsing phase, acute inflammation leads to the inevitable loss of myelin and axons. Conversely, during remission, demyelination lesions can be repaired by remyelination, providing trophic support to axons and preventing progressive axon loss1. Remyelination failure occurs in the chronic stages of MS and leads to progressive axonal degeneration2.
The process of remyelination is critically correlated with oligodendrocyte precursor cells (OPCs), involving the proliferation and migration of OPCs to differentiate into mature oligodendrocytes (OLs), which are the myelin-forming cells in the central nervous system (CNS)3. In the initial disease stages, the number of new OLs generated by OPCs around the demyelinated lesions is relatively preserved and can successfully promote remyelination4. However, during advanced MS stages, the inadequate migration and differentiation of OPCs lead to a reduction in new OLs and impaired remyelination5, thus leading to nerve degeneration and accumulation of disability.
Two hypotheses have been proposed to explain the neurodegeneration in MS. The extrinsic hypothesis suggests that the immune response initiated by activated T cells causes demyelination as well as neurodegeneration6. The intrinsic model, however, suggests that the intrinsic abnormalities in OPCs7, OLs8, and other cells in the CNS may contribute to neurodegeneration. The intrinsic model was previously considered only applicable in more advanced stages of MS, such as primary or secondary progressive MS (PPMS and SPMS). Nevertheless, neurodegeneration independent of inflammation or relapse has recently been observed in RRMS9,10, suggesting that intrinsic cellular abnormalities may be involved throughout all disease stages, including RRMS.
Furthermore, ferroptosis, a distinctive cell death pathway linked to iron-mediated lipid metabolic disturbances, plays a pivotal role in neurodegeneration. This pathway involves an imbalance of intracellular redox states driven by excess iron, leading to lipid peroxide accumulation and reactive oxygen species (ROS) production, ultimately resulting in oxidative cell death11. Neurodegenerative diseases such as Alzheimer's disease, Parkinson's disease, and Huntington's disease often originate from oxidative damage to neuronal cells, which is frequently triggered by unusually high iron concentrations within lesions. In MS, increased vulnerability to oxidative damage, combined with mitochondrial dysfunction due to the high lipid content and oxygen consumption of CNS cells, promotes lipid peroxidation, a critical factor in ferroptosis. OLs are sensitive to lipid peroxidation, an essential feature of ferroptosis12. Iron deposition near spinal inflammatory lesions13 and the vulnerability of OLs to lipid peroxidation14 and free radicals15 highlight the susceptibility of MS to ferroptosis.
Hypoxia is another critical factor in MS pathogenesis contributing to oligodendrocyte loss. Evidence of hypoxia-like damage and the generation of ROS and nitrogen oxide (NO) in acute MS lesions indicates that such stressors may precipitate mitochondrial dysfunction and subsequent energy deficits16. This metabolic stress not only affects OLs but also impairs neighboring axons through disrupted energy transfer17, as myelinic channels transmit energy between the myelin sheath and peri-axonal spaces.
Primary human OPCs and OLs of the CNS are extremely difficult to access in MS patients. Hence, induced pluripotent stem cell (iPSCs)-derived human OPCs and OLs have emerged as promising tools for studying the intrinsic disorders of MS. In light of the crucial roles of ferroptosis and hypoxia in MS pathogenesis and their impact on the oligodendrocyte lineage, this study employed weighted gene coexpression network analysis (WGCNA) to extract module information18 and to elucidate gene expression patterns associated with these phenomena in MS. By screening the correlation coefficients between genes, we are able to identify the same or similar coexpression networks or modules, shedding light on novel biomarkers or potential therapeutic targets for MS. In addition, by focusing on the transcription factors (TFs) that regulate critical genes, this study provides a foundation for further exploration of the mechanisms and potential intervention strategies for MS.
Protocol
1. Data download and preprocessing
- Download the datasets GSE196575 and GSE147315 from the Gene Expression Omnibus (GEO).
- Merge the two datasets and remove batch effects, using an online analysis platform (see Table of Materials).
- Choose the Expression module | data merge module. Upload the two expression matrix files as input files and click Run to automatically output the merged matrix.
- Create a sample annotation file as a spreadsheet.
- Choose the Expression module | Remove batch effect module. Input the annotation file and merged matrix and click on Run to create the merged matrix with batch effect removed (merged matrix 2).
- Normalize the expression data using the merge datasets, batch effect, and Normalize features available on an online analysis platform. Choose expression module and normalize module. Input merged matrix 2 created in step 1.2.3. Click the Run button. (see the Table of Materials).
- Output the expression matrix file after running the whole process described above. Extract the grouping information according to the intervention provided on the GEO website. Input the above information in a ".txt" format document to create the grouping information file for the merged dataset.
2. Differential expressed gene analysis
- Perform differential gene expression analysis using the limma package in R. Input the expression matrix file and grouping information file. Set the filtering criteria to |logFC| = 1 and p < 0.05 to identify differentially expressed genes (DEGs) related to multiple sclerosis.
3. Functional enrichment analysis (GO and KEGG)
- Conduct functional enrichment analysis for the DEGs via the GO and KEGG modules on online platforms.
- Set the model organism was set to Homo sapiens, with the Ensemble_109 version as the background gene file and genes as the data type.
- Avoid broad GO terms; refine the analysis using ToppFun. Apply filters to limit terms to 500 and 1,000 associated genes.
NOTE: The results from the 500-gene filter are presented in the main manuscript. The full GO results are available in Supplementary Figure S2. The online KEGG platform is shown in Supplementary Figure S3.
4. Gene set variation analysis for ferroptosis and hypoxia (GSVA)
- Retrieve a total of 538 ferroptosis-related genes from FerrDb and 200 hypoxia-related genes from MsigDB.
- Create GMT format files for both gene sets.
- Use the GSVA module to calculate the ferroptosis Z score and hypoxia Z score for each sample in the merged dataset, and use the expression matrix file, grouping information file, and GMT files as inputs.
- Compare the Z scores of different groups (Supplementary Figure S4).
5. Weighted Gene Co-expression Network Analysis (WGCNA)
- Extract the Z score of ferroptosis and hypoxia of each sample calculated in step 4.4. Use the above Z scores of ferroptosis and hypoxia as trait files alongside the expression matrix files to identify key gene modules related to ferroptosis and hypoxia.
- Use the WGCNA module and set R2 = 0.9 and soft threshold β = 18 to construct a weighted gene coexpression network. Focus on modules significantly associated with both ferroptosis and hypoxia (Supplementary Figure S4).
6. Identification of differentially expressed genes related to ferroptosis and hypoxia in MS patients
- Intersect the disease-related DEGs with ferroptosis and hypoxia-related gene modules via a Venn diagram tool on an online analysis platform (Supplementary Figure S3). Identify the genes associated with both ferroptosis and hypoxia in MS.
7. Protein-protein interaction (PPI) network analysis
- Input the intersected genes into the STRING database's Multiple Proteins module.
- Set the organism to Homo sapiens and click Search.
- Use the CONTINUE option in the center of the webpage to generate the PPI network.
- Export the interaction network information in TSV format and import it into bioinformatics network analysis software (Supplementary Figure S5).
- Use the Cytohubba plugin to identify the top 10 hub genes on the basis of the MCC algorithm.
8. Validation with the GSE151306 dataset
- Download the GSE151306 dataset from GEO.
- Use the limma package in R studio software (R language codes are provided in GitHub: https://github.com/Drxiazhang/Identification-of-Ferroptosis--and-Hypoxia-Related-Genes-in-iPSC-Derived-OPCs-from-MS) to validate the expression of the hub genes across different groups, and input the expression matrix file, the grouping file of the validation set, and the hub gene list.
9. ROC curve plotting for hub genes
- Use the pROC package in R to plot ROC curves for the differentially expressed hub genes.
- Validate the diagnostic value of these hub genes in the validation dataset (R language codes are provided in GitHub: https://github.com/Drxiazhang/Identification-of-Ferroptosis--and-Hypoxia-Related-Genes-in-iPSC-Derived-OPCs-from-MS).
10. Prediction of transcription factor-hub gene regulatory networks
- Access the TRRUST v2 database at https://www.grnpedia.org/trrust/.
- Use the Find key regulators for query genes module to identify transcription factors regulating the 10 hub genes.
- Set Human for the species. Input the transcription factors and hub genes into STRING's Multiple Proteins module, set Homo sapiens for organisms, and click CONTINUE to generate a regulatory network.
Results
The merged dataset consisting of four healthy individuals as controls and nine people with MS (PwMS), was analyzed and then validated in another dataset of four PwMS and four healthy controls. The analysis protocol is shown in Figure 1, and the detailed information of all the samples is listed in Supplementary Table S1. Through the analysis, 706 differentially expressed genes (DEGs, p < 0.01) were identified, 378 genes of which were upregulated and 328 genes of which were downregulated in the MS patients compared with the controls (Figure 2). Functional enrichment analysis revealed the significant involvement of these DEGs in various biological processes. Notably, the top enriched GO terms refined by 500 genes included focal adhesion, cell-substrate junction, the integrin-mediated signaling pathway, integrin binding and cadherin binding (Figure 3A-C). KEGG pathway analysis further revealed that these genes are predominantly involved in the PI3K-Akt signaling pathway and Hippo signaling pathway (Figure 3D), which are critical in cellular processes relevant to MS pathogenesis.
Ferroptosis and hypoxia Z scores, calculated through GSVA, were significantly greater in iPSC-derived oligodendrocyte precursor cells (OPCs) from MS patients than in those from healthy controls (p = 0.0028 and 0.075, respectively, Figure 4), indicating the pivotal role of these pathways in this disease. This finding was supported by the WGCNA, which identified two key gene modules (Figure 5A). Among these, the turquoise module, comprising 3,671 genes, was significantly associated with both ferroptosis and hypoxia (Figure 5B). Importantly, 71 genes were identified at the intersection of differentially expressed disease-related genes and those in the WGCNA module, suggesting a strong correlation with ferroptosis (beta=0.94, p=2e-06) and hypoxia (beta= 0.92, p=7e-06) in MS (Figure 6).
Further investigation into the PPI network revealed 10 central hub genes, namely, COL4A1, COL4A2, ITGB5, ITGB1, ITGB8, ITGAV, VIM, FLNA, VCL, and SPARC (Figure 7). These hub genes were noted for their crucial role in mediating cellular processes related to both ferroptosis and hypoxia.
We further validated the validation dataset (GSE151306). The results suggested that three hub genes (ITGAV, ITGB8, and VIM) were upregulated in PwMS (Figure 8), which was consistent with findings in the merged dataset (Supplementary Figure S1). Among them, ITGB8 was the most significantly upregulated gene. These findings suggests that ITGB8, a member of the integrin family, may be critically involved in the pathogenesis of MS, particularly in relation to ferroptosis and hypoxia mechanisms. Furthermore, receiver operating characteristic (ROC) curve analysis confirmed that ITGAV, ITGB8, and VIM have good sensitivity and specificity for disease diagnosis (AUC=58.3%, 100% and 91.7%, respectively; Figure 9A-C), with ITGB8 showing an AUC of 100%, demonstrating its potential as a robust biomarker for MS.
Finally, a transcription factor-hub gene regulatory network was established, and three key transcription factors—HOXD3, SP1, and VHL—were identified as regulators of the hub genes (Figure 10). These transcription factors may play essential roles in regulating gene expression in response to hypoxia and ferroptosis, further highlighting their potential involvement in the progression of MS.
Video 1: Coronal view obtained with a low-frequency transducer centered on the right hemidiaphragm showing qualitatively normal diaphragmatic excursion during vital capacity breathing. Please click here to download this Video.
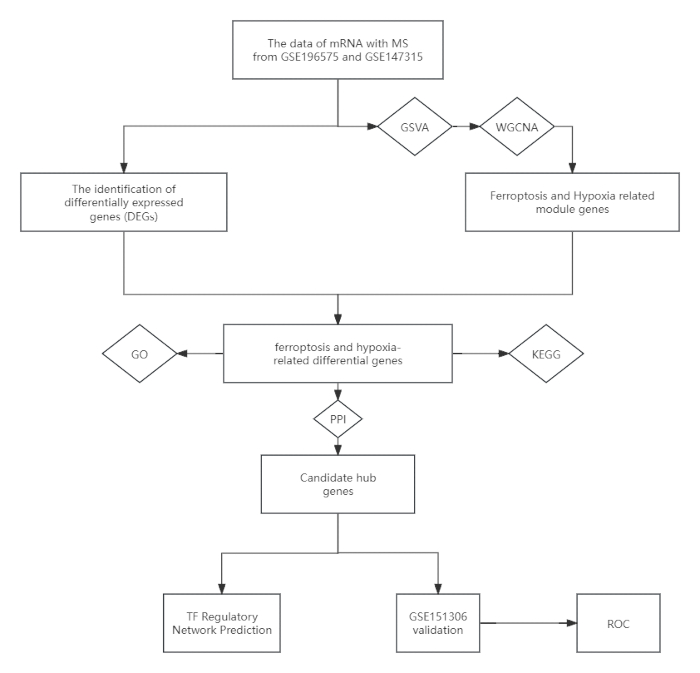
Figure 1: Flowchart showing the study design. Abbreviations: MS = multiple sclerosis; GSVA = Gene Set Variation Analysis; WGCNA = weighted gene co-expression network analysis; KEGG = Kyoto Encyclopedia of Genes and Genomes; GO = Gene Ontology; PPI = Protein-Protein Interaction; ROC = Receiver Operating Characteristic. Please click here to view a larger version of this figure.
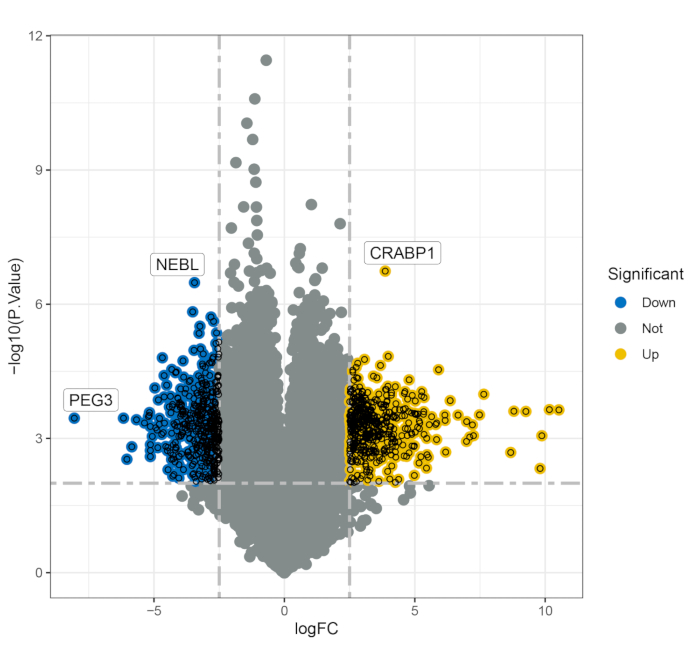
Figure 2: Volcano plot illustrating the differentially expressed genes between the healthy control group and the MS group. Abbreviations: FC = filtering criteria; PEG3 = paternally expressed gene 3; NEBL = nebulette; CRABP1 = cellular retinoic acid binding protein 1. Please click here to view a larger version of this figure.
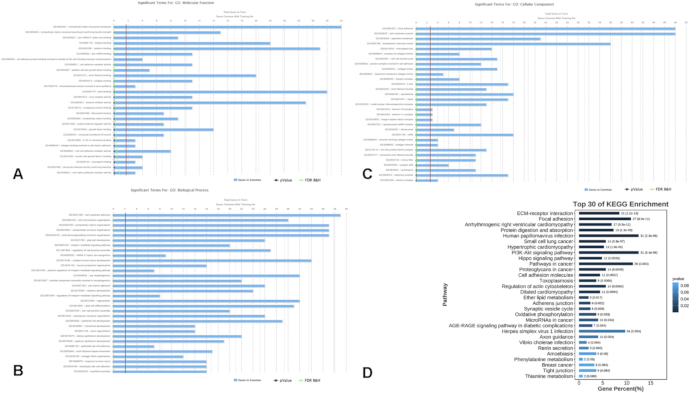
Figure 3: Functional enrichment analyses of differentially expressed genes. (A-C) Gene Ontology categories refined by filtering 500 genes, including (A) Molecular Function, (B) Biological Process, and (C) Cellular Component. (D) KEGG pathway enrichment analysis indicating pathways enriched among DEGs. Abbreviations: DEGs = differentially expressed genes; GO = Gene Ontology; MF = molecular function; BP = biological process; CC = cellular component; KEGG = Kyoto Encyclopedia of Genes and Genomes. Please click here to view a larger version of this figure.
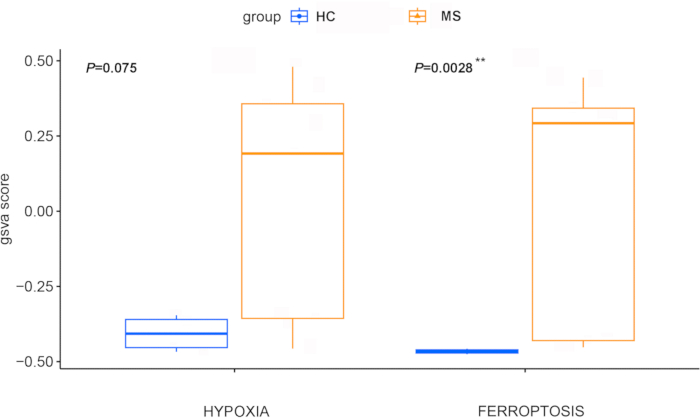
Figure 4: Boxplot comparing ferroptosis and hypoxia Z scores between the healthy control group and the MS group. Ferroptosis and hypoxia Z scores were calculated via GSVA. The control group is shown in blue, and the MS group is shown in red. Statistical comparisons were performed via the Wilcoxon test. ** indicates p values between 0 and 0.01. Abbreviations: MS = multiple sclerosis; HC = healthy control; GSVA = Gene Set Variation Analysis. Please click here to view a larger version of this figure.

Figure 5: Weighted gene coexpression network analysis results. (A) Cluster dendrogram of genes categorized into modules. (B) Correlations between modules and traits related to hypoxia and ferroptosis. Abbreviation: ADJ = adjusted. Please click here to view a larger version of this figure.

Figure 6: Venn diagram revealing 71 intersecting genes. The diagram illustrates the overlap of DEGs from multiple sclerosis patients with genes from the hypoxia and ferroptosis-related modules. Abbreviations: WGCNA = weighted gene co-expression network analysis; DEGs = differentially expressed genes. Please click here to view a larger version of this figure.
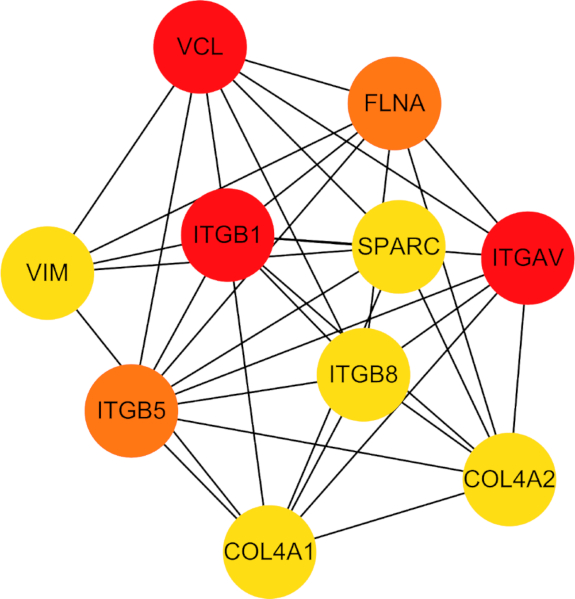
Figure 7: Network diagram of protein-protein interactions among the 10 identified hub genes. Abbreviations: VCL = vinculin; FLNA = filamin A; ITGAV = Integrin Subunit Alpha V; GOL4A2 = Collagen Type IV Alpha 2 Chain; COL4A1 = Collagen Type IV Alpha 1 Chain; ITGB5 = Integrin Subunit Beta 5; VIM = Vimentin; SPARC = Secreted Protein Acidic and Cysteine Rich; ITGB8 = Integrin Subunit Beta 8; ITGB1 = Integrin Subunit Beta 1. Please click here to view a larger version of this figure.
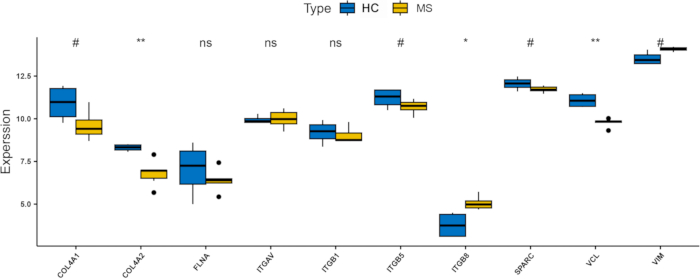
Figure 8: Bar chart showing the expression levels of hub genes in the validation dataset (GSE151306). * indicates p values between 0.01 and 0.05, and # indicates p values between 0.05 and 0.2. ns indicates p values between 0.2 and 1. Abbreviations: HC: healthy controls; MS: multiple sclerosis. Please click here to view a larger version of this figure.

Figure 9: ROC curves for evaluating the diagnostic sensitivity and specificity of differentially expressed hub genes in GSE151306. (A) ROC curve for ITGAV. (B) ROC curve for ITGB8. (C) ROC curve for VIM. Abbreviations: ROC = Receiver Operating Characteristic; ITGAV = integrin subunit alpha V; ITGB8 = integrin subunit beta 8; VIM = vimentin. Please click here to view a larger version of this figure.
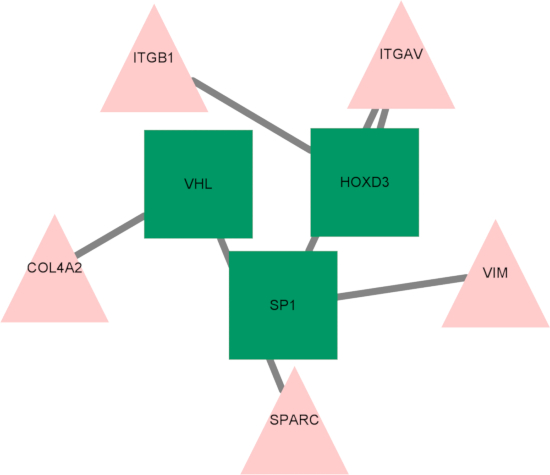
Figure 10: Diagram of the transcription factor -hub gene regulatory network. Triangles represent transcription factors; squares represent hub genes. Abbreviations: ITGB1 = integrin subunit beta 1; ITGAV = integrin subunit alpha V; VIM = Vimentin; SPARC = secreted protein acidic and cysteine-rich; COL4A2 = collagen type IV alpha 2 chain; HOXD3 = homeobox D3; VHL = von Hippel-Lindau tumor suppressor; SP1 = Specificity Protein 1. Please click here to view a larger version of this figure.

Figure 11: The impact of integrin β1 on the PI3K-Akt pathway. The form of extension with an open head (active state, high affinity) integrin β1 could form “focal adhesion” and “focal complexes” and interact with FAK and Scr kinase. The active FAK/Src complex and recruits adapter molecules to activate the PI3K-Akt pathway. This figure was adapted from Yan and Cui37. Abbreviations: PI3K = phosphatidylinositide-3-kinase; FAK = focal adhesion kinase. Please click here to view a larger version of this figure.
Supplementary Figure S1: The expression trends of the key genes in the merged dataset. Wilcox.test function from the “limma” R package was used for statistical testing. "*" indicates p-values between 0.01 and 0.05, and "#" indicates p-values between 0.05 and 0.2. Please click here to download this Figure.
Supplementary Figure S2: Original layout out of Gene Ontology analysis of differentially expressed genes. Please click here to download this Figure.
Supplementary Figure S3: Homepage of Omicshare online analysis platform. This website is a Chinese bioinformatic hub on which KEGG was performed. Please click here to download this Figure.
Supplementary Figure S4: Homepage of Biowinford online analysis platform on which WGCNA was performed. Please click here to download this Figure.
Supplementary Figure S5: Homepage of STRING database on which PPI was performed. Please click here to download this Figure.
Supplementary Table S1: Characteristics of pooled and analyzed samples and data sets. Please click here to download this Table.
Discussion
Given its pivotal role in the remyelination process, the migration, differentiation, and death of OPCs have long been determined to be crucial factors in MS pathogenesis and therapeutic targets of MS. Inflammation-independent progressive nerve degeneration has been observed in all three types of MS19, and a pronounced loss of oligodendrocyte was noted at the center of demyelinated lesions20, suggesting that primary disorders of oligodendrocyte lineage cells could accelerate the progression of MS.
In this study, we performed a bioinformatics analysis of targeted mRNA sequences focusing on genes associated with ferroptosis and hypoxia in iPSC-induced OPCs from PwMS and healthy controls via merged datasets from four healthy controls and nine PwMS. We discovered 706 DEGs, 378 of which were upregulated and 328 of which were downregulated. We further identified ferroptosis- and hypoxia-related genes and compared their expression in the iPSC-induced OPCs of MS patients and healthy controls by calculating the Z score of each sample. The Z scores of ferroptosis and hypoxia were significantly greater in PwMS than in healthy controls.
Hypoxia plays a significant role in oligodendrogliopathy in MS. Pathological studies have demonstrated distal oligodendrogliopathy in type III MS lesions resembling ischemic white matter stroke16 as well as hypoxic-like injuries alongside elevated ROS and NO levels in acute MS lesions21. Disruption of mitochondrial respiratory chain complex IV impairs the formation and viability of OPCs and mature oligodendrocytes15, although the exact mechanisms underlying this impairment remain to be elucidated.
Additionally, ferroptosis, an iron-dependent form of programmed cell death, has been found to mediate the loss of oligodendrocytes and the progression of demyelination in cuprizone-induced MS animal models22. Single-cell sequencing has revealed a decrease in antiferroptosis gene expression in OPCs and OLs in brain tissue from PwMS23. In the chronic phase of MS, iron deficiency in oligodendrocytes can disrupt remyelination and compromise axonal integrity in the white matter, resulting in disease progression24. Moreover, snRNA-seq of MS lesions in white matter suggests that ferroptosis is mostly active in white matter lesions of MS patients and is associated with activation of the phagocyte system25. In experimental autoimmune encephalomyelitis (EAE) mice, the levels of GPX4, an important regulator of ferroptosis, are reduced26. The disease progression of EAE can be accelerated by ferroptosis induced by ACSL4, which enhances T-cell receptor (TCR) signaling. Blocking ferroptosis and ACSL4 significantly slows disability progression in EAE27.
Ferroptosis is involved in the cognitive decline caused by hypoxia in rat models28. Hypoxia and hypoxia-inducible factor-1α promote the proliferation and migration of dorsal root ganglia29. Thus, ferroptosis and hypoxia may act synergistically in the pathogenesis of MS. Through WGCNA, our study identified two significant modules; the turquoise module, in particular, was strongly correlated with MS status, hypoxia, and ferroptosis. Based on the results of the WGCNA and DEGs, we identified 71 key genes that were simultaneously correlated with ferroptosis, hypoxia and MS.
GO and KEGG functional enrichment analyses of the 706 DEGs revealed that the PI3K-Akt signaling pathway is a crucial pathway in MS development. The inhibition of CXCR2 enhances OPC differentiation and promotes remyelination in MS mouse models by activating PI3K/AKT/mTOR signaling30. An imbalance in oxygen supply could affect the MAPK/PI3K-Akt signaling pathways, triggering key mechanisms involved in oxidative stress31.
PPI analysis revealed that 10 hub genes, namely, COL4A1, COL4A2, ITGB5, ITGB1, ITGB8, ITGAV, VIM, FLNA, VCL, and SPARC, were simultaneously correlated with hypoxia, ferroptosis, and MS, with notable overexpression in MS patients compared with controls. These genes were further validated in GSE151306, a database of iPSC-induced OPC lines derived from SPMS patients. We found that ITGAV, ITGB8, and VIM were also upregulated in the validation set. In Particular, ITGB8—part of the integrin family—was significantly overexpressed in MS, which was consistent with the combined test sets GSE147315 and GSE196575.
The gene ITGB8 is a member of the integrin (ITG) family and encodes integrin beta 8, which has been previously reported to be a regulator of tumor growth and metastasis32,33. Integrin beta 8 is strongly expressed by OPCs and mature oligodendrocytes. One study showed that osteopontin protects OPCs from H2O2-induced apoptosis by upregulating integrins, including ITGB834. These findings indicates that ITGB8 plays a role in cell survival under oxidative stress conditions. In multiple sclerosis, where oxidative stress is prevalent, ITGB8 may help OPCs survive and differentiate into oligodendrocytes to increase remyelination.
ITGAV encodes the integrin subunit alpha V, which regulates angiogenesis and cancer progression. ITGAV, in combination with beta 5 (forming integrin αvβ5), mediates microglial activation in response to fibronectin and vitronectin deposition, which are elevated in MS lesions. In the MS rat model of EAE, integrin avβ5 activated microglia, leading to increased expression of matrix metalloproteinase-9 (MMP-9), an enzyme that degrades the extracellular matrix and myelin proteins, contributing to demyelination35.
Notably, one of the hub genes that was differentially expressed in our merged set, ITGB1, was found to be upregulated in CD4+ T cells extracted from the cerebrospinal fluid of MS patients36. Integrin β1 had a notable effect on the PI3K-Akt signaling pathway, which is consistent with our findings (Figure 11)37. Moreover, increased expression of β1-integrin was detected on Th17 cells in MS patients compared with healthy controls. The activation of β1-integrin in Th17 cells can significantly increase glutamate levels and promote neuroinflammation38.
We conducted ROC curve analysis to assess the potential of ITGAV, ITGB8, and VIM expression in OPCs as biomarkers for MS risk prediction. The AUC of ITGB8 was 100%, followed by 91.7% for VIM and 58.3% for ITGAV. Currently, there are no studies reporting the association of the expression of ITGB8 in oligodendrocytes with MS. Further studies should be conducted to explore the use of ITGB8 as a biomarker for the prediction of MS.
Finally, we constructed a transcription factor-hub gene network and identified three key transcription factors: HOXD3, SP1, and VHL. SP1 is a transcription factor that binds to many promoters. SP1, known for its broad promoter binding, has been shown to regulate Prdx6 expression, inhibit ROS, and eliminate ferroptosis in high-glucose environments39. The expression of SP1 has also been linked to tumor necrosis factor (TNF) activity, which plays a crucial role in the development of RRMS40. The androgen receptor (AR), another identified transcription factor, is activated by steroid hormones and is detected in astrocytes within the remyelination zones, highlighting its potential involvement in oligodendrocyte function41.
Immune pathways and cells play important roles in the pathogenesis and neurodegeneration of MS and are possibly associated with ferroptosis, hypoxia, and OPCs. Observations from cuprizone-intoxicated mice as well as progressive MS lesions have shown high prevalence and proliferation rates of CD8+ T cells with cytotoxic granule overexpression42. Sufficiently activated T cells are capable of interacting with antigen-presenting oligodendrocytes, potentially leading to CD8+ T-cell-mediated oligodendrocyte destruction. In the tumor microenvironment, interferon-γ secreted by CD8+ T cells reduces the cysteine glutamate exchanger (xCT) expression, enhancing ferroptosis43. Additionally, ferroptosis has been suggested to activate T cells via T-cell receptor signaling in EAE models24.
Current research on OPCs is significantly limited due to the scarcity of these cells. This limitation can be partially addressed by using iPSC-induced OPCs. However, most studies on iPSC-induced OPCs involve small sample sizes, typically fewer than 10 donors, owing to the time-consuming and costly process of cell induction. Our study provides more robust results by integrating samples from multiple studies.
We further refined the bioinformatics pipeline by dividing the available dataset into training and validation sets. This approach minimizes potential biases induced by differences in cell induction methods and sequencing techniques across laboratories. Most existing studies on multiple sclerosis either focus on inflammation-driven neurodegeneration or employ isolated analysis of ferroptosis. Traditional gene expression analyses are useful for identifying individual differentially expressed genes but often fail to reveal the complex interaction networks and coexpression patterns associated with MS progression. In contrast, our methodology leverages WGCNA to construct a gene coexpression network, enabling the identification of gene modules highly correlated with both ferroptosis and hypoxia. This provides a system-level understanding of how these pathways interact within MS pathology, which is not achievable with standard differential expression methods alone.
This method can be applied to new treatments for MS by identifying gene targets for therapies aimed at reducing neurodegeneration. It could also be used in other neurodegenerative diseases involving ferroptosis and hypoxia, such as Parkinson's or Alzheimer's disease, to develop tailored interventions and predict therapeutic responses.
Our research has several limitations. First, further in vivo and in vitro validation is necessary. Second, our results are from two databases and were validated in one database covering a limited number of patients. Larger cohorts should be collected for further exploration. Third, considering the difficulty in accessing to human OPCs, the database we adopted was based on iPSC-induced OPCs, which may not fully resemble human tissue. More studies focused on investigating the impact of hypoxia and ferroptosis on the differentiation and cell death of oligodendrocytes lineage cells in MS should be carried out in the future.
Another limitation of this study is the inability to analyze immune cell interactions due to the use of OPCs derived from iPSCs, which lack the immune cells present in MS lesions. While immune cells are crucial in MS pathogenesis, this limitation reflects the challenges of using iPSC-derived cultures. Future studies should focus on OPC-immune cell crosstalk through coculture systems or organoids, which can better model cellular interactions in the MS environment.
Disclosures
The authors have no competing interests to declare that are relevant to the content of this article.
Acknowledgements
This study was supported and funded by National High Level Hospital Clinical Research Funding (2022-PUMCH-B-103). The authors would like to thank Dr. Shuang Song, Department of Biostatistics, Harvard T. H. Chan School of Public Health, Harvard University, for her valuable advice and guidance in the revision stage of this article.
Materials
| Name | Company | Catalog Number | Comments |
| BioInfoTools | / | online analysis website http://biowinford.site:3838/patrick_wang87/ | |
| Cytoscape | / | bioinformatics network analysis software | |
| GSE196575,GSE147315 and GSE151306 | / | RNA-seq from GEO dataset | |
| Omicshare | GENE DENOVO | online analysis tools https://www.omicshare.com/tools/Home/Soft/getsoft | |
| R-studio | RStudio, Inc | R integrated development environment software |
References
- Fünfschilling, U., et al. Glycolytic oligodendrocytes maintain myelin and long-term axonal integrity. Nature. 485 (7399), 517-521 (2012).
- Nishiyama, A., et al. Polydendrocytes (NG2 cells): multifunctional cells with lineage plasticity. Nat Rev Neurosci. 10 (1), 9-22 (2009).
- Franklin, R. J. M., Ffrench-Constant, C. Remyelination in the CNS: from biology to therapy. Nat Rev Neurosci. 9 (11), 839-855 (2008).
- Lucchinetti, C., et al. A quantitative analysis of oligodendrocytes in multiple sclerosis lesions. A study of 113 cases. Brain. 122 (Pt 12), 2279-2295 (1999).
- Patrikios, P., et al. Remyelination is extensive in a subset of multiple sclerosis patients. Brain. 129 (Pt 12), 3165-3172 (2006).
- Starost, L., et al. Extrinsic immune cell-derived, but not intrinsic oligodendroglial factors contribute to oligodendroglial differentiation block in multiple sclerosis. Acta Neuropathol. 140 (5), 715-736 (2020).
- Niu, J., et al. Aberrant oligodendroglial-vascular interactions disrupt the blood-brain barrier, triggering CNS inflammation. Nat Neurosci. 22 (5), 709-718 (2019).
- Plastini, M. J., et al. Transcriptional abnormalities in induced pluripotent stem cell-derived oligodendrocytes of individuals with primary progressive multiple sclerosis. Front Cell Neurosci. 16, 972144 (2022).
- Pisa, M., et al. Subclinical anterior optic pathway involvement in early multiple sclerosis and clinically isolated syndromes. Brain. 144 (3), 848-862 (2021).
- Vidal-Jordana, A., et al. Optical coherence tomography measures correlate with brain and spinal cord atrophy and multiple sclerosis disease-related disability. Eur J Neurol. 27 (11), 2225-2232 (2020).
- Stockwell, B. R. Ferroptosis turns 10: Emerging mechanisms, physiological functions, and therapeutic applications. Cell. 185 (14), 2401-2421 (2022).
- Thamizhoviya, G., Vanisree, A. J. Enriched environment enhances the myelin regulatory factor by mTOR signaling and protects the myelin membrane against oxidative damage in rats exposed to chronic immobilization stress. Neurochem Res. 46 (12), 3314-3324 (2021).
- Williams, R., et al. Pathogenic implications of iron accumulation in multiple sclerosis. J Neurochem. 120 (1), 7-25 (2012).
- Stojkovic, L., et al. Targeted RNAseq revealed the gene expression signature of ferroptosis-related processes associated with disease severity in patients with multiple sclerosis. Int J Mol Sci. 25 (5), 3016 (2024).
- Ziabreva, I., et al. Injury and differentiation following inhibition of mitochondrial respiratory chain complex IV in rat oligodendrocytes. Glia. 58 (15), 1827-1837 (2010).
- Aboul-Enein, F., et al. Preferential loss of myelin-associated glycoprotein reflects hypoxia-like white matter damage in stroke and inflammatory brain diseases. J Neuropathol Exp Neurol. 62 (1), 25-33 (2003).
- Halder, S. K., Milner, R. Hypoxia in multiple sclerosis; is it the chicken or the egg. Brain. 144 (2), 402-410 (2021).
- Langfelder, P., Horvath, S. WGCNA: an R package for weighted correlation network analysis. BMC Bioinformatics. 9, 559 (2008).
- Pisa, M., et al. Subclinical neurodegeneration in multiple sclerosis and neuromyelitis optica spectrum disorder revealed by optical coherence tomography. Mult Scler. 26 (10), 1197-1206 (2020).
- Lucchinetti, C., et al. Heterogeneity of multiple sclerosis lesions: implications for the pathogenesis of demyelination. Ann Neurol. 47 (6), 707-717 (2000).
- Aboul-Enein, F., Lassmann, H. Mitochondrial damage and histotoxic hypoxia: a pathway of tissue injury in inflammatory brain disease. Acta Neuropathol. 109 (1), 49-55 (2005).
- Jhelum, P., et al. Ferroptosis mediates cuprizone-induced loss of oligodendrocytes and demyelination. J Neurosci. 40 (48), 9327-9341 (2020).
- Zhang, D., et al. Evidence of pyroptosis and ferroptosis extensively involved in autoimmune diseases at the single-cell transcriptome level. J Transl Med. 20 (1), 363 (2022).
- Luoqian, J., et al. Ferroptosis promotes T-cell activation-induced neurodegeneration in multiple sclerosis. Cell Mol Immunol. 19 (8), 913-924 (2022).
- Wu, T., et al. Role of ferroptosis in neuroimmunity and neurodegeneration in multiple sclerosis revealed by multi-omics data. J Cell Mol Med. 28 (10), e18396 (2024).
- Zeng, L., et al. Advances in research on immunocyte iron metabolism, ferroptosis, and their regulatory roles in autoimmune and autoinflammatory diseases. Cell Death Dis. 15 (7), 481 (2024).
- Neel, D. V., et al. Catching a killer: Mechanisms of programmed cell death and immune activation in Amyotrophic Lateral Sclerosis. Immunol Rev. 311 (1), 130-150 (2022).
- Liu, L., et al. Ferritinophagy-mediated hippocampus ferroptosis is involved in cognitive impairment in immature rats induced by hypoxia combined with propofol. Neurochem Res. 49 (7), 1703-1719 (2024).
- An, S., et al. HIF-1α induced by hypoxia promotes peripheral nerve injury recovery through regulating ferroptosis in DRG neuron. Mol Neurobiol. 61 (9), 6300-6311 (2024).
- Wang, L., et al. CXCR2 antagonism promotes oligodendrocyte precursor cell differentiation and enhances remyelination in a mouse model of multiple sclerosis. Neurobiol Dis. 134, 104630 (2020).
- Merelli, A., et al. Understanding the role of hypoxia inducible factor during neurodegeneration for new therapeutics opportunities. Curr Neuropharmacol. 16 (10), 1484-1498 (2018).
- Huang, L., et al. miR19b-3p promotes the growth and metastasis of colorectal cancer via directly targeting ITGB8. Am J Cancer Res. 7 (10), 1996-2008 (2017).
- Li, J., et al. Exosomal circDNER enhances paclitaxel resistance and tumorigenicity of lung cancer via targeting miR-139-5p/ITGB8. Thorac Cancer. 13 (9), 1381-1390 (2022).
- Mazaheri, N., et al. Ameliorating effect of osteopontin on H2O2-induced apoptosis of human oligodendrocyte progenitor cells. Cell Mol Neurobiol. 38 (4), 891-899 (2018).
- Milner, R., et al. Fibronectin- and vitronectin-induced microglial activation and matrix metalloproteinase-9 expression is mediated by integrins alpha5beta1 and alphavbeta5. J Immunol. 178 (12), 8158-8167 (2007).
- Hrastelj, J., et al. CSF-resident CD4+ T-cells display a distinct gene expression profile with relevance to immune surveillance and multiple sclerosis. Brain Commun. 3 (3), fcab155 (2021).
- Yan, L., Cui, Z. Integrin β1 and the repair after nervous system injury. Eur Neurol. 86 (1), 2-12 (2023).
- Birkner, K., et al. β1-Integrin- and KV1.3 channel-dependent signaling stimulates glutamate release from Th17 cells. J Clin Invest. 130 (2), 715-732 (2020).
- Zhang, Q., et al. Sp1-mediated upregulation of Prdx6 expression prevents podocyte injury in diabetic nephropathy via mitigation of oxidative stress and ferroptosis. Life Sci. 278, 119529 (2021).
- Hadi, N., et al. Study of the correlation between miR-106a, miR-125b, and miR-330 on multiple sclerosis patients by targeting TNFSF4 and SP1 in NF-кb/TNF-α pathway: A case-control study. Cell J. 24 (7), 403-409 (2022).
- Asbelaoui, N., et al. Interplay between androgen and CXCR4 chemokine signaling in myelin repair. Acta Neuropathol Commun. 12 (1), 18 (2024).
- Kaddatz, H., et al. Cuprizone-induced demyelination triggers a CD8-pronounced T cell recruitment. Glia. 69 (4), 925-942 (2021).
- Wang, W., et al. CD8+ T cells regulate tumour ferroptosis during cancer immunotherapy. Nature. 569 (7755), 270-274 (2019).
Reprints and Permissions
Request permission to reuse the text or figures of this JoVE article
Request PermissionExplore More Articles
This article has been published
Video Coming Soon
Copyright © 2025 MyJoVE Corporation. All rights reserved