Interferenz und Beugung
Überblick
Quelle: Yong P. Chen, PhD, Department of Physics & Astronomie, College of Science, Purdue University, West Lafayette, IN
Interferenz und Beugung sind charakteristischen Erscheinungen der Wellen, elektromagnetische Wellen wie Licht von Wasserwellen bis. Störungen bezieht sich auf das Phänomen der wenn zwei Wellen gleicher Art überlappen, um eine wechselnde räumliche Variation von großen und kleinen Wellenamplitude zu geben. Beugung bezeichnet das Phänomen als eine Welle durchläuft eine Blende oder um ein Objekt herum geht, verschiedene Teile der Welle können stören und auch Anlass zu einem räumlichen Wechsel von großen und kleinen Amplitude.
Dieses Experiment wird die Wellennatur des Lichts zeigen, durch Beugung und Interferenz von Laser-Licht, die durch einen Einzelspalt und Doppelspalte, bzw. zu beobachten. Die Schlitze werden einfach mit Rasierklingen in einer Alu-Folie geschnitten und die charakteristischen Beugung und Interferenz Muster als Muster abwechselnd helle und dunkle Streifen auf einem Bildschirm nach der Folie platziert werden, wenn das Licht durch die Slit(s) auf der Folie leuchtete ist manifestieren. In der Vergangenheit spielten die Beobachtung der Beugung und Interferenz von Licht eine wichtige Rolle bei der Festlegung, dass Licht eine elektromagnetische Welle ist.
Grundsätze
A wave is an oscillation in the amplitude of some physical quantity in space and/or time. Waves or different parts of waves can overlap and “interfere” to produce an alternating strong and weak amplitude. Interference is one of the most characteristic phenomena associated with waves. Consider a simple example of two waves propagating along a one-dimension line (x-axis) and mathematically represented by:
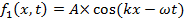
and,
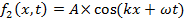
propagating to the right (+x direction) and left (−x direction), respectively. Here, A is the peak amplitude, and k is the “wave number” or “wave vector” defined as,

where λ is the wavelength (spatial periodicity of the wave). ω is defined as,

where f is the frequency and,

where T is the period (in time) of the wave. When the two waves overlap, their amplitudes add up (which is known as the “superposition principle of the wave”) to give:

which is also known as a “standing wave”. At those locations where,

(where n is an integer) and,

the oscillations (as functions of time t) will have maximal amplitude (between −2A and +2A). In contrast, at locations where,

and,

the oscillations will have zero (thus minimal) amplitude (also known as “nodes”). Such a spatial alternation of strong and weak wave amplitude represents an “interference pattern”. This phenomenon can be generalized to waves in two- and three-dimensional space. It also underlies the phenomena of single-slit diffraction and double-slit interference of light (which is an electromagnetic wave) to be observed in this experiment.
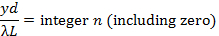
If the light of wavelength (λ) is shone on a narrow slit of width (a) (shown schematically in Figure 1a), the light intensity (which is proportional to the square of the peak amplitude of wave) far away from the slit will alternate between large and small (nearly zero) values, corresponding to “bright” and “dark” regions, along the width direction (“y-axis” in Figure 1a) of the slit. This alternation, known as the “diffraction pattern” of the light (through a small aperture), is also a characteristic phenomenon for waves. Fundamentally, it arises from the interference between different parts of the light wave after the aperture (in particular, points between the two edges of the aperture will “re-emit” the light wave towards different directions). The angular variation of the light intensity is denoted as I(θ), where θ represents the angle of the direction (towards +y or –y) away from the “straight through” direction, through y = 0 in Figure 1a). For small θ, it can be shown that I(θ) is approximately proportional to |sin(πaθ/λ)/(πaθ/λ)|2. That is, “dark” for,
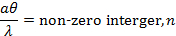
and “bright for,
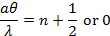
. If the screen is placed at distance L from the slit, alternating bright and dark fringes at different positions of y (each fringe will run parallel to the slit) are observed, as schematically shown in Figure 1b (left). For small θ (close to the center y = 0),
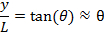
thus the fringes intensity can be approximately described as,

(this function is schematically shown in Figure 1b, right). The center y = 0 is always a bright fringe (since sin(t)/t has a maximum of 1 when t→0 and decreases monotonically down to 0 as t increases from 0 to π). Moving away from the center, the “first order” dark fringes are encountered centered at,

then bright fringes centered at,

then dark fringes again centered at,

Then bright fringes again centered at,

and so on. The width of each bright fringe outside the center is approximately λL/a, except for the central bright fringe which is twice as wide (width ~ 2λL/a, or the separation between two first-order dark fringes at ± λL/a). The narrower the slit, or the larger the wavelength λ or the screen distance L, the more spread-out the fringes will be.
If light is shone through two closely separated narrow slits with separation d (schematically depicted in Figure 2a) in an otherwise similar setup as in Figure 1, the famous “Young’s double slit interference pattern” can be observed (schematically shown in Figure 2b). It can be shown that for small θ (close to the center y = 0), bright fringes centered at,
and dark fringes centered at,

can be observed. In contrast to the single slit diffraction pattern discussed above, here all the light fringes (including the central one at y = 0), have equal widths and are equally spaced by λL/d. The narrow slits will still produce diffraction patterns, but usually the slit width (a) is much smaller than the separation (d), and the intensity modulation (due to the diffraction pattern) will superimpose on the much closer and equally spaced double-slit interference fringes.
The light source in the above discussion is assumed to be perfectly monochromatic (meaning it has one well defined-wavelength λ) and coherent (meaning if the instants that the wave oscillation reaches maximum or minimum at one location is known, the instants that the maximum or minimum will be reached at any other locations can be predicted). This is the case for example, if the wave is described by a cosine function as cos(kx−ωt+ϕ) with a uniform, constant phase ϕ, which can be chosen to be zero by redefining the starting point of time. Since a laser is the best approximation for this kind of ideal light source, a laser beam is used as the light source in this experiment (historically in the pre-laser time, such experiments have used a point-like light source such as that produced by passing light though a small hole).
It is important to note that the actual diffraction and interference fringes (including the shape and intensity of the fringes) can look more complicated and less “ideal” than those described above in these simplest cases and approximations, due to imperfections in the light source as well as in the slits. For example, the contrast of the fringes can be reduced (such that the “dark” fringes do not really reach zero intensity) if the light source is less coherent. On the other hand, the positions and spacing of the fringes are usually well-predicted by the simple model discussed above.
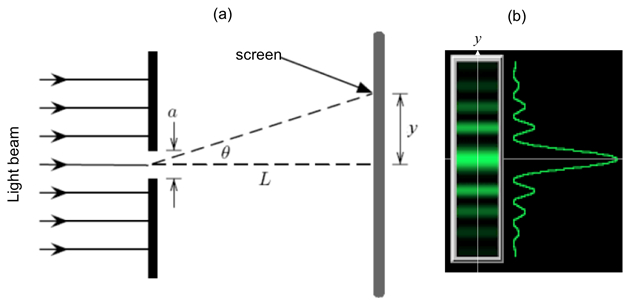
Figure 1: Single slit diffraction. (a) Schematic diagram of the optical setup, with light shining through a narrow slit of width a, and an observation screen located distance L away; and (b) Schematic diffraction fringe pattern that may be observed on the screen (left) and corresponding light intensity variation as function of vertical distance (y) away from the center.

Figure 2: Double slit interference. (a) Schematic diagram of the optical setup, with light shining through two narrow slits separated by distance d, and an observation screen located distance L away; and (b) Schematic interference fringes (equally spaced) that may be observed on the screen.
Verfahren
1. erwerben die erforderlichen Komponenten für das Experiment
- Erhalten Sie Laserschutzbrillen und tragen Sie während dieses Experiments vor dem Einschalten des Lasers.
- Erhalten Sie ein Stück Aluminiumfolie, und mit einer Schere in zwei (ca.) 2 x 2 in quadratische Stücke schneiden.
- Erhalten Sie zwei Pappen, jeweils ca. 3 x 3, mit einem Loch (Durchmesser ca. 1 Zoll) in der Mitte geschnitten.
- Erhalten Sie ein Gerät, das Klemmen können Sie die Pappe oder einen Block auf dem Pappe geklebt werden kann.
- Erhalten Sie ein paar dünne Rasierklingen.
- Erhalten ein He-Ne-Laser-Pointer mit Wellenlänge ~ 633 nm oder grünen Laser-Pointer mit Wellenlänge von 532 nm.
(2) Einzelspalt Beugung
- Nehmen Sie eine Aluminium Folie Quadrat und eine Rasierklinge verwenden, um einen Schlitz schneiden etwa 1 cm lang, in der Mitte der Folie. Verwenden Sie ein Lineal, um zu helfen, das Rasiermesser um einen geraden Schnitt zu erhalten.
- Kleben Sie die Folie auf einen Karton Platz mit dem Schlitz horizontal ausgerichtet in das offene Loch (schematisch dargestellt in Abbildung 3a). Klebeband um die Ecken der Folie (der Schlitz nicht abgedeckt). Die Pappe hilft, um die Folie während dieses Experiments zu stabilisieren. Klemmen Sie eine Kante des Kartons mit dem Gerät (der Karton sollte senkrecht auf der Tischfläche), mit dem Loch und horizontalen Schlitz ausgesetzt, und mit Blick auf eine weiße Wand (Dies ist der Bildschirm) etwa 30 cm entfernt.
- Schalten Sie den Laser-Pointer und Glanz des Laserstrahls (Vermehrung in der Richtung senkrecht zu der Folie) auf den Schlitz. Beachten Sie die hellen Muster an der Wand auf der anderen Seite der Folie. Schalten Sie das Raumlicht für bessere Sichtbarkeit des Musters.
3. doppelte Schlitz Störungen
- Nehmen Sie die Aluminium-Folie. Stapel 3 Rasierklingen zusammen, sondern mit dem mittleren Blatt der Kante eingelassen, von den anderen zwei Klingen Kanten. Verwenden Sie dieses Stapels um zwei eng beieinander liegender Schlitze in der Mitte der Folie (jeweils ca. 1 cm lang) schneiden. Verwenden Sie ein Lineal, um das Rasiermesser zu führen und einen geraden Schnitt zu machen.
- Kleben Sie die Folie auf die anderen Karton (schematisch dargestellt in Abbildung 4a) und unterstützen Sie den Karton mit dem Vice oder Block, ähnlich wie bei Schritt 2.2 wieder zu.
- Schalten Sie den Laser-Pointer und glänzen Sie den Laserstrahl auf den Doppelspalt. Beachten Sie die hellen Muster an der Wand auf der anderen Seite der Folie. Schalten Sie das Raumlicht für bessere Sichtbarkeit des Musters.
Ergebnisse
Für Schritt 2.3 zeigt eine repräsentative Lichtmuster, die an der Wand beobachtet werden kann in Abbildung 3 b, ausstellen der charakteristischen Beugung Fransen. Beachten Sie, dass die zentrale helle Fransen etwa doppelt so breit ist (in y-Richtung) als die anderen hellen Fransen (die etwa gleich breit sind), und die über die Intensität des hellen Fransen Zerfalls entfernt entlang der y-Achse, wie für die Beugungsmuster Einzelspalt erwartet.
Für Schritt 3.3 zeigt Abbildung 4 beine repräsentative Lichtmuster, die an der Wand beobachtet werden kann. Es gibt eine allgemeine Intensität Modulation-Muster, die die Beugungsmuster beobachtet im Schritt 2.3 ähnelt. Dies ist in der Tat die Beugungsmuster aufgrund jeweils die schmalen Schlitze. In den hellen Regionen die Beugungsmuster kann man ungefähr gleichmäßig verteilte helle Streifen beobachten. Dies sind Doppelspalt Interferenzstreifen. Diese Interferenzstreifen sind viel schmaler als die hellen Bereiche des das Beugungsmuster, weil die Trennung zwischen Schlitz d ist viel größer als der Schlitz Breite ein (der Kehrwert der diese Längen steuern die Breite der Einmischung oder Beugung Fransen, beziehungsweise).

Abbildung 3. Diagramm zeigt: auf einem Einzelspalt auf Aluminiumfolie, die auf Karton mit einem offenen Loch; befestigt ist (ein) ein Laserstrahl scheint und (b) repräsentative Beugung Fransen auf einem Bildschirm nach den Schlitz beobachtet.
Abbildung 4. Diagramm zeigt: (ein) ein Laser Strahl scheint auf Doppelspalte auf Aluminiumfolie, die auf Karton mit einem offenen Loch; befestigt ist und (b) repräsentative Interferenzstreifen auf einem Bildschirm nach dem Doppelspalte beobachtet.
Anwendung und Zusammenfassung
In diesem Experiment haben wir die Beugungsmuster Einzelspalt und doppelter Schlitz Interferenzmuster des Lichts, demonstriert mit Hilfe eines Laserstrahls. Diese charakteristische Wellenphänomene Beobachtung zeigt die Wellennatur des Lichts.
Die Beugung und Interferenz des Lichts spielte wesentliche Rollen bei der Entwicklung der Optik, wie sie beigetragen, dass Licht eine elektromagnetische Welle ist. Diese Effekte sind auch wichtig in vielen Technologien basierend auf Optik und Photonik. Zum Beispiel Beugung wird häufig verwendet, um die Größe eines kleinen Objektes oder kleine Löcher zu messen, und ist auch ein wichtiger Aspekt, die bei Gestaltung optische Mikroskope und imaging-Systemen. Messung von optischen Interferenzen (so genannte "Interferometrie") eignet sich für Präzisionsmessungen von Abständen (z. B. zwischen Lichtquellen oder Spiegel) und Anwendungen reichen von Bearbeitung, Geologie und Astronomie (z. B. die LIGO-Projekt, das Gravitationswellen erkannt) gefunden haben.
Der Autor des Experiments anerkennt die Unterstützung von Gary Hudson für die Vorbereitung des Materials und Chuanhsun Li für den Nachweis der Schritte in dem Video.
Tags
pringen zu...
Videos aus dieser Sammlung:

Now Playing
Interferenz und Beugung
Physics II
91.2K Ansichten

Elektrische Felder
Physics II
77.5K Ansichten

Elektrisches Potential
Physics II
104.9K Ansichten

Magnetische Felder
Physics II
33.6K Ansichten

Elektrische Ladung in einem Magnetfeld
Physics II
33.7K Ansichten

Ohmsches Gesetz
Physics II
26.2K Ansichten

Reihen- und Parallelwiderstände
Physics II
33.2K Ansichten

Kapazität
Physics II
43.8K Ansichten

Induktivität
Physics II
21.6K Ansichten

RC/RL/LC-Schaltungen
Physics II
142.9K Ansichten

Halbleiter
Physics II
29.8K Ansichten

Photoeffekt
Physics II
32.7K Ansichten

Reflexion und Brechung
Physics II
36.2K Ansichten

Stehende Wellen
Physics II
49.8K Ansichten

Schallwellen und Dopplereffekt
Physics II
23.4K Ansichten
Copyright © 2025 MyJoVE Corporation. Alle Rechte vorbehalten