JoVE Science Education
Physics II
You have full access to this content through
Nanyang Technological UniversityInterference and Diffraction
Overview
Source: Yong P. Chen, PhD, Department of Physics & Astronomy, College of Science, Purdue University, West Lafayette, IN
Interference and diffraction are characteristic phenomena of waves, ranging from water waves to electromagnetic waves such as light. Interference refers to the phenomenon of when two waves of the same kind overlap to give an alternating spatial variation of large and small wave amplitude. Diffraction refers to the phenomenon of when a wave passes through an aperture or goes around an object, different parts of the wave can interfere and also give rise to a spatial alternation of large and small amplitude.
This experiment will demonstrate the wave nature of the light by observing diffraction and interference of a laser light passing through a single slit and double slits, respectively. The slits are simply cut using razor blades in an aluminum foil and the characteristic diffraction and interference patterns manifest as patterns of alternating light and dark fringes on a screen placed after the foil, when the light is shone through the slit(s) on the foil. Historically, the observation of diffraction and interference of light played important roles in establishing that light is an electromagnetic wave.
Principles
A wave is an oscillation in the amplitude of some physical quantity in space and/or time. Waves or different parts of waves can overlap and “interfere” to produce an alternating strong and weak amplitude. Interference is one of the most characteristic phenomena associated with waves. Consider a simple example of two waves propagating along a one-dimension line (x-axis) and mathematically represented by:
and,
propagating to the right (+x direction) and left (−x direction), respectively. Here, A is the peak amplitude, and k is the “wave number” or “wave vector” defined as,

where λ is the wavelength (spatial periodicity of the wave). ω is defined as,

where f is the frequency and,

where T is the period (in time) of the wave. When the two waves overlap, their amplitudes add up (which is known as the “superposition principle of the wave”) to give:

which is also known as a “standing wave”. At those locations where,

(where n is an integer) and,

the oscillations (as functions of time t) will have maximal amplitude (between −2A and +2A). In contrast, at locations where,

and,

the oscillations will have zero (thus minimal) amplitude (also known as “nodes”). Such a spatial alternation of strong and weak wave amplitude represents an “interference pattern”. This phenomenon can be generalized to waves in two- and three-dimensional space. It also underlies the phenomena of single-slit diffraction and double-slit interference of light (which is an electromagnetic wave) to be observed in this experiment.
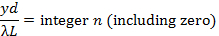
If the light of wavelength (λ) is shone on a narrow slit of width (a) (shown schematically in Figure 1a), the light intensity (which is proportional to the square of the peak amplitude of wave) far away from the slit will alternate between large and small (nearly zero) values, corresponding to “bright” and “dark” regions, along the width direction (“y-axis” in Figure 1a) of the slit. This alternation, known as the “diffraction pattern” of the light (through a small aperture), is also a characteristic phenomenon for waves. Fundamentally, it arises from the interference between different parts of the light wave after the aperture (in particular, points between the two edges of the aperture will “re-emit” the light wave towards different directions). The angular variation of the light intensity is denoted as I(θ), where θ represents the angle of the direction (towards +y or –y) away from the “straight through” direction, through y = 0 in Figure 1a). For small θ, it can be shown that I(θ) is approximately proportional to |sin(πaθ/λ)/(πaθ/λ)|2. That is, “dark” for,
and “bright for,
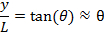
. If the screen is placed at distance L from the slit, alternating bright and dark fringes at different positions of y (each fringe will run parallel to the slit) are observed, as schematically shown in Figure 1b (left). For small θ (close to the center y = 0),
thus the fringes intensity can be approximately described as,

(this function is schematically shown in Figure 1b, right). The center y = 0 is always a bright fringe (since sin(t)/t has a maximum of 1 when t→0 and decreases monotonically down to 0 as t increases from 0 to π). Moving away from the center, the “first order” dark fringes are encountered centered at,

then bright fringes centered at,

then dark fringes again centered at,

Then bright fringes again centered at,

and so on. The width of each bright fringe outside the center is approximately λL/a, except for the central bright fringe which is twice as wide (width ~ 2λL/a, or the separation between two first-order dark fringes at ± λL/a). The narrower the slit, or the larger the wavelength λ or the screen distance L, the more spread-out the fringes will be.
If light is shone through two closely separated narrow slits with separation d (schematically depicted in Figure 2a) in an otherwise similar setup as in Figure 1, the famous “Young’s double slit interference pattern” can be observed (schematically shown in Figure 2b). It can be shown that for small θ (close to the center y = 0), bright fringes centered at,
and dark fringes centered at,

can be observed. In contrast to the single slit diffraction pattern discussed above, here all the light fringes (including the central one at y = 0), have equal widths and are equally spaced by λL/d. The narrow slits will still produce diffraction patterns, but usually the slit width (a) is much smaller than the separation (d), and the intensity modulation (due to the diffraction pattern) will superimpose on the much closer and equally spaced double-slit interference fringes.
The light source in the above discussion is assumed to be perfectly monochromatic (meaning it has one well defined-wavelength λ) and coherent (meaning if the instants that the wave oscillation reaches maximum or minimum at one location is known, the instants that the maximum or minimum will be reached at any other locations can be predicted). This is the case for example, if the wave is described by a cosine function as cos(kx−ωt+ϕ) with a uniform, constant phase ϕ, which can be chosen to be zero by redefining the starting point of time. Since a laser is the best approximation for this kind of ideal light source, a laser beam is used as the light source in this experiment (historically in the pre-laser time, such experiments have used a point-like light source such as that produced by passing light though a small hole).
It is important to note that the actual diffraction and interference fringes (including the shape and intensity of the fringes) can look more complicated and less “ideal” than those described above in these simplest cases and approximations, due to imperfections in the light source as well as in the slits. For example, the contrast of the fringes can be reduced (such that the “dark” fringes do not really reach zero intensity) if the light source is less coherent. On the other hand, the positions and spacing of the fringes are usually well-predicted by the simple model discussed above.
Figure 1: Single slit diffraction. (a) Schematic diagram of the optical setup, with light shining through a narrow slit of width a, and an observation screen located distance L away; and (b) Schematic diffraction fringe pattern that may be observed on the screen (left) and corresponding light intensity variation as function of vertical distance (y) away from the center.

Figure 2: Double slit interference. (a) Schematic diagram of the optical setup, with light shining through two narrow slits separated by distance d, and an observation screen located distance L away; and (b) Schematic interference fringes (equally spaced) that may be observed on the screen.
Procedure
1. Acquiring the Required Components for the Experiment
- Obtain laser safety goggles and wear during this experiment before turning on the laser.
- Obtain a piece of aluminum foil, and use scissors to cut it into two (approximately) 2 x 2 in square pieces.
- Obtain two cardboards, each about 3 x 3 in, with a hole (diameter about 1 in) cut in the middle.
- Obtain a device that can clamp the cardboard or a block to which the cardboard can be taped.
- Obtain a few thin razor blades.
- Obtain a He-Ne laser pointer with wavelength ~ 633 nm or green laser pointer with wavelength of 532 nm.
2. Single Slit Diffraction
- Take an aluminum foil square and use a razor blade to cut a slit about 1 cm long in the middle of the foil. Use a ruler to help guide the razor to obtain a straight cut.
- Tape the foil onto a cardboard square with the slit oriented horizontally inside the open hole (schematically shown in Figure 3a). Put tape around the corners of the foil (do not cover the slit). The cardboard helps to stabilize the foil during this experiment. Clamp one edge of the cardboard with the device (the cardboard should be perpendicular to the table surface), with the hole and horizontal slit exposed, and facing a white wall (which will be the screen) about 30 cm away.
- Turn on the laser pointer and shine the laser beam (propagating in the direction normal to the foil) onto the slit. Observe the light pattern on the wall on the other side of the foil. Turn off the room light for better visibility of the pattern.
3. Double Slit Interference
- Take the other aluminum foil. Stack 3 razor blades together but with the middle blade’s edge recessed from the other two blades’ edges. Use this stack to cut two closely-spaced slits in the middle of the foil (each about 1 cm long). Use a ruler to help guide the razor and make a straight cut.
- Tape the foil onto the other cardboard (schematically shown in Figure 4a) and again support the cardboard with the vice or block, similar to step 2.2.
- Turn on the laser pointer and shine the laser beam onto the double slit. Observe the light pattern on the wall on the other side of the foil. Turn off the room light for better visibility of the pattern.
Results
For step 2.3, a representative light pattern that may be observed on the wall is shown in Figure 3b, exhibiting the characteristic diffraction fringes. Note that the central bright fringe is approximately twice as wide (in the y-direction) as the other bright fringes (which are about the same in width), and the over intensity of the bright fringes decay away from the center along the y-axis, as expected for the single slit diffraction pattern.
For step 3.3, a representative light pattern that may be observed on the wall is shown in Figure 4b. There is an overall intensity modulation pattern that looks similar to the diffraction pattern observed in step 2.3. This is indeed the diffraction pattern due to each of the narrow slits. Inside the bright regions of the diffraction pattern, one can observe approximately equally spaced bright stripes. These are the double slit interference fringes. These interference fringes are much narrower than the bright regions of the diffraction pattern because the inter-slit separation d is much larger than the slit width a (the reciprocal of these lengths control the widths of the interference or diffraction fringes, respectively).

Figure 3. Diagram showing: (a) a laser beam shining on a single slit on aluminum foil, which is fixed on cardboard with an open hole; and (b) representative diffraction fringes observed on a screen after the slit. 
Figure 4. Diagram showing: (a) a laser beam shining on double slits on aluminum foil, which is fixed on cardboard with an open hole; and (b) representative interference fringes observed on a screen after the double slits.
Application and Summary
In this experiment, we have demonstrated the single slit diffraction pattern and double slit interference pattern of light, using a laser beam. Observing these characteristic wave phenomena demonstrates the wave nature of the light.
The diffraction and interference of light played essential roles in the development of optics as they helped establish that light is an electromagnetic wave. These effects are also important in many technologies based on optics and photonics. For example, diffraction is commonly used to measure the size of a small object or small holes, and is also an important aspect to consider when designing optical microscopes and imaging systems. Measurement of optical interference (so called “interferometry”) can be used for precision measurement of distances (such as those between light sources or mirrors) and have found applications ranging from machining, geology, and astronomy (such as in the LIGO project that detected gravitational waves).
The author of the experiment acknowledges the assistance of Gary Hudson for material preparation and Chuanhsun Li for demonstrating the steps in the video.
Tags
Skip to...
Videos from this collection:

Now Playing
Interference and Diffraction
Physics II
91.2K Views

Electric Fields
Physics II
77.5K Views

Electric Potential
Physics II
104.8K Views

Magnetic Fields
Physics II
33.5K Views

Electric Charge in a Magnetic Field
Physics II
33.7K Views

Investigation Ohm's Law for Ohmic and Nonohmic Conductors
Physics II
26.2K Views

Series and Parallel Resistors
Physics II
33.1K Views

Capacitance
Physics II
43.8K Views

Inductance
Physics II
21.6K Views

RC/RL/LC Circuits
Physics II
142.9K Views

Semiconductors
Physics II
29.8K Views

Photoelectric Effect
Physics II
32.7K Views

Reflection and Refraction
Physics II
36.2K Views

Standing Waves
Physics II
49.8K Views

Sound Waves and Doppler Shift
Physics II
23.4K Views
ISSN 2578-9082
Copyright © 2025 MyJoVE Corporation. All rights reserved
We use cookies to enhance your experience on our website.
By continuing to use our website or clicking “Continue”, you are agreeing to accept our cookies.