
Cyclic Voltammetry (CV)
Overview
Source: Laboratory of Dr. Kayla Green — Texas Christian University
A Cyclic Voltammetry (CV) experiment involves the scan of a range of potential voltages while measuring current. In the CV experiment, the potential of an immersed, stationary electrode is scanned from a predetermined starting potential to a final value (called the switching potential) and then the reverse scan is obtained. This gives a 'cyclic' sweep of potentials and the current vs. potential curve derived from the data is called a cyclic voltammogram. The first sweep is called the 'forward scan' and the return wave is called the 'reverse scan'. The potential extremes are termed the 'scan window'. The magnitude of reduction and oxidation currents and the shape of the voltammograms are highly dependent on analyte concentration, scan rates, and experimental conditions. By varying these factors, cyclic voltammetry can yield information regarding the stability of transition metal oxidation state in the complexed form, reversibility of electron transfer reactions, and information regarding reactivity. This video will explain the basic setup for a cyclic voltammetry experiment including analyte preparation and setting up the electrochemical cell. A simple cyclic voltammetry experiment will be presented.
Principles
In a cyclic voltammetry experiment the potential applied between the reference electrode and working electrode increases in a linear fashion with time (scan rate (V/s)). Concomitantly, the current is measured between the working and counter (or auxiliary) electrode resulting in data that is plotted as current (i) vs. potential (E). Reduction and oxidation events are observed and assigned in the resulting plots. Reduction events occur at analyte specific potential voltages where the reaction M+n + e- → M+n-1 (M = metal) is energetically favored (known as reduction potential) and measured by increasing current values. The current will increase as the voltage potential reaches the reduction potential of the analyte, but then falls off as the maximum rate of mass transfer has been reached. The current goes down only to reach equilibrium at some steady value. Oxidation reactions (M+n → M+n+1 + e-) can also be observed as a decrease in current values at potentials that energetically favor the loss of electron(s).
The resulting voltammograms are then analyzed and the potential (Ep) and current (Ip) data for both reduction and oxidation events under each setup experimental conditions are noted. This information can be utilized to evaluate the reversibility of coupled reduction and oxidation events. As noted above peak potentials (Epa and Epc) and the peak currents (ipc and ipa) are the fundamental parameters used to characterize a redox couple or event. During a reversible redox process, the oxidized and reduced forms of a compound are in equilibrium at the electrode surface. The Nernst equation describes the relationship between potential and the equilibrium ratio, ([R] / [O])x=0.
 (1)
(1)
Where,  is called the formal potential of the reaction and takes into account the activity coefficients and other experimental factors.
Specifically, the peak current of a reversible reaction is given by:
 (2)
(2)
where, ip is peak current in amperes, n is the number of electrons involved, A is the area of the electrode in cm2, Do is the diffusion constant (cm2/s), v is the scan rate (V/s) and Co* is the bulk concentration (moles/cm3). The diffusion constant can be measured using more extensive experiments detailed elsewhere and are not the focus of this video1. However, more basic guidelines can be used for evaluating the reversibility of a system1. Criteria for a totally reversible system1:
 at various scan rates n = number of electrons
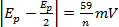 at various scan rates
- |ipa/ipc| = 1 at various scan rates
- Ep is independent of v v = scan rate
- at potentials beyond Ep, i-2
 t
t
Simple diagnostic tests for defining a totally irreversible system at 25 °C are:
- No reverse peak (this refers to chemical irreversibility, but not necessarily to electron transfer irreversibility)
- Epc shifts
 for each decade increase in v (electrochemical irreversibility)
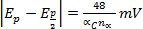
Finally, diagnostic tests for defining a quasi-reversible system are:


- Epc shifts negatively with increasing v
The position of the reduction and/or oxidation events can be used to infer information about the electronic nature of transition metal complexes and the effects on ligands as donors. For example, the Fe+3/+2 reduction potential of ferrocene derivatives is very sensitive to the electronic environment provided by the cyclopentadienyl (Cp) ligand set. Electron donating (withdrawing) Cp substituents increase (decrease) the electron density on the iron center and shift the redox potential to negative (positive) values relative to Fc.
In this protocol ferrocene will be used as an example. Experimental conditions such as solvent, electrolyte choice, and the potential range studied (scan window) are largely dictated by analyte solubility and experimental conditions. Users are encouraged to consult relevant texts such as Bard and Faulkner1 to learn more.
Procedure
1. Preparation of Electrolyte Solution
- Prepare an electrolyte stock solution (10 mL) composed of 0.1 M [Bu4N][BF4] in CH3CN.
- Place the electrolyte solution in the electrochemical vial, add a small stir bar, and place the cap onto the vial as shown in Figure 1.
- Check to ensure that the nitrogen lead is in the electrolyte solution. Stir and degas the electrolyte solution with a gentle stream of dry N2 gas (~10 min) to remove redox active molecular oxygen.
- During step 1.3, carefully insert the working electrode (e.g. glassy carbon), counter (Pt), and reference electrodes (Ag/AgNO3) into the Teflon cell top. Connect the cell stand leads to the appropriate electrode.

Figure 1. Setup of an electrochemical cell.
2. Obtaining a Background Scan
- Define the experimental conditions for the solvent. For acetonitrile, the scan window is typically +2,000 mV – -2,000 mV.
- Run and save voltammograms of the electrolyte solution at a range of scan rates (e.g. 20 mV/s, 100 mV/s, and/or 300 mV/s).
- Check the resulting scan to ensure that there are no impurities in the electrolyte solution or remaining oxygen. A clean system will have no redox events. If the setup is contaminated, the electrodes and glassware will need to be cleaned and the electrolyte solution remade using clean components.
3. Preparation of Analyte Solution
- Combine the analyte (~2-5 mM, final concentration) of interest with the electrolyte solution prepared above.
- Check to ensure that the nitrogen lead is in the electrolyte solution. Stir and degas the analyte/electrolyte solution with a gentle stream of dry N2 gas (~10 min) to remove redox active molecular oxygen.
4. Cyclic Voltammetry of Analyte
- Perform multiple cyclic voltammogram experiments at scan rates from 20 mV – 1,000 mV (dependent upon the cell stand capabilities). Begin each scan using the calculated open circuit potential.
- Methodically vary the scan direction [(+ to –) and (– to +)] and scan window to isolate redox events of interest. The voltammogram should always start from zero current (open circuit). Ferrocene (Fc) undergoes an oxidation reaction to ferrocenium (Fc+).
- Many groups standardize data to the Fc/Fc+ redox couple. In this practice, ~2 mg of Fc are added to the analyte solution and step 4.2 is repeated for referencing purposes. In data analysis, all spectra are normalized to the Fc/Fc+ couple set to 0.00 V. A table of normalized reduction potentials is available2.
5. Cleaning of Electrodes and the Electrochemical Cell
- Carefully unclamp and remove each electrode from the electrochemical cell.
- Rinse the reference electrode with acetonitrile and dry with a Kimwipe. Store in reference electrode storage solution.
- GENTLY clean the working and counter electrode according to guidelines from manufacturers (e.g. BASi: http://www.basinc.com/mans/pguide.pdf) to remove the redox reaction products that accumulate during some experiments.
Results
A CV scan of ferrocene at 300 mV/s in acetonitrile was carried out and the corresponding voltammogram is shown in Figure 2.

The ΔE can be derived from the data in Figure 2 based on the difference between Epa and Epc.

The cyclic voltammograms overlaid in Figure 3 represent consecutive experiments performed on the same system at different scan rates. As noted in above, a linear plot of Ip vs. v1/2 (inset in Figure 3) shows that the reaction is diffusion controlled.
The position of the E1/2 or redox event (Epa or Epc) can be used to determine the effects that the ligand has on the redox active metal center providing the electrochemical response. Figure 4 shows a series of ferrocene-based congeners with varying substitutions on the Cp ring. As shown in Figure 5, the electron withdrawing halide results in the E1/2 value of this complex to be shifted to more positive potentials because the oxidized form is destabilized by the electron withdrawing ligand. The electron donating methyl groups of compound C result in the E1/2 to shift to more negative potentials as the oxidized species is stabilized.

Figure 2. A CV scan of ferrocene at 150 mV/s in acetonitrile. Please click here to view a larger version of this figure.

Figure 3. A cobalt-containing compound that gives rise to one reduction event. The inset shows a linear correlation between ip and v1/2. Please click here to view a larger version of this figure.

Figure 4. A series of ferrocene-based compounds. Please click here to view a larger version of this figure.
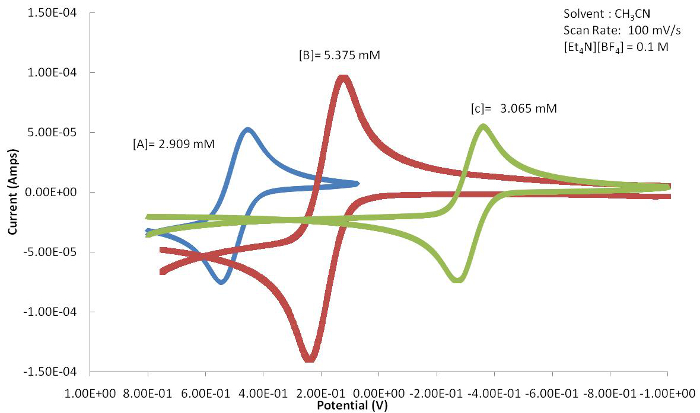
Figure 5. The resulting cyclic voltammograms of A-C (Figure 4) show a marked shift in E1/2 due to the electronic ligand effects attached to the metal center. Please click here to view a larger version of this figure.
References
- Bard, A. J., Faulkner, L. A. Electrochemical methods: Fundamentals and Applications. 2nd ed. New York: Wiley; 833 p. (2001).
- Geiger, W. E., Connelly, N. G. Chemical Redox Agents for Organometallic Chemistry. Chem Rev. 96 (2), 877-910, (1996).
Tags
Skip to...
Videos from this collection:

Now Playing
Cyclic Voltammetry (CV)
Analytical Chemistry
125.0K Views

Sample Preparation for Analytical Characterization
Analytical Chemistry
84.6K Views

Internal Standards
Analytical Chemistry
204.7K Views

Method of Standard Addition
Analytical Chemistry
319.9K Views

Calibration Curves
Analytical Chemistry
796.3K Views

Ultraviolet-Visible (UV-Vis) Spectroscopy
Analytical Chemistry
623.1K Views

Raman Spectroscopy for Chemical Analysis
Analytical Chemistry
51.2K Views

X-ray Fluorescence (XRF)
Analytical Chemistry
25.4K Views

Gas Chromatography (GC) with Flame-Ionization Detection
Analytical Chemistry
281.9K Views

High-Performance Liquid Chromatography (HPLC)
Analytical Chemistry
384.2K Views

Ion-Exchange Chromatography
Analytical Chemistry
264.4K Views

Capillary Electrophoresis (CE)
Analytical Chemistry
93.8K Views

Introduction to Mass Spectrometry
Analytical Chemistry
112.2K Views

Scanning Electron Microscopy (SEM)
Analytical Chemistry
87.1K Views

Electrochemical Measurements of Supported Catalysts Using a Potentiostat/Galvanostat
Analytical Chemistry
51.4K Views
Copyright © 2025 MyJoVE Corporation. All rights reserved