Magnetic Activated Cell Sorting (MACS): Isolation of Thymic T Lymphocytes
Overview
Source: Meunier Sylvain1,2,3, Perchet Thibaut1,2,3, Sophie Novault4, Rachel Golub1,2,3
1 Unit for Lymphopoiesis, Department of Immunology, Pasteur Institute, Paris, France
2 INSERM U1223, Paris, France
3 Université Paris Diderot, Sorbonne Paris Cité, Cellule Pasteur, Paris, France
4 Flow Cytometry Platfrom, Cytometry and Biomarkers UtechS, Center for Translational Science, Pasteur Institute, Paris, France
Defence against pathogens depends on surveillance by the immune system. This system is complex and comprises many cell types, each one with specific functions. This complex composition enables immune responses to a large diversity of pathogens and injuries. Adaptive immunity allows specific responses against specific pathogens. The majority of cells responsible for this type of immunity are the lymphocytes (B cells and T cells). Usually, B cells respond to extracellular infections (such as bacterial infections), and T cells respond to intracellular infections (such as viral infections). The different types of cells in lymphocyte populations can be characterized by the combination of cell surface proteins they express and/or by a panel of secreted cytokines.
Magnetic sorting allows enrichment of targeted cell populations using magnetic properties and expression of one or several cell surface proteins (1, 2). This technique consists of three steps. First, the cells are incubated with magnetic beads that are coupled with one or several monoclonal-specific antibodies. Cells that express surface proteins that bind to these antibodies attach to the magnetic beads. Then, the targeted cell populations are captured with a magnet. To finish, the targeted cells are eluted from the magnet. At the end, two sorting products are obtained, one containing unlabeled cells and the second containing the target cells coupled with the magnetic beads. Columns can be used to improve the efficiency of magnetic sorting. In the column, a non-magnetic element lengthens the path of cell through the column. Hence, cell flow is slowed down, facilitating cell capture by the magnet.
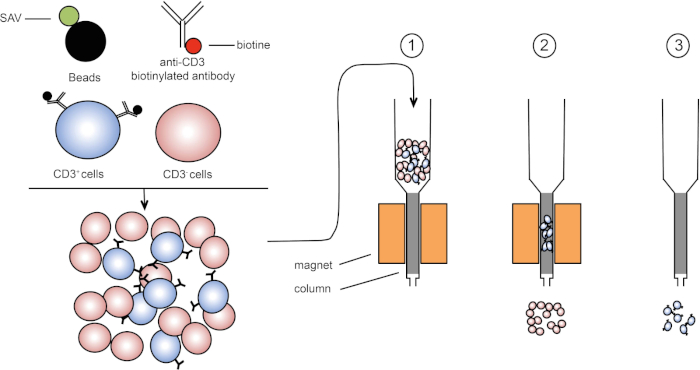
Figure 1: Schematic representation of magnetic separation. Thymic leukocytes are stained with anti-CD3 biotinylated antibodies. After washing, streptavidin (SAV) coupled beads specifically fix the biotin on anti-CD3 antibodies. (1) Cells are transferred in a column. (2) The magnet does not retain unlabeled cells, while CD3-positive cells remain in the column. Finally, the column is separated from the magnet and (3) CD3-positive cells are eluted in medium. Please click here to view a larger version of this figure.
There are two types of magnetic sorting (3). In positive sorting, cells of interest are captured with the magnetic beads. In negative sorting, unwanted cells are removed by capturing with the magnetic beads carrying the appropriate antibodies. This MACS technique permits good enrichment of targeted cells and improves the percentage of recovered cells from 1-20% to 60-98% in an organ. After sorting, it is necessary to verify cell purity and sorting by different methods (e.g. flow cytometry). The MACS technique is ideal to enrich a target population for other experiments such as cell culture or cell cycle analysis.
In this lab exercise, we demonstrate how to isolate thymic leukocytes and thereafter enrich thymic CD3-positive cells from the mix using magnetic cell sorting technique.
Procedure
1. Preparation
- Before beginning, put on laboratory gloves and appropriate protective clothing.
- Wash all the dissection tools, first with a detergent and then with 70% ethanol and then dry them with a clean paper towel.
- Prepare 200 mL of Hank's balanced salt solution (HBSS) containing 2% fetal calf serum (FCS).
2. Dissection
- Pin a euthanized mouse on a dissection plate in the supine position.
- Using scissors and forceps perform a longitudinal laparotomy to access the chest cavity.
- Remove the heart to gain access to the thymus, which is located above the heart. Then, identify the thymus, which is composed of two white lobes and is located in the chest cavity above the heart.
- Using forceps carefully detach the thymus and place it on the Petri dish with 5 mL of HBSS 2% FCS.
3. Immune cell isolation
- Place the thymus on a 40 µm cell strainer over the same Petri dish. Crush the thymus with a plunger to dissociate it in the same dish.
- Transfer the dissociated thymus and the fluid into a 15 mL centrifuge tube.
- Wash the Petri dish with 5 mL of HBSS 2% FCS and transfer the washed medium also into the same centrifuge tube.
- Centrifuge the tube at 370 x g for 7 min at 20°C and discard the supernatant avoiding the pellet.
- Resuspend the pellet in 2 mL of potassium acetate to lyse the erythrocytes. Wait for 2 min and then make up the volume up to 14 mL using HBSS 2% FCS.
- Centrifuge the tube again at 370 x g for 7 min at 20°C. Discard the supernatant and resuspend the pellet in 5 mL of HBSS 2% FCS.
- Estimate the cell concentration using the trypan blue staining assay and adjust the final cell concentration to 107 cells/mL using appropriate volume of HBSS 2% FCS.
4. Magnetic labeling of immune cells
- Take two FACS tubes. Label one tube, "non-enriched T cells", and the other tube, "enriched T cells"- which will be separated using magnetic labeling.
- Distribute of cell solution into each of the two FACS tubes.
- Centrifuge the "enriched T cells" tube at 370 x g for 3 min at 20°C and discard the supernatant avoiding the pellet.
- Resuspend the pellet in 250 µL of anti-CD3 biotinylated antibodies mix (Table 1, Mix 1).
| Mix | Labeling reagents | Dilution |
| 1 | Anti-CD3 biotinylated antibody | 1/400 (in HBSS 2% FCS) |
| 2 | Streptavidin coupled beads | 1/5 (in HBSS 2% FCS) |
| 3 | Anti-CD3 BV421 | 1/200 (in HBSS 2% FCS) |
Table 1: Antibodies mix composition. Mixes 1 and 2 are used for magnetic separation. Mix 3 is used for evaluating the cell enrichment after magnetic separation.
- Incubate the cell suspension-antibody mix for 15 minutes at 4°C in the dark.
- Add 3 mL of HBSS 2% FCS to both the tubes and centrifuge them again at 370 x g for 3 min at 20°C.
- Discard the supernatant and resuspend the pellet in 250 µL streptavidin-coupled beads (Table 1, Mix 2).
- Incubate the cell mixture and beads for 20 min on ice.
- Next, add 3 mL of HBSS 2% FCS and mix well and centrifuge again at 370 x g for 3 min at 20°C.
- Resuspend the pellet in 2 mL of HBSS 2% FCS.
5. Magnetic Separation of CD3-Positive Cells
- Place the column on the magnet and add 3 mL of HBSS 2% FCS to humidify the system. Wait 5 minutes.
- Next, pipet the labelled cells into the column.
- After the cell suspension passes through the column, wash the column X3 times with 3 mL of HBSS 2% FCS.
- Then, remove the column from the magnet and place it in a 15 mL collection tube.
- To elute the target cells, add 5 mL of HBSS 2% FCS to the column and flush the column with the plunger.
- Repeat elution step with another 5 mL of HBSS 2% FCS.
6. Evaluation of Target-Cell Enrichment by Flow Cytometry
- Transfer 500 µL of eluted cell suspension to a FACS tube labeled "enriched T cells". Transfer 200 µL of "non-enriched T cells" suspension to a second FACS.
- Then, centrifuge both the tubes at 370 x g for 7 min at 20°C.
- Discard the supernatant, then add 100 µL of fluorescent antibody Mix 3 (see Table 1) to both tubes.
- Incubate both the tubes for 20 min at 4°C in the dark.
- Next, add 3 mL of HBSS 2% FCS to tubes and centrifuge them at 370 x g for 3 min at 20°C.
- Discard the supernatant, then resuspend each tube in 250 µL of HBSS 2% FCS.
- Now, evaluate the CD3-positive cell enrichment rate by flow cytometry.
7. Data Analysis
- Open the 'FlowJo' icon and drag the files for each tube in the "All Sample" window.
- Double click on the "enriched T cells" file to display the dot plot displaying forward scatter (FSC-A) on the X-axis and side scatter (SSC-A) on the Y-axis.
- Click on "Polygon" to circle the lymphocyte populations.
- Next, double click on the circled population to create a new window.
- Select "FSC-W" on the Y axis and "FSC-A" on the X axis, and circle the FSA-W negative cells. In the "Subpopulation identification" window, name the cell population "single cells".
- Double click on the circled population to create a new window. Select "CD3" on the Y axis, and circle the CD3-positive cells. In the "Subpopulation identification" window name your cell population "T cells".
- Repeat with the "non-enriched T cells".
- To visualize cell population, click on "Layout editor" and drag the "T cells" population from "enriched T cells" and "non-enriched T cells" files into the tab.
- Dot plots representing CD3+ lymphocytes will appear. CD3+ cells should only appear in the population of interest in the CD3+ enriched tube.
- To evaluate the enrichment of CD3+ lymphocytes in the sorted cells, click on "Table editor", and then drag the "T cells" population from "enriched T cells" and "non-enriched T cells" files into the table.
- On the "Statistic" menu, select "Frequency of lymphocytes" cells to check the percentage of CD3+ cells in all lymphocytes, then click on "Create table".
- Parameter values will appear in a new table. For the "enriched T cells", the frequency of CD3+ cells should be around 80%.
Results
In this protocol, CD3-positive cells were enriched from thymic leukocytes using magnetic cell sorting (Figure 1). Before magnetic cell enrichment CD3-positive cells represented 53.6% of the total thymic cells (Figure 2, top panels). After magnetic cell enrichment the percentage of CD3-positive cells increased to 95% (Figure 2, bottom panels). Thus, MACS is a simple, fast and efficient cell enrichment technique to enrich desired cell populations from a cell suspension mixture.
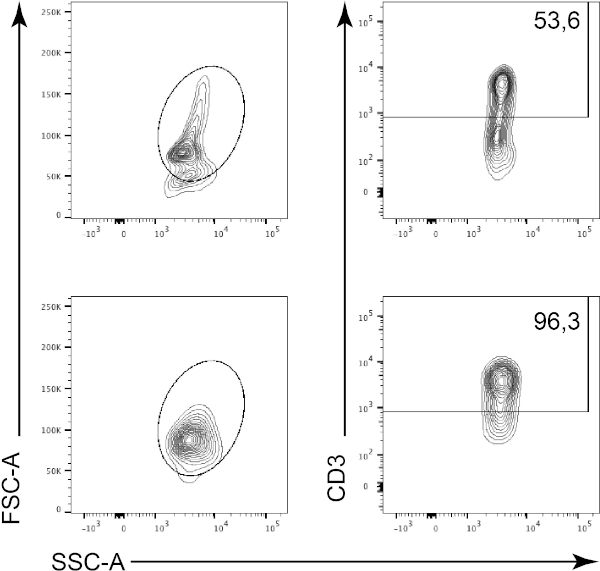
Figure 2: Gating strategy and purity test sorting. Cells are first gated based on their morphology (left: FSC-A, SSC-A), and then cells are plotted against CD3 (right: CD3, SSC-A). Top panel represents thymus cell suspension before cell enrichment. Bottom panel represents thymus cell suspension after magnetic cell sorting. Please click here to view a larger version of this figure.
Application and Summary
Magnetic separation technology is a common method to easily and rapidly sort a target cell population. Using T cells specific antibodies and magnetic beads we enriched T cells frequency in our sample. The purity rate at the end of the experiment depends of the percentage of target cells in the initial cell suspension. Cells obtained after magnetic cell sorting can be used for various purposes such as- cell transfer or cell cycle analysis. Another sorting method, using flow cytometry, can be used to enrich cells. This technique yields have a very high purity rate after cell sorting however it requires more steps and takes more time.
References
- Owen, C. S. and Sykes, N. L. Magnetic labeling and cell sorting. Journal of Immunological Methods. 73 (1), 41-48 (1984).
- Miltenyi, S., Müller, W., Weichel, W. and Radbruch, A. High gradient magnetic cell separation with MACS. Cytometry. 11 (2), 231-238 (1990).
- Plouffe, B. D., Murthy, S. K. and Lewis, L. H. Fundamentals and application of magnetic particles in cell isolation and enrichment: a review. Reports on Progress in Physics. 78 (1), (2014).
Skip to...
Videos from this collection:

Now Playing
Magnetic Activated Cell Sorting (MACS): Isolation of Thymic T Lymphocytes
Immunology
22.7K Views

Flow Cytometry and Fluorescence-Activated Cell Sorting (FACS): Isolation of Splenic B Lymphocytes
Immunology
92.5K Views

ELISA Assays: Indirect, Sandwich, and Competitive
Immunology
236.8K Views

ELISPOT Assay: Detection of IFN-γ Secreting Splenocytes
Immunology
28.3K Views

Immunohistochemistry and Immunocytochemistry: Tissue Imaging via Light Microscopy
Immunology
78.5K Views

Antibody Generation: Producing Monoclonal Antibodies Using Hybridomas
Immunology
43.3K Views

Immunofluorescence Microscopy: Immunofluorescence Staining of Paraffin-Embedded Tissue Sections
Immunology
53.5K Views

Confocal Fluorescence Microscopy: A Technique to Determine the Localization of Proteins in Mouse Fibroblasts
Immunology
43.0K Views

Immunoprecipitation-Based Techniques: Purification of Endogenous Proteins Using Agarose Beads
Immunology
87.3K Views

Cell Cycle Analysis: Assessing CD4 and CD8 T Cell Proliferation After Stimulation Using CFSE Staining and Flow Cytometry
Immunology
24.1K Views

Adoptive Cell Transfer: Introducing Donor Mouse Splenocytes to a Host Mouse and Assessing Success via FACS
Immunology
22.1K Views

Assay for Cell Death: Chromium Release Assay of Cytotoxic Ability
Immunology
151.3K Views
Copyright © 2025 MyJoVE Corporation. All rights reserved