Sound Waves and Doppler Shift
Overview
Source: Arianna Brown, Asantha Cooray, PhD, Department of Physics & Astronomy, School of Physical Sciences, University of California, Irvine, CA
Waves are disturbances that propagate through a material medium or empty space. Light waves can travel through a vacuum and some forms of matter, and are transverse in nature, which means that the oscillations are perpendicular to the direction of propagation. However, sound waves are pressure waves that travel through an elastic medium like air, and are longitudinal in nature, which means the oscillations are parallel to the direction of propagation. When sound is introduced to a medium by a vibrating object, like the vocal chords of a person or strings in a piano, the particles in the air experience forward and backward motion as the vibrating object moves forward and backward. This results in regions in the air where the air particles are compressed together, called compressions, and other regions where they are spread apart, called rarefactions. The energy created by a sound wave oscillates between the potential energy created by the compressions and the kinetic energy of the small movements and speeds of the particles of the medium.
Compressions and rarefactions can be used to define the relationship between sound wave velocity and frequency. The goal of this experiment is to measure the speed of sound in air and explore the apparent change in frequency for an object emitting sound waves while in motion, called the Doppler effect.
Principles
As a sound wave propagates, it periodically compresses and rarefies (spreads out) the air molecules at any one location. Since the relationship between pressure and density is dependent on temperature, the speed of sound traveling through air is also dependent on temperature and defined as:
 (Equation 1)
where TC is the air temperature in degrees Celsius (°C) and v is the velocity of the sound wave measured in meters per second (m/s). Classically, the speed of a wave is defined as:
 (Equation 2)
where λ is the wavelength (m), or the distance between pressure waves, and f is the frequency (Hz), or the number of waves per unit time. Equation 1 is an estimation for air that is at a standstill; if the medium of the sound wave is traveling, the speed of sound will change depending on the direction of the movement. For example, sound waves moving opposite in direction of strong winds will likely have its speed decreased by the speed of the wind. In this experiment, this effect is negligible.
When the source of the sound is changing speed or direction and the medium is generally at a standstill, there is no change in the speed of the sound wave. However, an observer may hear a false increase or decrease in frequency due to the Doppler effect. As the source of waves move closer to the observer, the waves are emitted in positions that are closer together. They are still emitted at the same frequency, but due to their relative positions as the source moves they reach the observer bunched together and seemingly at a higher frequency. By the same logic, when the source is moving away from the observer, the observer hears the sound at lower frequencies. The easiest way to understand this effect is to imagine a police car with a siren driving towards a pedestrian: as it drives towards the pedestrian, the frequency to the pedestrian appears to get higher and higher until finally the car passes the pedestrian, and the pedestrian begins to hear frequencies that decrease as the car drives away. The relationship between the observed frequency f and emitted frequency f0 is defined by:

where c is the velocity of sound waves in air, vr is the velocity of the receiver relative to the medium and (= 0 if the receiver is at rest), and vs is the velocity of the source relative to the medium.
In this experiment, we will calculate the speed of sound using various frequencies and wavelengths, and compare that speed to the theoretical speed. We will also observe the Doppler effect on the frequencies emitted by a tuning fork.
Procedure
1. Measuring the Speed of Sound
- Set up: two speakers facing one another on an optical bench. One speaker should be plugged into a function (signal) generator on one side of a BNC tee, with the other side of the BNC tee connected to channel A on the oscilloscope. The second speaker should be plugged into channel B in the oscilloscope.
- Turn on the signal generator and oscilloscope, and adjust the dial on the generator to produce a 5 kHz wave. The speaker connected to the function generator should produce a steady pitch that sounds like an alarm and two waves should appear on the oscilloscope.
- Slide the speaker that is connected to channel B along the bench until the two waves are in phase. Record the distance between the two speakers.
- Slowly slide the channel B speaker backwards so that the waves are out of phase. Continue sliding backwards until the waves are in phase again. Record the new distance between the speakers.
- Subtract the final distance from the initial to find the wavelength of the sound. Use this value and the frequency to calculate the observed speed of sound using Equation 2.
- Repeat steps 1.3-1.5 for 8 kHz and 3 kHz frequencies. Notice the inversely proportional relationship between wavelength and frequency.
- Compare the experimental speeds to the expected speed using the classroom temperature.
2. Doppler Effect with a Tuning Fork/Doppler Apparatus
The video demonstrates an experiment using a Doppler apparatus, but this same experiment could be carried out using a tuning fork. The protocol using a tuning fork is described here:
- Tie a 1 m long piece of string to the end of a tuning fork. When held at waist length, the tuning fork should get close to but not touch the floor.
- Connect a microphone to an oscilloscope channel and place the microphone at a fixed distance (roughly 1.5 m).
- Hit the tuning fork to create a sound and hold in place at 1.5 m from the microphone. Notice how many waves appear on the screen.
- Hit the tuning fork again and start swinging the fork around in circles at a steady speed.
- Those observing the swinging tuning fork will notice that as the fork swings towards them, the frequency, or pitch, gets higher. Simultaneously, the oscilloscope should show slightly more waves on the screen. As it swings away from them, the pitch gets lower and the oscilloscope should show slightly less waves on the screen. See Figure 1 below for an example of an oscilloscope view.
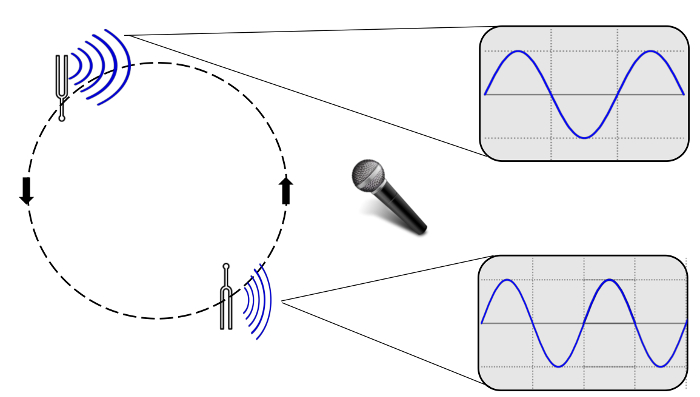
Figure 1: Depiction of a tuning fork's sound waves undergoing the Doppler Effect as captured by an oscilloscope. As the fork swings toward the microphone, the sound waves are emitted at closer distances and create the illusion of a higher pitch. Note: The change in frequency of waves traced on the oscilloscope monitor may be subtle, and the amplitude of the waves will also change relative to the tuning fork's position as sound wave amplitude is proportional to volume (or 'loudness').
Results
Room Temp: 20 °C
Expected velocity: v = 331.4 + 0.6(20) = 343.4 m/s
| Frequency | Initial in-phase Distance | Final in-phase Distance | Wavelength | Calculated Velocity | % Error |
| 5 kHz | 27.4 cm | 34.3 cm | 6.90 cm | 345 m/s | 0.5% |
| 8 kHz | 25.5 cm | 29.75 cm | 4.25 cm | 340 m/s | 1.0% |
| 3 kHz | 22.8 cm | 34.2 cm | 11.40 cm | 342 m/s | 0.4% |
Using Equation 2, the speed of sound can be calculated to a fairly accurate value. For example, for the first frequency, f = 5 kHz = 5,000 Hz and λ = 6.90 cm = 0.069 m, so velocity = λf = 5,000 x 0.069 = 345 m/s. To determine the error between the expected velocity and the observed velocity, we employ the following:
The Doppler effect will be evident by the swinging of the tuning fork, or any other sound emitting object. As the tuning fork swings towards the microphone, the sound waves get bunched together producing a higher frequency, as evident by the bunching of sound waves on the oscilloscope. As the fork swings away, the waves become more spread out and so do the waves on the oscilloscope.
Application and Summary
In this experiment, the wave properties of sound are defined and explored. Specifically, the relationship between sound wave frequency, wavelength, and speed were confirmed. Tuning forks are designed to emit only one frequency, making them optimal devices to demonstrate the Doppler effect. As the tuning fork moves closer and further from the observer, the frequency appears higher and lower pitched, respectively. Both the Doppler effect and Equation 2 can be extended to other waves forms, such as light.
As humans, we use sound waves to communicate every day. However, one of these forms of communication truly represents how our species first harnessed the physics of sound: music, particularly instruments that require breath. Open-end air column instruments, like the trumpet, tuba, or flute, consist of an air column enclosed inside of a hollow tube that is sometimes curved. As air is pushed into the instrument, a vibration occurs inside that causes the pressure waves to reflect off the insides of the tube. However, only pressure waves of certain wavelengths and frequencies with reflect in such a way that they begin to interfere with the incident waves thus creating standing pressure waves. Each musical instrument has a set of natural frequencies at which it vibrates, or resonates. These are called the harmonics and each harmonic is associated with a specific standing wave pattern defined by its endpoints, wavelength, and frequency. In a flute, holes can be opened along the flute to reduce the effective length of the boundaries, therefore reducing the wavelength and increasing the frequency. In a trumpet, valves make the air travel through different parts of the trumpet that are different sizes, resulting again in changes in wavelength and frequency.
A notable application of the Doppler effect is the Doppler radar, used by meteorologists to read weather events. Typically, a transmitter emits radio waves at a specific frequency towards the sky from a weather station. The radio waves bounce off of clouds and precipitation and then travel back to the weather station. The frequency of the waves reflected back to the station appear to decrease if the clouds or precipitation are moving away from the station, whereas the radio frequency appears to increase if the atmospheric objects are moving towards the station. This technology can also be applied to determine wind speeds and direction.
The Doppler effect also has applications in medical physics. In a Doppler echocardiogram, sound waves of a certain frequency are channeled into the heart and reflect off of blood cells moving through the heart and blood vessels. Similar to the Doppler radar, cardiologists can understand the speed and direction of blood flow in the heart due to the shift in frequencies received after reflection. This can help them identify areas of obstruction in the heart.
Skip to...
Videos from this collection:

Now Playing
Sound Waves and Doppler Shift
Physics II
23.4K Views

Electric Fields
Physics II
77.5K Views

Electric Potential
Physics II
104.5K Views

Magnetic Fields
Physics II
33.4K Views

Electric Charge in a Magnetic Field
Physics II
33.7K Views

Investigation Ohm's Law for Ohmic and Nonohmic Conductors
Physics II
26.2K Views

Series and Parallel Resistors
Physics II
33.1K Views

Capacitance
Physics II
43.7K Views

Inductance
Physics II
21.5K Views

RC/RL/LC Circuits
Physics II
142.8K Views

Semiconductors
Physics II
29.8K Views

Photoelectric Effect
Physics II
32.7K Views

Reflection and Refraction
Physics II
36.0K Views

Interference and Diffraction
Physics II
91.0K Views

Standing Waves
Physics II
49.8K Views
Copyright © 2025 MyJoVE Corporation. All rights reserved