Using GIS to Investigate Urban Forestry
Overview
Source: Laboratories of Margaret Workman and Kimberly Frye - Depaul University
Urban forests broadly include urban parks, street trees, landscaped boulevards, public gardens, river and coastal promenades, greenways, river corridors, wetlands, nature preserves, natural areas, shelterbelts of trees, and working trees at industrial brownfield sites. The history of urban trees begins with trees as landscape embellishment. Today, urban trees are seen as essential components of city infrastructure and critical to human life as food, housing, and other public utilities. Urban trees are now valued for the ecosystem services they provide (e.g., preventing erosion, air pollutant removal, oxygen, shade, etc.). Yet, to efficiently make use of these benefits, trees must reach maturity, as leaf number and size directly affect a tree’s ability to provide ecosystem services. Urban forestry has had to develop its own forestry methods to address the needs and challenges unique to urban trees as compared to their woodland counterparts.
The following excerpt from the USDA Forest Service illustrates the urban tree perspective and policies of federal government:
Urban forests are dynamic ecosystems that provide needed environmental services by cleaning air and water, helping to control storm water, and conserving energy. They add form, structure, beauty and breathing room to urban design, reduce noise, separate incompatible uses, provide places to recreate, strengthen social cohesion, leverage community revitalization, and add economic value to our communities... This natural life support system sustains clean air and water, biodiversity, habitat, nesting and travel corridors for wildlife, and connects people to nature.
The management of urban trees is an interdisciplinary practice involving architecture, landscaping, planning, development, horticulture, etc. One particular discipline involved in forestry is geography, especially through the use of geographical information systems (GIS). GIS is a broad name encompassing any type of database containing geographical or spatial data that can be used to create computer-generated visual representations (e.g., maps). GIS allows for extensive data collection and management through ever-improving user interfaces, increasing the user-friendly quality of very large sets of information that can be accessed by many users. GIS applications range from free software and open access protocols, such as Google Earth, to proprietary systems, like ESRI ArcGIS. Using GIS to create and store geographical information also allows for easy data maintenance, because maps can be quickly updated by adding new information to the database and regenerating the visual output.
Principles
An urban forest tree survey is conducted using parkway trees planted between sidewalks and curbs. Data is collected by city block, recording species, health condition, location, land use, and diameter at breast height (dbh) for each tree surveyed.
Tree condition is observational and based on visual assessments of six categories: trunk condition (missing bark and decay), growth rate (twig elongation and length of current year’s growth), structure (dead limbs), insects and disease, crown development (balanced appearance of branches, leaves, and reproductive structures), and life expectancy. Each category has a rating system based on the amount of unhealthy tree features summed together for an overall condition score, which corresponds to a categorical measurement of excellent, very good, good, fair, poor, and very poor.
Location is recorded by postal address and by using geodesic coordinates for longitude and latitude. A GPS receiver is used to determine geodesic locations based on satellite data transmitted to the receiver at each tree’s location.
To quantify the benefits of the urban forest around them, data is entered into a National Tree Benefits Calculator (easily found online and free to use) to determine the dollar value of annual environmental and aesthetic benefits: energy conservation, air quality improvement, CO2 reduction, storm water control, and property value of each tree.
Data is also entered into a Geographical Information System (GIS) for spatial and geospatial statistical analysis of surveyed tree characteristics.
Procedure
1. Data Collection with GPS Receiver and dbh Tape
- In an open outdoor location, turn on the GPS receiver by pressing the power button. Wait 2-3 min while receiver connects to a minimum of three satellites.
- Walk to the survey area for data collection. Survey one city block segment at a time and number the parkway trees on a data sheet (Figure 1), resetting the numbering at the start of each block segment.
- At each tree in the survey, record species, postal address (e.g., 1253 W. Lill), and geodesic coordinates (longitude/latitude) provided by the GPS receiver (Figure 1). Ensure geodesic coordinates are collected from the same direction at each tree (e.g., north side of each tree).
- Measure the diameter of each tree at 4½ ft above the ground and record the diameter at breast height (dbh).
- Observe each tree condition by visually estimating and scoring according to the criteria (Table 1). Sum the points for one overall score for each tree and assign each tree to the corresponding health categories. Record health condition on the data sheet.
2. Entering Data into a GIS
- GIS using Google Earth: Type in the tree coordinates and save them in the “My Places” folder using the “Add Placemark” feature. Name each tree by species name. Once all tree data points are saved as placemarks, right-click on the My Places name, select “Save As,” and save to any location.
- GIS using ESRI ArcGIS 10.2: To import into ArcGIS, ensure all column headings have no spaces; any spaces should be replaced with underscores. If the coordinates are in latitude/longitude, they should be in decimal degrees (DD) format before importing into ArcGIS. Locations in degrees, minutes and seconds (DMS) or decimal minutes (DM) format should be converted to DD first. There are converters available on the internet (http://www.fcc.gov/encyclopedia/degrees-minutes-seconds-tofrom-decimal-degrees).
- Save/export the data as a comma-delimited text file (CSV format).
- Create a “layer” by adding the .csv file to ArcMap by using the Add data tool, either by expanding the submenu under File> Add Data or by clicking the Add Data tool on the Standard toolbar (Figure 2).
- Right-click on the new layer and choose Display XY Data. Ensure that the X and Y fields were selected correctly by ArcMap – they should be right if the names chosen reflect the coordinate positions (northing and easting or x and y).
- Click the Edit… button, then Select… to select the coordinate system for the points, Add… and OK (3x). The correct coordinate system to use may be obtained from the GPS unit (under map setup or units). For this data, select Coordinate Systems > Geographic Coordinate Systems > World > WGS1984.prj (default GPS datum).
- There should now be a point layer at the top of the Table of Contents with the same name as the .csv file and the word Events on the end of the name (Figure 3). This is an “event theme” and is a temporary layer. For a more permanent copy, right-click on the layer and choose Data > Export Data… Pick an output location — a geodatabase feature class or a directory for a shapefile — and enter a file name. Change the name from the default “Export_Output” to Urban_Forestry_Survey. Click OK.
3. National Tree Benefits Calculator
- Using this software, the benefits of street-side trees can be calculated. This includes a tree’s annual benefits for storm water management, property value, energy efficiency, and carbon sequestration. See the video Tree Identification: How to Use a Dichotomous Key for instructions on using the Tree Benefits Calculator.

Figure 1. Representative results for street trees found one block.
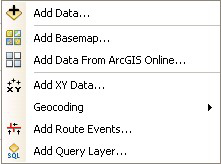
Figure 2. The Add Data tool on the Standard toolbar.
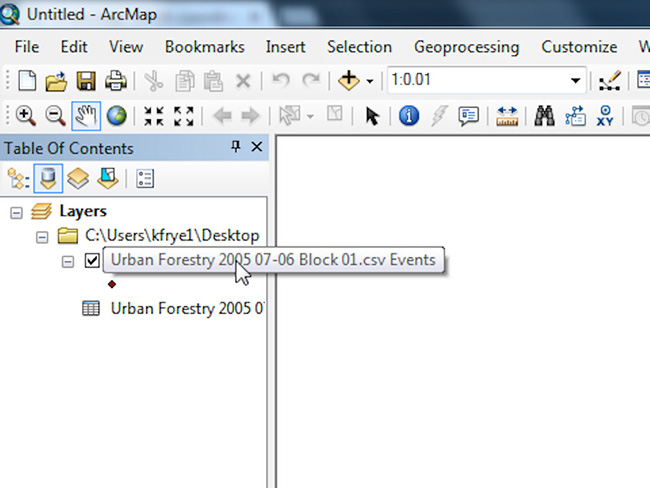
Figure 3. Point layer at the top of the Table of Contents with the same name as the CSV file.
| Trunk Condition Sound and solid Sections of bark missing Extensive decay & hollow |
Condition Score 5 3 1 |
||
| Growth Rate (consider species) More than 6" twig elongation 2-6" twig elongation Less than 2" twig elongation |
3 2 1 |
||
| Structure Sound One major/several minor limbs dead, broken, missing 2 or more major limbs dead, broken, missing |
5 3 1 |
||
| Insect & Disease No pests present 1 pest present 2 or more pests present |
3 2 1 |
||
| Crown Development Full & Balanced Full but unbalanced Unbalanced and lacking a full crown |
5 3 1 |
||
| Life Expectancy Over 30 years 15-20 years Less than 5 |
5 3 1 |
||
| Condition Class: Excellent: 26-23 Good: 22-19 Fair: 18-14 Poor: 13-10 Very Poor: 9-6 |
Table 1. A table to calculate the condition class of a tree. Each condition score correlates with its description in each category, then all six scores are totaled for a final sum – the condition class.
Results
Figure 1 shows the representative results for street trees found on one block, and a map from urban forestry data entered into GIS can be seen in Figure 4.
The results for using the Tree Benefit Calculator can be found in Table 2. This calculator provides an estimation of the benefits individual street-side trees provide. Once the data from the field investigation is inputted, including zip code, species, diameter, and land-use, the environmental and economic benefit provided by each tree can be seen.

Figure 4. Maps from urban forestry data entered into GIS.
| Tree Sample Number | Overall Benefit | Storm Water Management (gallons) |
Property Value | Energy Efficiency (kW/hr) |
Carbon Sequestration (lbs) |
| 1 | $20 | 173 | $4 | 38 | 109 |
| 2 | $24 | 217 | $8 | 41 | 133 |
| 3 | $22 | 161 | $11 | 27 | 113 |
| 4 | $11 | 69 | $2 | 22 | 74 |
| 5 | $46 | 356 | $22 | 56 | 169 |
Table 2. The Tree Benefit Calculator results.
Application and Summary
Once entered into a GIS, forestry data can be analyzed using geospatial statistics. For example, a Moran’s I geospatial statistical test is a widely used statistic that analyzes for significant geographical clustering of health variables. Moran’s I can be used for forestry data to report dbh values localized to particular areas, indicating different tree growth rates in different locations of the forest. If clustering is significant, a General G geospatial statistical test can additionally reveal whether it is the high or low values that are geographically clustered by reporting which end of the clustering values are concentrated in a geographical area (Figure 5). Significant Moran's I clusters are shown with the General G scores, indicating high dbh values clustered for the good trees and for each species. dbh values are represented by proportionally-sized symbols to illustrate the clustering of high values (large circles) and low values (small diamonds) (Figure 6). Features can be paired in maps to look for meaningful patterns, such as dbh and species, to identify which species tend to grow to maturity more successfully in an urban environment. Clusters of high dbh values indicate older trees that may present near future needs for tree removal or a higher risk area for tree damage caused by storms. High dbh clusters may also indicate areas where trees survive longer and regions of a city receiving higher ecosystem service benefits.

Figure 5. Clusters of dbh sizes for good trees on a map.

Figure 6. High dbh clusters identified on a map.
Skip to...
Videos from this collection:

Now Playing
Using GIS to Investigate Urban Forestry
Environmental Science
12.6K Views

Tree Identification: How To Use a Dichotomous Key
Environmental Science
81.2K Views

Tree Survey: Point-Centered Quarter Sampling Method
Environmental Science
49.4K Views

Proton Exchange Membrane Fuel Cells
Environmental Science
22.1K Views

Biofuels: Producing Ethanol from Cellulosic Material
Environmental Science
53.1K Views

Testing For Genetically Modified Foods
Environmental Science
89.7K Views

Turbidity and Total Solids in Surface Water
Environmental Science
35.8K Views

Dissolved Oxygen in Surface Water
Environmental Science
55.7K Views

Nutrients in Aquatic Ecosystems
Environmental Science
38.8K Views

Measuring Tropospheric Ozone
Environmental Science
26.4K Views

Determination Of NOx in Automobile Exhaust Using UV-VIS Spectroscopy
Environmental Science
30.1K Views

Lead Analysis of Soil Using Atomic Absorption Spectroscopy
Environmental Science
125.4K Views

Carbon and Nitrogen Analysis of Environmental Samples
Environmental Science
29.4K Views

Soil Nutrient Analysis: Nitrogen, Phosphorus, and Potassium
Environmental Science
215.8K Views

Analysis of Earthworm Populations in Soil
Environmental Science
16.5K Views
Copyright © 2025 MyJoVE Corporation. All rights reserved