Method Article
Retrospective Cardiac Gating with A Prototype Small-Animal X-ray Computed Tomograph
In This Article
Summary
We provide a comprehensive description of the intrinsic retrospective cardiac gating method of the CrumpCAT, a prototype small-animal X-ray computed tomography (CT) scanner designed and constructed at our research institution.
Abstract
The CrumpCAT is a prototype small-animal X-ray computed tomography (CT) scanner developed at our research institution. The CMOS detector with a maximum frame rate of 29 Hz and similar Tungsten X-ray sources with energies ranging from 50 kVp to 80 kVp are widely used across commercially available preclinical X-ray CT instruments. This makes the described work highly relevant to other institutions, despite the generally perceived wisdom that these detectors are not suitable for gating the high heart rates of mice (~600 beats/min). The scanner features medium- (200 µm) and high- (125 µm) resolution imaging, fluoroscopy, retrospective respiratory gating, and retrospective cardiac gating, with iterative or filtered-back projection image reconstruction. Among these features, cardiac gating is the most useful feature for studying cardiac functions in vivo, as it effectively eliminates image blurring caused by respiratory and cardiac motion.
Here, we describe our method for preclinical intrinsic retrospective cardiac-gated CT imaging, aimed at advancing research on in vivo cardiac function and structure analysis. The cardiac-gating method acquires a large number of projections at the shortest practical exposure time (~20 ms) and then retrospectively extracts respiratory and cardiac signals from temporal changes in raw projection sequences. These signals are used to reject projections belonging to the high motion rate inspiration phase of the respiratory cycle and to divide the remaining projections into 12 groups, each corresponding to one phase of the cardiac cycle. Each group is reconstructed independently using an iterative method to produce a volumetric image for each cardiac phase, resulting in a four-dimensional (4D) dataset.
These phase images can be analyzed either collectively or individually, allowing for detailed assessment of cardiac function. We demonstrated the effectiveness of both approaches of the prototype scanner's cardiac-gating feature through representative in vivo imaging results.
Introduction
Small-animal research often employs a combination of non-invasive imaging modalities, with X-ray computed tomography (CT), being a prominent choice due to its maturity, cost-effectiveness, speed1,2, and ability to provide complementary information alongside other modalities such as positron emission tomography (PET)2,3 and single-photon emission computed tomography (SPECT)2,4. However, like other imaging techniques, CT is susceptible to physiological motion artifacts caused by the beating heart or respiration, which introduce blurring and limit the accuracy of the research.
To address this limitation, respiratory and cardiac motion blurring can be mitigated through a technique known as gating5,6,7,8, where data acquisition is synchronized with specific phases of the cardiac or respiratory cycle (or gates). One approach to achieve this, known as prospective gating3,6, involves attaching sensors to the animal to provide real-time gating signals to a compatible scanner. While effective, this method is labor-intensive and time-consuming, particularly when attaching sensors to the chest and the paws of small animals like mice, thereby limiting the scale of studies. Alternatively, intrinsic retrospective gating7,9,10,11 involves acquiring time series data without the use of sensors but by identifying features in the data that allow retrospective sorting of the results based on their phase in the cardiac or respiratory cycle. This approach offers results comparable to prospective gating but without the need for additional hardware or the effort involved in pulse sensor attachment and, therefore, greatly simplifies experimental protocols.
In our method for preclinical cardiac CT imaging, we utilize intrinsic retrospective gating to extract respiratory and cardiac cycles from amplitude variations in regions in X-ray projections that exhibit the most significant changes between successive frames. To facilitate this process, a mouse thorax template is co-registered onto the first posteroanterior projection using Mutual Information12. Once the template is in place, pixel intensities in a window near the diaphragm are summed to generate a surrogate respiratory signal, while those near the myocardium are summed to derive the surrogate cardiac signal. These signals are then band-pass filtered in the time domain, and each frame in the dataset is assigned a fractional phase number (between 0 and 1) based on its respiratory and cardiac phase. This allows for the selection or rejection of projections according to their phase values. Typically, frames corresponding to the end-expiration phase of the respiratory cycle (0.15 ≤ phase < 0.85) are retained, while those from the inspiration phase, where motion is most pronounced, are discarded. The remaining frames are grouped into 12 cardiac phases, each representing 1/12 (0.083) of the cardiac cycle and are reconstructed into 3D images using an iterative method (Ordered Subset Expectation Maximization [OSEM])13,14. The whole process is summarized in Figure 1.
Protocol
Animal experimental protocols were reviewed and approved by the Institutional Animal Care and Use Committee of the University of California, Los Angeles (UCLA). C57BL/6J mice (8 weeks old, male, 24-26 g) were used in this protocol. The CT scanner used in this study is the CrumpCAT (Figure 2), a prototype developed at our research institution for preclinical research, providing us with the control and flexibility needed to optimize acquisition and reconstruction protocols. The method assumes that anesthetized mice will have a heart rate no greater than 600 beats/min and a respiration rate between 20 and 180 breaths/min15.
1. Equipment settings
- Operate the X-ray source at a peak voltage of 50 kVp with 200 µA continuous current.
- Set the X-ray camera pixel binning to 2 and the exposure time to its shortest practical value (20 ms exposure time plus 14 ms read time for a total sampling time of 34 ms).
NOTE: The no-binning option (binning 1) has a slower frame rate and, therefore, cannot be used for gated acquisitions. The maximum frame rate is around 30 frames/s.
2. Animal preparation
- Anesthetize mice with a mixture of oxygen and isoflurane gas at 2.0% concentration. Apply sterile lubricant to eyes to prevent corneal drying and ulceration.
- Keep the animals under anesthesia for 10 min before CT imaging, to ensure that vital signs are stable and that animals are relaxed to avoid any body motion during the scan. Judge a mouse's anesthesia depth by the lack of the toe pinch reflex when firmly pinching the webbing between the toes with a fingernail.
- For the cardiac-gated imaging to visualize heart chambers, intravenously inject 100 µL of CT contrast agent through the tail vein immediately before CT imaging (Figure 3A).
- Place the anesthetized mouse inside the CT imaging chamber (Figure 3B).
3. Data acquisition
- Turn on the CrumpCAT software.
- Non-gated CT imaging with high resolution (125 µm, binning 1) (Figure 4A)
- Enter a Study ID on the user interface.
- Select Mouse Hi-Res in the Protocol dropdown menu.
- Click the Scan button on the user interface to acquire 720 projections with an exposure time of 80 ms/projection.
- Non-gated CT imaging with medium resolution (200 µm, binning 2) (Figure 4B)
- Enter a Study ID on the user interface.
- Select Mouse Standard in the Protocol dropdown menu.
- Click the Scan button on the user interface to acquire 720 projections with an exposure time of 100 ms/projection.
- Gated CT imaging (200 µm, binning 2) (Figure 4C)
- Enter a Study ID on the user interface.
- Select Cardiac Gating in the Protocol dropdown menu.
- Click the Scan button on the user interface, and acquire 21,600 projections with an exposure time of 20 ms/projection.
4. Data preprocessing
NOTE: Preprocessing steps are required only for gated acquisitions. All these steps are performed automatically by the reconstruction software and no operator intervention is required.
- Signal extraction
- For thorax template co-registration, let a small image (template) coarsely representing a mouse thorax with the ribs, the heart, the lungs, and the liver be automatically co-registered onto the first X-ray projection, by maximizing the Mutual Information12 between the projection and template (Figure 5).
NOTE: Only translation operations are performed on the template and the co-registered template is used to identify regions of interest (ROIs) on all projections. - For respiratory signal extraction, allow a rectangular ROI (ROI-1) to be designated in the template to represent the diaphragm and the respiratory signal to be generated by summing the pixel intensities inside ROI-1 for each projection (Figure 5) .
- For cardiac signal extraction, let a second rectangle ROI (ROI-2) be designated in the template near the heart, and the cardiac signal generated by summing the pixel intensities in ROI-2 for each projection (Figure 5).
NOTE: The thorax template is co-registered only on the first projection to identify which image rows and columns (window) should be used for signal extraction. That window is wide enough to encompass all projections as long as the animal is reasonably centered, as is the case when using our animal bed16.
- For thorax template co-registration, let a small image (template) coarsely representing a mouse thorax with the ribs, the heart, the lungs, and the liver be automatically co-registered onto the first X-ray projection, by maximizing the Mutual Information12 between the projection and template (Figure 5).
- Band-pass filter
- Allow a band-pass filter to be generated by combining two Sinc functions with different cutoff frequencies in the temporal domain17, which correspond to low-pass filters in the frequency domain as described below.
- Let the software apply the band-pass filter on the cardiac signal using a frequency band of [300, 600] min-1 (Figure 6A).
NOTE: The unfiltered cardiac signal (Figure 6B) still contains a significant contribution from the respiratory motion. - Similarly, let the respiratory signal be filtered using a frequency band of [20, 300] min-1. The higher harmonics are preserved to produce a signal that is not simply sinusoidal and more clearly identifies the two main phases: inspiration and expiration.
NOTE: At this point, both respiratory and cardiac signals can easily be interpolated and considered continuous functions of time for the purpose of calculating the fractional phase number.
- Phase assignment
- Let the software identify the beginning of each cycle (respiratory or cardiac) by finding the zero-crossings of the signal's first derivative. Each zero-crossing corresponds to a maximum in the signal and marks the beginning of a new cycle and the end of the previous one. For an example, see the respiratory signal in Figure 7.
- Allow a fractional phase value (between 0 and 1) to be assigned to each projection for each of the two signals (respiratory or cardiac).
NOTE: By definition, the beginning point has a fractional phase value of zero (for the current cycle) or one (for the previous cycle).
- Selection masks
- Let 12 binary masks (one per cardiac phase) be created to select projections belonging to each phase. Each mask contains 21,600 entries (one per projection) that are either a 0 or a 1, meaning reject or keep that projection, respectively.
- For each mask (phase), observe that the software indicates whether a projection is kept (1) or discarded (0) according to its fractional phase number. For phase 0, projections with a cardiac phase value in the interval [0, 1/12] are kept. For phase 1, cardiac phase values in the interval [1/12, 2/12] are kept, and so on.
- For each mask (phase), note that any projections with a respiratory phase less than 0.15 or greater than 0.85 are rejected (0 in mask) because they belong to the inspiration phase, which has the largest motion (Figure 8A). Figure 8B shows the cardiac phase assignment to projections for the first 2 s.
NOTE: No significant bias was introduced with this selection process since the number of projections per phase was relatively constant at 1,800 ± 194.
5. Image reconstruction
- For non-gated CT scans, reconstruct images at medium (200 µm) or high (125 µm) resolution using the Filtered back-projection (Feldkamp18) algorithm with a Shepp-Logan filter.
- For cardiac-gated CT scans, reconstruct each cardiac phase image using the iterative OSEM algorithm13, with 12 subsets and 8 iterations, only taking into account selected projections contributing to a given phase (as indicated in a phase selection binary mask).
- To reduce noise, apply a post reconstruction median filter in the temporal dimension (i.e., across images) and a light 3D-Gaussian filter in the spatial dimension (σ = 38 µm).
NOTE: For respiratory-gated image reconstruction, use all cardiac phases indistinctly. Beam-hardening correction (water correction) is applied to every reconstruction.
6. Image assessment and left ventricle (LV) volume quantification
- Open the CT image in a DICOM viewer such as Amide19 (Figure 9A).
- Enhance the visible image contrast by setting the CT-value (measured in Hounsfield Unit [HU]) range as [-500, 500] (Figure 9A).
- Image quality assessment
- Draw an ROI for the calcified region, which is defined as the region around the maximum with a CT-value greater or equal to 85% of the maximum HU value (Figure 9B).
- Use contrast-to-noise ratio (CNR)20,21 as a metric to assess image quality and its capacity to identify small structures, such as small calcifications:
 ,
,
where I and σ represent the mean intensity and standard deviation of a region: calcification (subscript C) or background (subscript B).
- Left ventricle volume quantification
- Draw a 3D-Freehand ROI to identify the LV in each phase (Figure 10A).
- Quantify the LV volume by calculating voxels with a threshold CT-value of 730 HU (Figure 10B). A plot of LV volumes is shown in Figure 10C.
NOTE: The CT-value threshold is not absolute; it depends on the contrast agent used, animal size, strain, health condition, and the time between injection and CT imaging. Amide is a freely distributed software developed at our institute, but other more sophisticated image viewers are available (e.g., ORS Dragonfly22).
Results
We first compared non-gated and gated CT images for visualizing cardiac calcification in mice (male, 30-32 g). The murine model of cardiac calcification was created by inducing cardiac injury by rapid freeze-thaw of cardiac tissue (cryo-injury), as described previously23. With the non-gated CT imaging protocols, cardiac calcifications were more clearly identified on the high-resolution (125 µm, binning 1) image (Figure 11A). The CNR was 3.2 ± 0.3 and 4.0 ± 0.2 on the medium (200 µm, binning 2)- and high (125 µm, binning 1)-resolution images, respectively. On gated images (Figure 11B), the CNR was 4.2 ± 0.1 (respiratory-gated only) and 5.2 ± 0.4 (respiratory- and cardiac-gated). Respiratory gating, therefore, provided only 5% improvement over high-resolution images (CNR 4.2 vs 4.0). In contrast, cardiac gating offered 30% improvement (5.2 vs 4.0).
We then used our retrospective cardiac-gated CT imaging method to visualize and quantify the LV volume during a cardiac cycle in C57BL/6J mice. To better reveal the change in the LV volume during a cardiac cycle, a loop as a short video can be found in Supplemental Video S1. During the cardiac cycle, the LV volume at the end of systole was on average 14 ± 4 mm3, while at the end of diastole, it was on average 33 ± 7 mm3. The calculated ejection fractions were on average 60 ± 4%. We show in Figure 10C the LV volume plot for three mice. In addition, our retrospective cardiac-gated CT imaging method is useful for non-invasive monitoring of post-infarct cardiac dysfunction in murine models of acute ischemic cardiac injury24.
In addition, the animals had a heart rate varying from 315 to 425 beats/min and a respiration rate of 25 to 50 breaths/min. Excerpts from respiratory and cardiac signals extracted from raw projections are shown in Figure 12. The raw cardiac signal has a smaller amplitude than the respiratory signal and contains some of the respiratory signal, which is removed later by a bandpass filter. Supplemental Video S1 shows the beating heart and provides a qualitative appreciation of the heart condition.

Figure 1: Cardiac gating graphical summary. Abbreviations: LV = left ventricle; ROI = region of interest. Please click here to view a larger version of this figure.

Figure 2: View of the CrumpCAT and its main components. Abbreviation: CMOS = complementary metal oxide semiconductor. Please click here to view a larger version of this figure.
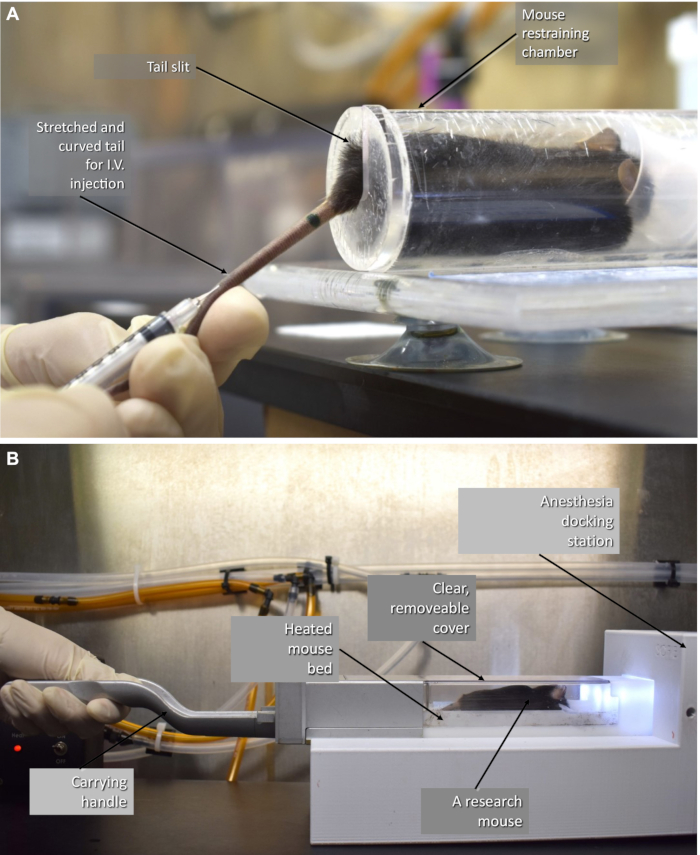
Figure 3: Animal preparation. (A) The mouse is being injected with the contrast agent, and (B) the 37 °C heated mouse chamber used to scan animals16. Please click here to view a larger version of this figure.
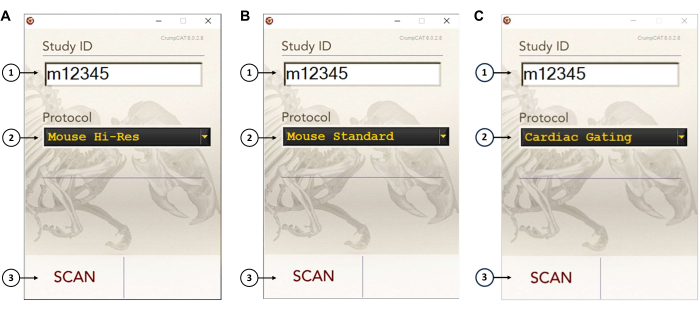
Figure 4: CrumpCAT software user interface. (A) User interface settings for a non-gated CT imaging with high resolution (125 µm, binning 1). (B) User interface settings for a non-gated CT imaging with medium resolution (200 µm, binning 2). (C) User interface settings for a gated CT imaging (200 µm, binning 2). To operate the scanner, the user needs to: (1) input a study number, (2) select the CT imaging protocol, and (3) hit the Scan button. Please click here to view a larger version of this figure.

Figure 5: The thorax template (heart, rib cage, liver) used to locate the windows to extract respiratory and cardiac signals. Abbreviation: ROI = region of interest. Please click here to view a larger version of this figure.
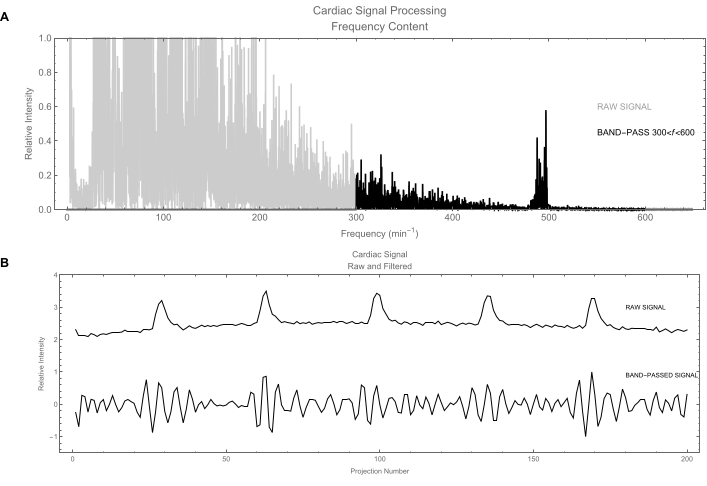
Figure 6: Cardiac signal. (A) Signal processing in the frequency domain. The gray trace shows the frequency contents of the raw cardiac signal obtained by calculating its power spectrum. The frequencies of interest are around 500/min. The black trace shows the signal after applying a band-pass filter to keep only frequencies between 300 and 600 beats/min. (B) Top: Plot of the raw cardiac signal in the time domain. This signal is dominated by respiratory motion (large fluctuations); actual cardiac signal is the weak wiggle. Bottom: Filtered version of the cardiac signal: the respiratory signal has been removed leaving a clean cardiac signal. Please click here to view a larger version of this figure.
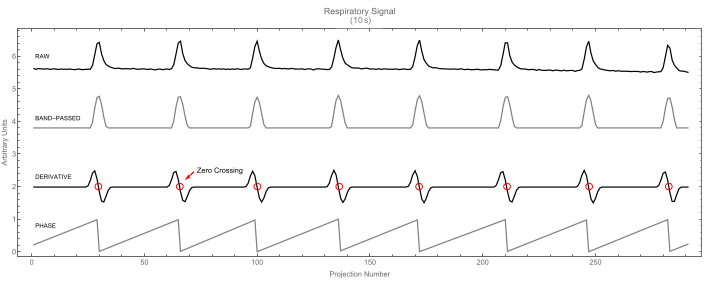
Figure 7: Respiratory signal. Raw respiratory signal (top) and its band-passed version (second). The derivative signal (third) is shown with zero-crossings highlighted. These identify the peaks in the respiratory signal. In turn, these peaks mark the beginning of the cycle (phase value 0), as shown in the fourth trace. Please click here to view a larger version of this figure.
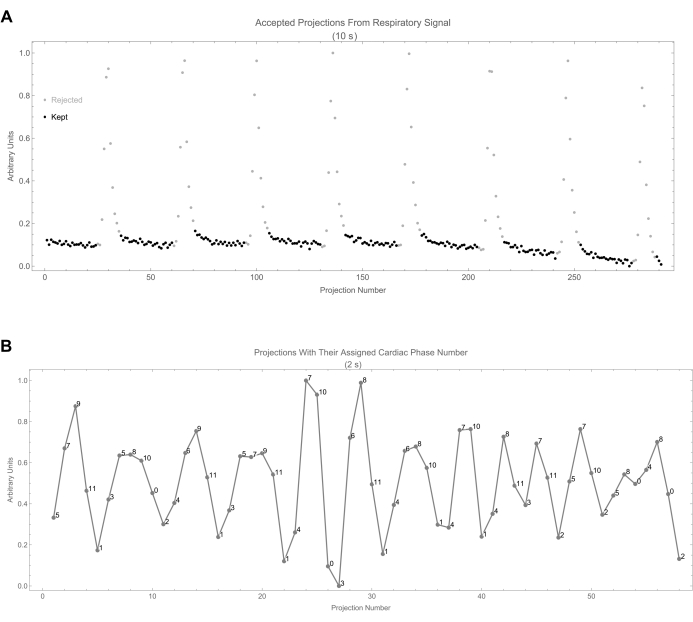
Figure 8: Projection selection. (A) This shows the respiratory signal as a function of projection number. Accepted projections are identified by black dots. (B) This shows the cardiac signal along with the assigned cardiac phase number of each projection. The phase number is calculated from the time difference between the projection and the beginning of the most recent cycle. Please click here to view a larger version of this figure.

Figure 9: Calcifications. (A) The image file as displayed with Amide with a gray scale and with window levels of CT-values [-500, 500] HU. (B) Calcification identification process: transverse, coronal, and sagittal views of non-gated images. Please click here to view a larger version of this figure.
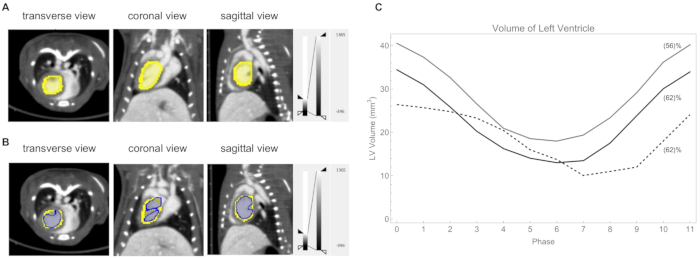
Figure 10: Left ventricle analysis. (A) The left ventricle delineated manually (yellow). Heart rate: 418 beats/min, respiration rate 39 breaths/min. (B) The left ventricle thresholded at a CT value of 730 HU (blue). (C) Plot of the volume of the left ventricle at each phase of the cycle for three mice. The calculated ejection fraction is shown in parentheses. The heart rate/respiration rate for those three mice were: gray line 362 beats/min and 53 breaths/min; black line 420 beats/min and 59 breaths/min; dashed line 315 beats/min and 45 breaths/min. Please click here to view a larger version of this figure.

Figure 11: A comparison of the contrast-to-noise ratio. (A) Non-gated images, and (B) gated images (heart rate: 408 beats/min, respiration rate: 49 breaths/min). Abbreviations: CNR = contrast-to-noise ratio; R-gated = respiratory-gated; C-gated = cardiac-gated. Please click here to view a larger version of this figure.
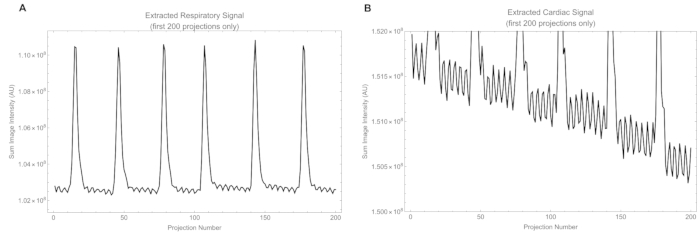
Figure 12: Excerpts of signals. (A) The raw respiratory signal extracted from intensity in the respiratory window, and (B) the raw cardiac signal extracted from intensity in the cardiac window. Please click here to view a larger version of this figure.
Supplemental Video S1: A cardiac-gated CT cine loop revealing the change in the LV volume during a cardiac cycle in a mouse. Heart rate: 418 beats/min, respiration rate: 39 breaths/min. Please click here to download this Video.
Discussion
The specific hardware implementation described here is a custom-made X-ray CT system unique to our institute, but the specific detector is widely used across commercially available preclinical X-ray CT instruments, making the described work relevant to other institutions. This system is functionally the prototype for two commercially available and widely used in vivo X-ray microCT subsystems embedded
in preclinical PET/CT scanners. These microCT scanners share the detector architecture and performance (pixel size, sensitivity, DQE, frame rate, etc). The same detector is also used in preclinical PET/CT and SPECT/CT systems by several other commercial manufacturers of in vivo preclinical systems. Therefore, the detector performance is shared between a significant portion of the commercially available and installed preclinical PET/CT and SPECT/CT instruments worldwide. As such, if programmed properly, all these systems can reach the same frame rates, which is the critical parameter that enables the described work. While most users do not have access to the raw data for commercially procured microCT systems, the work described here could be used as a template for users and vendors of in vivo preclinical instruments, to demonstrate what is possible with the limited hardware already included in these instruments.
In addition to the detector, Tungsten (W) X-ray sources are also used by virtually all commercially available preclinical PET/CT systems, with similar Aluminum filtration, and X-rays with energies ranging between 50-80 kVp. The term kVp is used to describe the spectrum of X-rays produced by a nominal tube voltage as the peak Voltage potential provided by the power supply. This leaves the most important parameter differing between all these systems to be the source power. In this work, the power of the source (10 W) is at the low end of similar W sources used for in vivo preclinical imaging. Therefore, more powerful sources should perform at least as well as in the described work and with lower noise, or shorter acquisition times at the expense of elevated radiation dose.
There are very few papers that explore gating in mouse models, as the conventional wisdom is that the mouse heart rate (~600 beats/min or ~10 Hz) is too high for the available hardware. This heart rate is for conscious mice either at rest or at full exercise, since mice primarily change their ejection fraction and maintain the heart rate. Under anesthesia, the heart rate is lower (300-500 beats/min). The detector frame rate of 29 Hz can fully reproduce the extent and range of the periodic heart motion at any of these rates. The underlying assumption is that we need to satisfy the Nyquist criterion for the cyclical heart motion for which a frame rate of only ~20 Hz would be necessary at 600 beats/min (10 Hz). The particular OEM detector we used here is also used by at least four independent manufacturers of preclinical PET/CT instruments and, therefore, this work is indeed possible with all these instruments.
The blood recirculation time in mice is a few seconds, and typically, a time of 2-3 min is required between the injection of a contrast agent and the actual scan start time, due to animal positioning overhead, as well as due to X-ray and rotating gantry hardware configuration/initialization. The important aspect is that the user needs to make sure to not delay the initiation of the scan, as acquiring the 21,000 projections takes about 10 additional min.
The duration of a single cardiac phase in our study ranged from 12 to 15 ms. Given our exposure time of 20 ms, some crosstalk between phases is inevitable. For example, phase 2 may include 5 to 8 ms (split equally) of data from adjacent phases (phases 1 and 3), potentially causing slight blurring during periods of rapid motion, such as diastole. To mitigate this, it is important to ensure that the mouse is properly anesthetized, achieving a heart rate under 600 beats/min (10 Hz). In addition, proper anesthesia would minimize relaxation motion during the relatively long scan time. The radiation doses to the animal, for gated versus non-gated scans, were ~450 and 50 mGy, respectively.
Since this data acquisition process is a real-time computer application, it is essential that the acquisition program operates with the highest priority and with minimal concurrent applications running. Failure to implement these precautions could result in image frames being received faster than the computer can handle, leading to an overrun and causing the scan to fail.
The main drawback of the retrospective gating method is that it discards some data, but the data loss is manageable. In practice and with a total of 21,000 projections, the data are significantly oversampled in the angular direction. We validated that there were no large angular gaps in any scan, certainly much smaller than the 0.5° spacing we used for the image reconstruction (720 projections over 360°). For example, with our frame rate of 29 fps, a mouse breathing at a rate of 1/s and a veto of 30% of the frames, we rejected 8.7 frames per breath (i.e., the gap size is 8.7 frames)-8.7/21600 or 0.145° per gap. Incidentally, this is why an iterative reconstruction method was used and not Feldkamp. The secondary potential consequence of discarding data (compared to prospective gating) is that the radiation dose can increase because there is no hardware shutter mechanism to block the X-ray beam during vetoed periods (e.g., during the inspiration phase). For this to be a factor though, such shutter mechanisms need to be fully implemented and active during prospective gating.
Regarding the method of data reconstruction, other methods can be as good or even better than our current approach with OSEM, but the focus of this work is not to obtain the best and lowest noise reconstructions possible. Instead, we want to demonstrate that we can perform cardiac gating with a commonly used detector that has a relatively limited frame rate and a low power X-ray source. We have found that using the OSEM reconstruction method works well within the constraints of our computational hardware and has a good working implementation.
At the same time, our method offers several advantages, including simplicity, as it does not require any special hardware. The main limiting factor for the implementation of our method is the maximum X-ray camera frame rate (29 Hz) and shortest exposure time (20 ms). The camera is in wide use in preclinical X-ray CT instruments of several manufacturers and the proposed method can be used with any scanner that can achieve these parameters, even those not equipped to accept gating signals. Furthermore, X-ray CT systems with less powerful tungsten X-ray sources require longer exposures but do not pose an insurmountable challenge. Additionally, researchers do not need extensive training and practice in attaching sensors to small animals to obtain the respiration and pulse information, or fine-tuning signal triggering for data acquisition, as is necessary with prospective gating.
While calcifications were visible across all imaging protocols in our CrumpCAT CT scanner, their CNR was highest in gated images, even with a lower resolution. This finding suggests that cardiac gating is not only beneficial for studies focused on the dynamic aspects of the beating heart but also advantageous for research involving small calcifications near the heart or other anatomical parts influenced by physiological motion, where enhanced image clarity is critical.
The total reconstruction time is ~30x the usual reconstruction time due to a larger number of projections and having 12 phases. However, the signal processing step adds very little overhead (<1%) to the overall reconstruction time. The reconstruction method itself could be improved by exploiting the fact that data is correlated between the phases. A joint reconstruction (in time) or the use of deep learning methods25 would produce images having less noise and eliminate the need for post-reconstruction median and Gaussian filters.
Disclosures
Dr. Richard Taschereau is a consultant with Sofie Biosciences and Xodus Imaging. Dr. Arion F. Chatziioannou is a founder of Sofie Biosciences.
Acknowledgements
We thank all members of the UCLA Crump Preclinical Imaging Technology Center for their help and support. In particular, we thank Mikayla Tamboline and Isabel Day for preparing the animals for cardiac CT imaging and thank Sophie Shumilov for generating some of the left ventricle ROIs during the study. We also thank Drs. Arjun Deb and Yijie Wang (UCLA) for providing the murine models of acute ischemic cardiac injury for cardiac calcification microCT imaging. This work is supported by NIH Cancer Center Support Grant (2 P30 CA016042-44).
Materials
| Name | Company | Catalog Number | Comments |
| C57BL/6J mice | Jackson Laboratory | 664 | Male, 8 weeks old, 24-26 g |
| Dexela camera | Varex | 1512 | Detector, 20 ms exposure, 74.8/149.6 µm pixel |
| VivoVist | Nanoprobes | 1301-5X0.25ML | CT Contrast agent |
| X-ray source | Moxtek | TUB00082 | 50 kV peak, 200 µA, 1.0 mm-thick Al filter |
References
- Schambach, S. J., Bag, S., Schilling, L., Groden, C., Brockmann, M. A. Application of micro-CT in small animal imaging. Methods. 50 (1), 2-13 (2010).
- Koba, W., Jelicks, L. A., Fine, E. J. MicroPET/SPECT/CT imaging of small animal models of disease. Am J Pathol. 182 (2), 319-324 (2013).
- Hutchins, G. D., Miller, M. A., Soon, V. C., Receveur, T. Small animal PET imaging. ILAR J. 49 (1), 54-65 (2008).
- Franc, B. L., Acton, P. D., Mari, C., Hasegawa, B. H. Small-animal SPECT and SPECT/CT: important tools for preclinical investigation. J Nucl Med. 49 (10), 1651-1663 (2008).
- Badea, C. T. H. L., Hedlund, L. W., Johnson, G. A. Micro-CT with respiratory and cardiac gating: Micro-CT with respiratory and cardiac gating. Med Phys. 31 (12), 3324-3329 (2004).
- Guo, X., Johnston, S. M., Qi, Y., Johnson, G. A., Badea, C. T. 4D micro-CT using fast prospective gating. Phys Med Biol. 57 (1), 257 (2011).
- Drangova, M., Ford, N. L., Detombe, S. A., Wheatley, A. R., Holdsworth, D. W. Fast retrospectively gated quantitative four-dimensional (4D) cardiac micro computed tomography imaging of free-breathing mice. Invest Radiol. 42 (2), 85-94 (2007).
- Blocker, S. J., Holbrook, M. D., Mowery, Y. M., Sullivan, D. C., Badea, C. T. The impact of respiratory gating on improving volume measurement of murine lung tumors in micro-CT imaging. PLoS One. 15 (2), e0225019 (2020).
- Bartling, S. H., et al. Retrospective motion gating in small animal CT of mice and rats. Invest Radiol. 42 (10), 704-714 (2007).
- Kuntz, J., et al. Fully automated intrinsic respiratory and cardiac gating for small animal CT. Phys Med Biol. 55 (7), 2069 (2010).
- Hahn, A., Sauppe, S., Lell, M., Kachelrieß, M. Automatic intrinsic cardiac and respiratory gating from cone-beam CT scans of the thorax region. SPIE Proc. Med Imaging. 9783, 200-205 (2016).
- Maes, F., Vandermeulen, D., Suetens, P. Medical image registration using mutual information. Proc IEEE. 91 (10), 1699-1722 (2003).
- Sheng, J., Chen, B., Ma, Y., Shi, Y. A novel reconstruction approach combining OSEM and split Bregman method for low dose CT. Biomedical Signal Processing and Control. 62, 102095 (2020).
- Romdhane, H., Cherni, M. A., Sallem, D. B. On the efficiency of OSEM algorithm for tomographic lung CT images reconstruction. 2016 Second International Image Processing, Applications and Systems (IPAS). , (2016).
- Ewald, A. J., Werb, Z., Egeblad, M. Monitoring of vital signs for long-term survival of mice under anesthesia. Cold Spring Harb Protoc. 2, 5563 (2011).
- Suckow, C., et al. Multimodality rodent imaging chambers for use under barrier conditions with gas anesthesia. Mol Imaging Biol. 11 (2), 100-106 (2009).
- Owen, M. . Practical signal processing. , 81 (2007).
- Feldkamp, L. A., Davis, L. C., Kress, J. W. Practical cone-beam algorithm. J Opt Soc Am. A-optics Image Sci Vision. 1 (6), 612-619 (1984).
- Loening, A. M., Gambhir, S. S. AMIDE: A free software tool for multimodality medical image analysis. Mol Imaging. 2 (3), 131-137 (2003).
- Rodriguez-Molares, A., et al. The generalized contrast-to-noise ratio: A formal definition for lesion detectability. IEEE Trans Ultrason Ferroelectr Freq Control. 67 (4), 745-759 (2020).
- Patterson, M. S., Foster, F. S. The improvement and quantitative assessment of B-mode images produced by an annular array/cone hybrid. Ultrason Imaging. 5 (3), 195-213 (1983).
- . Dragonfly 2022.2 Available from: https://www.theobjects.com/dragonfly (2022)
- Pillai, I. C. L., et al. Cardiac fibroblasts adopt osteogenic fates and can be targeted to attenuate pathological heart calcification. Cell Stem Cell. 20 (2), 218-232 (2017).
- Li, S., et al. A humanized monoclonal antibody targeting an ectonucleotidase rescues cardiac metabolism and heart function after myocardial infarction. Cell Rep Med. 5 (11), 101795 (2024).
- Nadkarni, R., Clark, D. P., Allphin, A. J., Badea, C. T. Investigating deep learning strategies for fast denoising of 5D cardiac photon-counting micro-CT images. Phys Med Biol. 69 (20), 205010 (2024).
Reprints and Permissions
Request permission to reuse the text or figures of this JoVE article
Request PermissionThis article has been published
Video Coming Soon
Copyright © 2025 MyJoVE Corporation. All rights reserved