
Carbon and Nitrogen Analysis of Environmental Samples
Genel Bakış
Source: Laboratories of Margaret Workman and Kimberly Frye - Depaul University
Elemental Analysis is a method used to determine elemental composition of a material. In environmental samples such as soils, scientists are particularly interested in the amounts of two ecologically important elements, nitrogen and carbon. Elemental analysis by the flash combustion technique works by oxidizing the sample with a catalyst through combustion in a high-temperature chamber. The products of combustion are then reduced to N2 and CO2 and detected with a thermal conductivity detector.
Unlike other methods for total nitrogen determination (Kjeldahl method) and total carbon determination (Walkley-Black, Heanes or Leco methods), the flash combustion technique does not use toxic chemicals and is therefore much safer to use.
This video will demonstrate combustion-based elemental analysis using the Flash EA 1112 instrument from Thermo Fisher Scientific.
İlkeler
The soil samples are placed in a tin disc and dropped into the oxidation reactor via an autosampler where it is burned in an oxygen environment at greater than 900 °C in the presence of an oxidation catalyst. The carbon in the sample is converted to carbon dioxide and the nitrogen is converted to nitrogen gas and some nitrogen oxides.
C + O2 → CO2
4 N + x O2 → N2 + 2 NOx
Helium gas carries these products into a second reaction tube filled with copper that reduces the nitrogen oxides to nitrogen gas and removes excess oxygen. This is completed at 680 °C.
NOx + Cu → N2 + CuO
O2 + Cu → CuO
The gas stream then flows through a filter filled with magnesium perchlorate to remove any water vapor before the stream reaches the gas chromatograph column.
The N2 will exit the gas chromatography column first at about 110 s, and then the CO2 will exit at about 190 s. Using a standard curve created using aspartic acid, the %N and %C in the soil sample can be determined.
Prosedür
1. Preparation of Soil Samples
- Dry soil samples at 60 °C for 48 h.
- Pass the soil through a 2 mm x 2 mm sieve.
- Put approximately 5 g of the soil into the ball mill grinder and grind for 2 min. It is important to get a homogeneous sample since your sample size will be very small.
- Put milled soil into a small container and store in a desiccator until ready to use.
2. Setting up the Instrument Parameters
- Turn on the Flash EA 1112 instrument in the back by flipping the switch up.
- Turn on the computer.
- Double click on the “Eager 300” icon to start the software program that runs the instrument.
- Double click on the “NC Soils” icon to open the method that runs the instrument setup for soils.
- Heat up the instrument by opening up the “Edit Elemental Analyzer Parameters” and clicking on the “Send” button. The parameters should be as follows (See Figures 1–3):
a. Temperatures: Left = 900 °C, Right = 680 °C, Oven = 50 °C
b. Gas flow: Carrier = 130 mL/min, Oxygen = 250 mL/min, Reference = 100 mL/min
c. Cycle Runtime = 360 s
d. Sampling Delay = 12 s
e. Oxygen Injection End = 5 s
f. Detector = Filament On - Create a sample table by clicking on “Edit Sample Table” and then “Fill Sample Table”. Change the filename to today’s date. Input the number of samples you plan to run, including the standards and blanks. Then click “Replace” to replace the last sample table that was created with your new sample table.
3. Creating a Standard Curve
- Using forceps, remove one tin disc from the pack and mold it into a cup shape using the special sealing device. Avoid touching the tin disc with your fingers to avoid transferring oils from your fingertips. (See Figures 4–5)
- Using forceps, place the tin disc on the microbalance and zero the balance.
- Using forceps, remove the tin disc from the microbalance and using a microspatula, place approximately 1 mg of aspartic acid standard into the tin disc.
- Weigh the tin disc with the aspartic acid standard on the microbalance. Enter this weight into the data table in the Eager 300 software on the computer.
- Seal up the tin disc with the forceps so that none of the aspartic acid standard will spill out of it. Place the tin package into the autosampler. (See Figure 6)
- Repeat steps 3.1 – 3.5, using approximately 5 mg of aspartic acid standard.
- Repeat steps 3.1 – 3.5, using approximately 7.5 mg of aspartic acid standard.
- Repeat steps 3.1 – 3.5, using approximately 10 mg of aspartic acid standard.
4. Loading the Autosampler with Soil Samples
- Using forceps, remove one tin disc from the pack and mold it into a cup shape using the sealing device. You should not touch the tin with your fingers to avoid transferring oils from your fingertips.
- Using forceps, place the tin disc on the microbalance and zero the balance.
- Remove the tin disc from the microbalance and place approximately 50 mg of the homogenized soil into the tin disc using a microspatula.
- Weigh the tin disc with soil sample on the microbalance. Enter this weight into the data table in the Eager 300 software on the computer.
- Seal up the tin disc using the forceps so that the soil is contained. Transfer the tin package to the autosampler tray.
- Repeat steps 4.1 – 4.5 for all of your samples. It is recommended to run triplicate trials of each sample. A triplicate experiment is considered a good rule of thumb to rule out experimental errors.
5. Running the Samples
- When the appropriate temperatures have been reached on the instrument, the green “Temperature Ready” light will turn on. At the bottom of the screen on the computer, it will also say “Ready for Analysis”.
- Before starting your sample run, click on “File” and “Save Method” to save the data you just input. It is recommended that you save the method with your last name and the date.
- To begin the run, click on the green arrow and push “Start Now”.
- It will take approximately 6 min per sample to run.
- After the run is complete, you can see the results by clicking on “Recalculation” then “Summarize Results”.

Figure 1. Flash EA 1112 parameters setup screen 1.
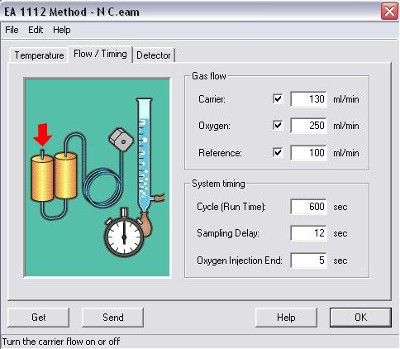
Figure 2. Flash EA 1112 parameters setup screen 2.
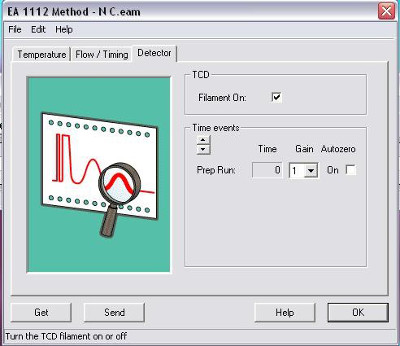
Figure 3. Flash EA 1112 parameters setup screen 3.

Figure 4. Removing a tin disc with forceps.

Figure 5. The tin disc molded into a cup shape using the sealing device.

Figure 6. The tin package being placed into the autosampler.
Sonuçlar
A chromatogram for each sample is produced showing the amount of nitrogen and carbon in the sample (Figure 7).
The areas under the curve at each of the peaks in the sample chromatogram are compared to the standard curves (Figures 8 and 9), and the amount of nitrogen and carbon in the sample is calculated. Based on the weight of the original sample, the %N and %C is calculated (Figure 10).

Please click here to view a larger version of this figure.
Figure 7. Chromatogram showing nitrogen and carbon peaks.
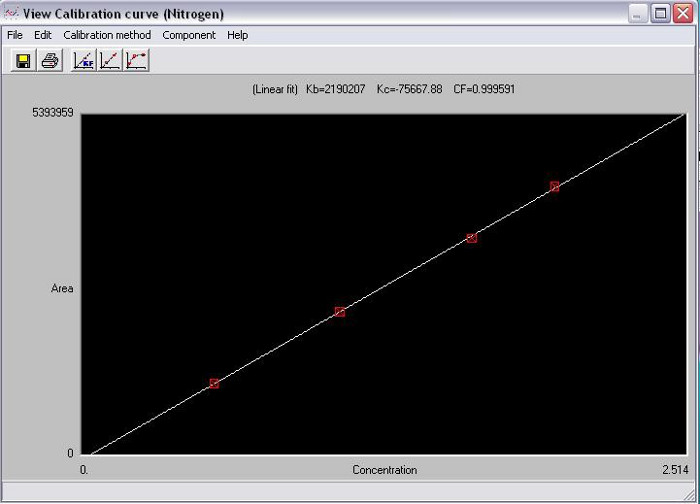
Figure 8. Assay standard curve for nitrogen.

Figure 9. Assay standard curve for carbon.
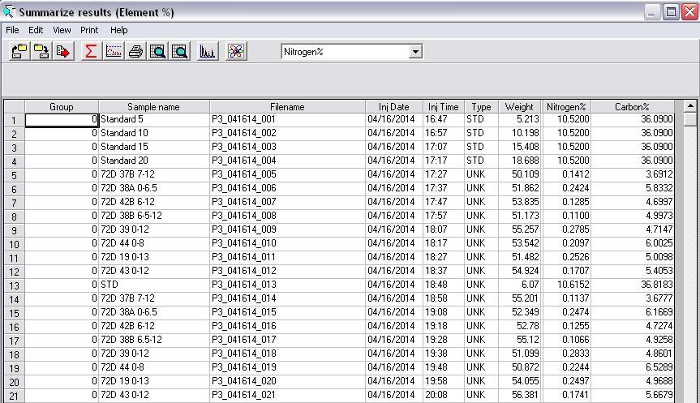
Figure 10. Calculation of %N and %C, based on the weight of the original sample.
Başvuru ve Özet
The Carbon to Nitrogen (C:N) ratio in soil is a ratio of the mass of carbon to the mass of nitrogen in the soil sample. The C:N ratio of soil and anything put on the soil (like crop residue cover) can affect crop residue decomposition and nutrient cycling. Soil microorganisms have a C:N ratio of approximately 8:1. To maintain this ratio, they must acquire their carbon and nitrogen from the environment. However, since some of the carbon that the microorganisms acquire must be used as a source of energy in addition to what it needs for body maintenance, the microorganisms require a C:N ratio of approximately 24:1. If leaf litter or soil cover with a C:N ratio of higher than 24:1 is placed on the soil (e.g., corn stover with a C:N ratio of 57:1), the microorganisms will be required to use nitrogen from the soil in order to decompose the litter material. This results in a nitrogen deficit in the soil. If leaf litter or soil cover with a C:N ratio of lower than 24:1 is placed on the soil (e.g., alfalfa hay with a C:N ratio of 13:1), there will be some nitrogen remaining after the decomposition of the litter material, which will be released into the soil as nutrients.
Elemental analysis not only can be used to determine the C:N ratio of the soil samples, but can also be used to determine the C:N ratio in plant materials, such as tree leaves and crop residue. This information is important for farmers in order to help them decide what type of crop cover to use. The C:N ratio of the crop residue added to cover the soil influences how quickly the residue will decompose. This has implications for whether or not the soil is protected for the desired length of time.
Atla...
Bu koleksiyondaki videolar:

Now Playing
Carbon and Nitrogen Analysis of Environmental Samples
Environmental Science
29.5K Görüntüleme Sayısı

Tree Identification: How To Use a Dichotomous Key
Environmental Science
81.2K Görüntüleme Sayısı

Tree Survey: Point-Centered Quarter Sampling Method
Environmental Science
49.4K Görüntüleme Sayısı

Using GIS to Investigate Urban Forestry
Environmental Science
12.6K Görüntüleme Sayısı

Proton Exchange Membrane Fuel Cells
Environmental Science
22.1K Görüntüleme Sayısı

Biofuels: Producing Ethanol from Cellulosic Material
Environmental Science
53.2K Görüntüleme Sayısı

Testing For Genetically Modified Foods
Environmental Science
89.8K Görüntüleme Sayısı

Turbidity and Total Solids in Surface Water
Environmental Science
35.9K Görüntüleme Sayısı

Dissolved Oxygen in Surface Water
Environmental Science
55.8K Görüntüleme Sayısı

Nutrients in Aquatic Ecosystems
Environmental Science
38.9K Görüntüleme Sayısı

Measuring Tropospheric Ozone
Environmental Science
26.5K Görüntüleme Sayısı

Determination Of NOx in Automobile Exhaust Using UV-VIS Spectroscopy
Environmental Science
30.1K Görüntüleme Sayısı

Lead Analysis of Soil Using Atomic Absorption Spectroscopy
Environmental Science
125.5K Görüntüleme Sayısı

Soil Nutrient Analysis: Nitrogen, Phosphorus, and Potassium
Environmental Science
215.9K Görüntüleme Sayısı

Analysis of Earthworm Populations in Soil
Environmental Science
16.5K Görüntüleme Sayısı
JoVE Hakkında
Telif Hakkı © 2020 MyJove Corporation. Tüm hakları saklıdır