
Antibiotic Susceptibility Testing: Epsilometer Tests to Determine MIC Values of Two Antibiotics and Evaluate Antibiotic Synergy
Przegląd
Source: Anna Bläckberg1, Rolf Lood1
1 Department of Clinical Sciences Lund, Division of Infection Medicine, Biomedical Center, Lund University, 221 00 Lund Sweden
Knowledge of the interactions between antibiotics and bacteria is important in understanding how microbes evolve antibiotic resistance. In 1928, Alexander Fleming discovered penicillin, an antibiotic that exerts its antibacterial function by interfering with cell wall regeneration (1). Other antibiotics with diverse mechanisms of action have subsequently been discovered, including drugs that inhibit DNA replication and protein translation in bacteria; however, no new antibiotics have been developed in recent years. Resistance to current antibiotics has been increasing, resulting in severe infectious diseases that cannot be effectively treated (2). Here, we describe several methods to assess antibiotic resistance in bacterial populations. Each of these methods works, regardless of the mechanism of action of the antibiotics used, because bacterial death is the measured outcome. Antibiotic resistance is not only rapidly disseminated specifically through hospital settings, but also throughout society. In order to investigate such means of resistance, different methods have been developed including the Epsilometer test (E-test) and the broth dilution test (3).
The E-test is a well-established method and is a cost-effective tool that quantifies Minimal Inhibitory Concentration (MIC) data, the lowest concentration of an antimicrobial that inhibits visible growth of a microorganism. Depending on the bacterial strain and antibiotics used, the MIC value can vary between sub μg/mL to >1000 μg/mL (4). The E-test is performed using a plastic strip containing a predefined antibiotic gradient, which is imprinted with the MIC reading scale in μg/mL. This strip is directly transferred on the agar matrix when applied to the inoculated agar plate. After incubation, a symmetrical elliptic inhibition zone is visible along the strip as bacterial growth is prevented. MIC is defined by the area of inhibition, which is the endpoint where the ellipse intersects the strip. Another common method to determine MIC is the microbroth dilution method. Microbroth dilution incorporates different concentrations of the antimicrobial agent added to a broth medium containing inoculated bacteria. After incubation, MIC is defined as the lowest concentration of antibiotic that prevents visible growth (5). It is also a quantitative method and can be applied to several bacteria. Disadvantages of this method include the possibility of errors when preparing the concentrations of the reagents and the large number of reagents required for the experiment. Measuring antibiotic resistance is imperative from both a clinical and research perspective, and these in vitro methods of investigating resistance are discussed and showcased below.
The profile of resistance for a specific bacterium can be applied in order to optimize antibiotic treatment to determine whether a patient would benefit from combination treatment versus single therapy. For the usage of more than one antibiotic at a single time, it is imperative to know their interactions with each other and if they have an additive, synergistic, or antagonistic effect. An additive effect can be seen when the joint effect of the antibiotics equals the potency of the individual antibiotics given at an equal dose. Synergy between antibiotics, on the other hand, is present when the joint effect of the antibiotics is more potent than if the drug would be given alone (6). Applying combinations of antimicrobial treatment is used to avoid the occurrence of antimicrobial resistance thus to enhance the effect of the individual antibiotic treatment (7). Knowledge of antagonism is also as important to prevent unnecessary use of antimicrobial combinations. E-test methodology offers simple and several ways to determine possible synergy and antagonism between different antimicrobial agents. In order to face the proliferation of antibiotic resistant pathogens, knowledge of possible synergistic and antagonistic mechanisms of certain antibiotics is important resulting in clinical efficacy and battling multidrug-resistance.
Determination of synergy using E-tests can be divided into two broad approaches: cross and non-cross testing. While both synergy tests rely on the previous knowledge of individual MIC values, the two approaches are slightly different in methodology and conceptual approach. In a non-cross synergy test, the first antibiotic in the pair to be tested is placed on an agar plate inoculated with bacteria. After allowing the antibiotics from the first strip infuse the plate (e.g. after 1 hour), the strip is removed and a new strip containing the second antibiotic is placed on the exact same spot as the first, making sure to place the two individual MIC values on top of each other. The resulting inhibition zone can then be analyzed as described above, and synergy calculated based on the Equation 1.
Equation 1 - Fractional Inhibitory Concentrations (FIC)

Values >0.5 demonstrates synergy.
While rewarding the examiner with easy-to-analyze plates, the method is somewhat laborious and time-consuming due to the change of strips, as well as the need of using two plates per experiment. Instead, a cross test is often employed. Instead of adding the two different E-test strips subsequently on top of each other (after removal of the first), both are placed simultaneously but in the form of a cross ( 90° angle), with the two previously determined MIC values forming the 90° angle. By this approach only one plate is needed per synergy test, as well as less work, making it a preferred choice despite being slightly more difficult to analyze. The new MIC values in the combined antibiotics approach can be visualized as the modified inhibition zones, after which synergy can be determined by Equation 1.
Instead of using an agar plate approach, a microbroth approach can often be preferential due to its higher flexibility (e.g. ability to choose specific concentrations of antibiotics outside the limits of an E-test strip). Further, microbroth tests are suggested to be more sensitive due to their even distribution of antibiotics in a liquid solution, not depending on the dissociation within a solid phase (agar plate). Wells in a 96-well microplate will be inoculated with a set number of bacteria (106 cfu/mL: bacterial concentration can be estimated by OD600 nm measurements, turbidity standards, or by spread plating samples from 10x bacterial serial dilutions), and antibiotics in different dilutions will be added to the wells. Similarly, to the E-test strips MIC is determined as the intersection (well/spot) with the lowest concentration of antibiotics inhibiting visible growth of bacteria.
Experimental Aim
- The project below describes strategies to determine MIC-values of penicillin G and gentamicin of Streptococcus group G by two different methods, E-test and microbroth dilution. For E-test, Mueller-Hinton agar plates inoculated with Streptococcus group G were used in combination with gradient strips of penicillin G and/or gentamicin; while MH-broth with 50% lysed horse blood and 20 mg/mL β-NAD were used with soluble antibiotics together with Streptococcus group G in a microbroth approach.
Materials
- Bacterial colonies on a blood agar plate, stored <7 days in 4°C
- Blood agar plates
- 0.5 McFarland standard
- 1% BaCl2
- 1% H2SO4
- Saline tube (2 mL)
- Cotton tipped applicator
- Mueller-Hinton agar plates (MHA plates)
- MH broth with 50% lysed horse blood and 20 mg/mL β-NAD (MH-F)
- E-test penicillin/gentamicin (or antibiotics of interest) (BioMerieux, Marcy l'Etoile, France, Sweden)
- Antibiotics penicillin/gentamicin (or antibiotics of interest (powder/solution))
Note: The specific media used for bacterial growth may vary for different species.
Procedura
1. Epsilometer tests (E-tests)
- Set-up
- Wear gloves and a lab coat
- Ready the workspace by sterilizing it using 70% ethanol
- Collect Mueller-Hinton agar plates (MHA plates)
- Preparing a McFarland turbidity standard No. 0.5
- Prepare a 1% solution of barium chloride (BaCl2):
Add 1 gram anhydrous barium chloride (BaCl2) in 100 mL distilled water. Vortex well. - Prepare a 1% solution of sulfuric acid (H2SO4):
Add 1 mL of concentrated H2SO4 in 99 mL of distilled water. Vortex well. - Prepare a McFarland turbidity standard No. 0.5:
50 µL BaCl2 solution in 5 mL of 1% H2SO4 solution. Vortex the solution well to get a turbid suspension. - Keep McFarland turbidity standard No. 0.5 in a foil-covered tube. Store at 25°C for a maximum of 6 months. Vortex well to a homogenous solution before use.
- Prepare a 1% solution of barium chloride (BaCl2):
- Preparing MHA plates
- Scrape Streptococcus group G bacteria from blood agar plate using a sterile loop. Mix into 1mL of saline, and vortex to a suspension of the bacteria.
- Compare the suspension to a McFarland standard No. 0.5 to achieve the same turbidity in order to have the same inoculum size during the experiments. Adjust the concentration using either additional saline or bacteria.
- Inoculate the MHA plates by using a sterile cotton tipped applicator. Swab the plate gently to cover the surface. Proceed with one of the three methods described below (1.4-1.6).
- Single antibiotic resistance test. Streptococcus group G, resistance to penicillin G or gentamicin
- Place an E-test strip (either penicillin G or gentamicin) in the center of the MHA plate (Figure 1 A,B).
- Incubate for 18-20 hours, 37°C.
- Read the results. MIC is measured as the inhibition zone that intersects the graded antibiotic test strip (Figure 1 C,D).

Figure 1: Single E-test. Placement of an E-test strip of A) penicillin G and B) gentamicin on a Mueller Hinton agar plate covered with bacterial colonies of a group G streptococci before (A and B) and after (C and D) overnight incubation at 37°C 5% CO2. Please click here to view a larger version of this figure.
- Synergy testing cross-approach. Streptococcus group G, resistance to penicillin G and gentamicin.
- Place two E-test strips with different antibiotics (e.g. penicillin G and gentamicin) on the inoculated MHA plate in a cross formation.
- For the most accurate results, aim at placing the cross at an approximately 90° angle at the intersection between the scales at their MIC values, previously determined on single antibiotic resistance test (Figure 2 A).
- Note that once the strips are placed on the agar plate, they should not be moved, since some antibiotics may already have been absorbed by the plate. Therefore, it is more appropriate to maintain the strips at a slightly wrong angle (e.g. 85°) and up to 1-2 mm from the actual MIC-value. It is advised to run the experiment in triplicate to reduce this problem.
- Incubate for 18-20 hours, 37°C.
- Read the results. MIC is measured as the inhibition zone that intersects the graded antibiotic test strip on each respective E-test strip (Figure 2 B).
- Use the formula for fractional inhibitory concentration (FIC) (Equation 1) in order to determine synergy.
- Place two E-test strips with different antibiotics (e.g. penicillin G and gentamicin) on the inoculated MHA plate in a cross formation.

Figure 2: Synergism detection - cross test. Results of antimicrobial synergy testing of MIC of penicillin G and gentamicin on Streptococcus group G before (A) and after (B) incubation overnight at 37°C 5% CO2. A 90° angle is formed between the two individual MIC-values (penicillin G: 0.094 µg/mL, gentamicin: 8 µg/mL). Please click here to view a larger version of this figure.
- Synergy testing non-cross approach. Streptococcus group G, resistance to penicillin G and gentamicin.
- Place the E-test strip in the center of the MHA plate (Figure 3 A,D).
- Mark where the previously determined MIC value was on each strip.
- Incubate for 1 hour at room temperature.
- Discard the E-test strip for each MHA plate (Figure 3 B,E).
- Place the second E-test strip (containing a different antibiotic) on the area of the earlier removed strip respectively so that their MIC values will correspond to the mark and are aligned.
- Incubate for 18-20 hours, 37°C.
- Read the results. MIC is measured as the inhibition zone that intersects the graded antibiotic test strip on each respective E-test strip (Figure 3 C,F).
- In order to determine synergy, the formula for fractional inhibitory concentration (FIC) is used (Equation 1).

Figure 3: Synergism detection - non-cross test. Results of antimicrobial synergy testing of MIC of penicillin G and gentamicin on Streptococcus group G. A) Gentamicin strip (8 µg/mL centered) on top of Streptococcus group G bacteria, B) Removal of gentamicin strip, C) Combined gentamicin / penicillin G strip (0.094 µg/mL centered) on top of Streptococcus group G bacteria, D) Penicillin G strip (0.094 µg/mL centered), E) Removal of penicillin G strip, F) Combined penicillin G / gentamicin strip (8 µg/mL centered) on top of Streptococcus group G bacteria. Please click here to view a larger version of this figure.
2. Broth testing
- Set-up
- Wear gloves and a lab coat
- Ready the workspace by sterilizing it using 70% ethanol
- Collect 15mL MH broth with 50% lysed horse blood and 20 mg/mL β-NAD (MH-F)
- (Optional) Perform an E-test [Protocol 1] to determine the MIC on solid medium
- While optional, such knowledge will allow for better experimental design (e.g. the concentrations of antibiotics added can be designed to surround the MIC value determined from the plate), improving the chances of a successful experiment.
- Preparing a bacterial inoculum. As stated above, bacterial concentration can be estimated by OD nm measurements or McFarland turbidity standards
- OD600 nm Method
- Obtain a bacterial suspension with an established bacterial concentration
- Dilute the culture in MH-F broth to achieve an OD600 of 0.003
- McFarland turbidity method
- Put 15 mL MH-F broth in a sterile tube.
- Inoculate the MH-F broth with bacteria (from a plate) to a McFarland level. Vortex the solution vigorously. Pour the solution into a sterile Petri dish.
- OD600 nm Method
- Preparing antibiotics
- Determine the concentration of antibiotics desired
- Identify the MIC value from the E- test (ex. 0.125 µg/mL for penicillin G and 8 µg/mL for gentamicin)
- Multiply the agar plate MIC value by 24-27, corresponding to four-seven 2x serial dilutions. This will be the starting concentration of antibiotics. (ex. for penicillin G, seven 2x serial dilutions: 0.125 µg/mL x 27 = 16 µg/mL; for gentamicin, four 2x serial dilutions 8 µg/mL x 24 = 128 µg/mL
- Multiply the desired starting value 100x in order to determine generate a stock concentration of the antibiotics (ex. stocks of 1.6 mg/mL penicillin G and 12.8 mg/mL gentamicin)
- Prepare a 100x antibiotic stock concentration accordingly
- Dissolve the antibiotics in 10mL autoclaved water, and vortex to generate a stock solution (ex. 16 mg penicillin G and 128 mg gentamicin to create the above stocks)
- Determine the concentration of antibiotics desired
- Add bacteria to microplate wells
- Aliquot 200 µl MH-F broth containing bacteria inoculum to the wells in the first 3 rows of a 96-well microtiter plate for an experiment in triplicate.
- Add antibiotics to microplate wells
- Add 200 µL extra MH-F broth with bacteria to the first column of wells (A1, B1, C1) to bring the total volume to 400 µL.
- Add 4 µL of the stock concentration of antibiotics to the first column of wells. Since the sample contains 400 µL it will result in a 100x dilution of the antibiotics.
- Generate a 2x serial dilution by transferring 200 µL bacteria/antibiotics from A1 to A2, all the way to A11. Pipet vigorously between the dilutions. Repeat the step for additional rows.
- Remove 200 µL from the column 11 so the final volume in all wells are 200 µL.
- Leave the last column (A12, B12, C12) without antibiotics, as controls.
- Determine MIC values
- Incubate the 96-well microtiter plate for 24 hours at 37°C without shaking.
- The MIC value is defined as the last well in the dilution series that exhibits no visible growth of bacteria (Figure 4). This value,however, can only be trusted if the original inoculum size was correct.

Figure 4: MIC determination by broth dilution. MIC is here defined as the last well that exhibits clearness (no growth of bacteria) before it changes turbidity. Row are duplicates of the MIC value of penicillin G and row are duplicates of the MIC value of gentamicin, both versus an isolate of Streptococcus group G. A) actual experimental outcome, B) schematic interpretation of the values from A (grey = no growth; white = growth). Please click here to view a larger version of this figure.
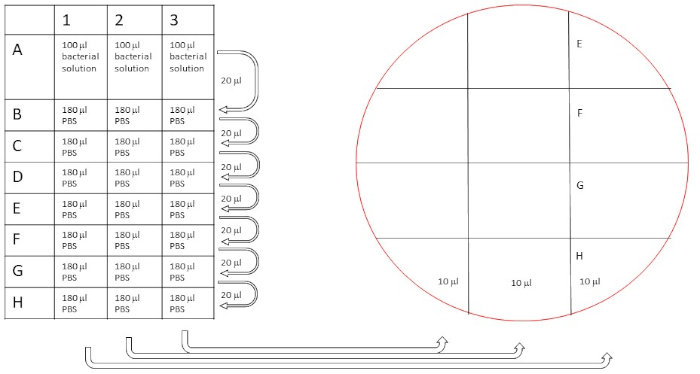
Figure 5: Schematic procedure of dilution series to count original bacteria concentration. Dilutions were performed as described (20 µL diluted in 180 µL for a 10x dilution series), and then 10 µL from the rows A-H are plated on two separate blood agar plates as indicated. Please click here to view a larger version of this figure.
- Determine original inoculum size
NOTE: Microbroth assays are highly sensitive for the original inoculum size used. An excessive inoculum size will give a false positive result, since the antibiotics added will not be able to inhibit growth any longer at that ratio. Therefore, it is critical to verify how much bacteria have been added to the microwells. While the data will not be available at the point of the experiment (due to the need of 24 hours incubation) it will serve as a control. If the number of added bacteria is within the stated concentration range, the MIC values can be trusted. If the inoculum was too high or too low, the experiment needs to be repeated.- Serially dilute the bacteria
- Prepare a 96-well microtiter plate to dilute the original bacterial concentration in order to determine the inoculum size. The optimum is a volume of 200 µL with 105-6 bacteria. To perform the dilutions, first aliquot 180 µL sterile PBS to each well in B-H (in triplicate 1-3).
- Next, add 100 µl of bacterial solution to A (in triplicate 1-3).
- Generate a 10x serial dilution (in triplicate) by transferring 20 µl bacteria from A to B, pipet vigorously. Repeat the steps for C-H.
- Plate the bacterial dilutions for inoculum size determination
- Mark blood agar plates according to Figure 5.
- Transfer 10 µL from the serial dilution to the plate according to Figure 5.
- Incubate the plate at 37°C for 20-24 hours.
- Determine the bacterial inoculum size
- Count bacterial numbers in spots within 5-50 colonies (Figure 6).
- Calculate the initial inoculum size by calculating the mean of the triplicate samples, multiply by the dilution factor (e.g. 10x for B samples, 100x for C samples, 1000x for D samples, etc.) and then by 100 to compensate for the spotting volume of 10 µL, resulting in the inoculum size in cfu/mL. If the inoculum is within 105-6 cfu/mL the MIC data can be trusted.
- Serially dilute the bacteria
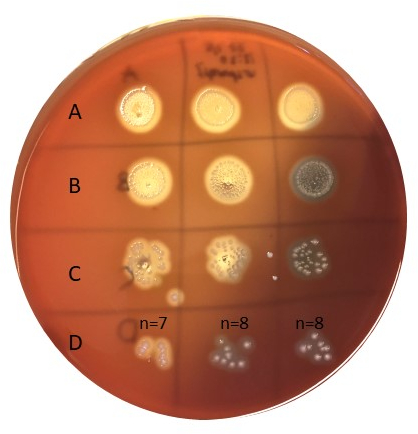
Figure 6: Determination of inoculum size. Bacteria inoculated according to figure 5 were incubated for 20-24 hours at 37°C and then counted. Row D has a good number of colonies to count (e.g. 5-50). Samples in A are undiluted, B is diluted 10x, C is diluted 100x, and D is diluted 1000x, and only 10 µL is plated in each spot. Please click here to view a larger version of this figure.
Wyniki
MIC values in E-test
Individual MIC values were identified in Figure 1 as 0.094 μg/mL for penicillin G and 8 μg/mLfor gentamicin. For synergy tests, both demonstrated an MIC value for penicillin G of 0.064 μg/mL (Figures 2, 3), while gentamicin had an MIC 4 μg/mL for cross and non-cross tests. Note a slight discrepancy between the cross and non-cross tests may occur due to the different incubation times of the strips in the two settings.
Calculation of synergy
The equation for FIC is:
 = 1.18 >0.5 (no synergy)
MIC determination in broth
Cloudiness of the wells indicated bacterial growth, and thus no inhibition occurred. The first clear well with penicillin G (Figure 4) contained 0.12 μg/mL penicillin G, and hence this was the MIC value. For gentamicin the first clear well was present at 8 μg/mL gentamicin. The penicillin G value was slightly higher than when using an E-test, due to the higher resolution of the strip (e.g. based on a 1.5x factor serial dilution, not a 2x factor).
Inoculum size
To determine the inoculum size, an approach as outlined in Figure 5 and 6 was used. Colonies were counted in the D-row (1000x dilution), adding up to 7, 8, and 8 in the triplicate series with a mean value of 7.67 cfu. The number of colonies neeed to be multiplied with the dilution factor (e.g. 1000x), as well as with 100 to obtain cfu/mL, giving an inoculum size of approximately 8 x 10⁵, well within the targeted inoculum size of 105-6 cfu/mL.
Wniosek i Podsumowanie
Antibiotic resistance is a worldwide health problem. In order to determine resistance mechanisms of microbes, methods testing for synergy and antagonism with different antibiotics is crucial. The E-test method is rapid, easy to replicate, and can be used to investigate any synergistic potential of combination therapies. The broth dilution method can also be assessed to predict bactericidal activity. In order to investigate the resistance mechanisms of different microbes, knowledge of synergistic and antagonistic antibiotic interactions is crucial. Combining antibiotics may be a strategy to increase treatment efficacy and face antibiotic resistance. In the tests performed here, we were able to determine the MIC values of penicillin G and gentamicin for group G Streptococcus. We also demonstrated that the two antibiotics do not display synergistic effects, thus would not be a preferred treatment option for such infections.
Odniesienia
- Tan SY, Tatsumura Y. Alexander Fleming (1881-1955): Discoverer of penicillin. Singapore Medical Journal. 56 (7):366-7. (2015)
- Aminov RI. A brief history of the antibiotic era: lessons learned and challenges for the future. Frontiers in Microbiology. 1:134. (2010)
- Pankey GA, Ashcraft DS, Dornelles A. Comparison of 3 E-test (®) methods and time-kill assay for determination of antimicrobial synergy against carbapenemase-producing Klebsiella species. Diagnostic Microbiology and Infectious Disease. 77 (3):220-6. (2013)
- EUCAST: European Committee On Antimicrobial Susceptibility Testing (www.eucast.org).
- Wiegand I, Hilpert K, Hancock RE. Agar and broth dilution methods to determine the minimal inhibitory concentration (MIC) of antimicrobial substances. Nature Protocols. 3 (2):163-75. (2008)
- Doern CD, When does 2 plus 2 equal 5? A review of antimicrobial synergy testing. Journal of Clinical Microbiology. 52 (12):4124-28. (2014)
- Worthington RJ, Melander C. Combination approaches to combat multi-drug resistant bacteria. Trends in Biotechnology. 31 (3):177-84. (2013)
Przejdź do...
Filmy z tej kolekcji:

Now Playing
Antibiotic Susceptibility Testing: Epsilometer Tests to Determine MIC Values of Two Antibiotics and Evaluate Antibiotic Synergy
Microbiology
93.6K Wyświetleń

Creating a Winogradsky Column: A Method to Enrich the Microbial Species in a Sediment Sample
Microbiology
128.9K Wyświetleń

Serial Dilutions and Plating: Microbial Enumeration
Microbiology
315.3K Wyświetleń

Enrichment Cultures: Culturing Aerobic and Anaerobic Microbes on Selective and Differential Medias
Microbiology
132.0K Wyświetleń

Pure Cultures and Streak Plating: Isolation of Single Bacterial Colonies from a Mixed Sample
Microbiology
166.0K Wyświetleń

16S rRNA Sequencing: A PCR-based Technique to Identify Bacterial Species
Microbiology
188.5K Wyświetleń

Growth Curves: Generating Growth Curves Using Colony Forming Units and Optical Density Measurements
Microbiology
294.8K Wyświetleń

Microscopy and Staining: Gram, Capsule, and Endospore Staining
Microbiology
362.9K Wyświetleń

Plaque Assay: A Method to Determine Viral Titer as Plaque Forming Units (PFU)
Microbiology
186.0K Wyświetleń

Transformation of E. coli Cells Using an Adapted Calcium Chloride Procedure
Microbiology
86.6K Wyświetleń

Conjugation: A Method to Transfer Ampicillin Resistance from Donor to Recipient E. coli
Microbiology
38.2K Wyświetleń

Phage Transduction: A Method to Transfer Ampicillin Resistance from Donor to Recipient E. coli
Microbiology
29.0K Wyświetleń
Copyright © 2025 MyJoVE Corporation. Wszelkie prawa zastrzeżone