
Fatigue of Metals
Przegląd
Source: Roberto Leon, Department of Civil and Environmental Engineering, Virginia Tech, Blacksburg, VA
The importance of studying metal fatigue in civil infrastructure projects was brought into the spotlight by the collapse of the Silver Bridge in Point Pleasant, West Virginia in 1967. The eyebar-chain suspension bridge over the Ohio River collapsed during evening rush hour, killing 46 people as a result of the failure of a single eyebar with a small 0.1-inch defect. The defect reached a critical length after repeated loading conditions and failed in a brittle fashion causing the collapse. This event garnered attention in the bridge engineering community and highlighted the importance of testing and monitoring fatigue in metals.
Under normal service conditions, a material can be subjected to numerous applications of service (or everyday) loads. These loads are typically at most 30%-40% of the ultimate strength of the structure. However, after the accrual of repeated loadings, at magnitudes substantially below the ultimate strength, a material can experience what is termed fatigue failure. Fatigue failure can occur suddenly and without significant prior deformation and is linked with crack growth and rapid propagation. Fatigue is a complex process, with many factors affecting fatigue resistance (Table 1). This complexity underscores the integral need for routine and thorough inspection of structures subjected to repeated loadings such as bridges, cranes, and almost all types of vehicles and aircrafts.
| Stressing conditions | Material properties | Environmental conditions |
|
|
|
Table 1. Factors affecting fatigue
Zasady
Fatigue cracks typically initiate at the material's surface, at a point of high biaxial or triaxial stress concentrations, such as those that occur in the diaphragms in steel bridges where welds are subjected to tensile forces along all three axes.
In metals, a fatigue crack initiates as slip planes in the metal begin to move slightly at the site of a preexisting surface defect or imperfection. The crack growth will initially be very slow. The crack is usually initiated at an angle to the normal stresses due to shear, but will eventually turn and grow perpendicular to the principal tensile stress. Fatigue cracks will propagate under tensile or shear stress, but not under compressive stress. After the crack reaches a critical length, sudden fracture will occur as the crack propagates at the speed of sound. The opening and closing, as well as the blunting and sharpening of the crack tip produces characteristic "beach marks" on the fatigue fracture surface, which resemble those that the tide leaves on a beach as the tide recedes. A rougher surface is produced where the material actually fractured.
When discussing fatigue failure in engineering terms, there are two important key terms to consider:
1. Number of cycles (N) - defined as the number of excursions between a maximum and minimum stress until failure occurs
2. Stress range (S or σSR) - defined as the difference between the maximum and minimum stress
Fatigue failure is conventionally defined in two categories: high-cycle, low stress and low-cycle, high stress. High cycle generally indicates at least a few tens of thousands of cycles and low-cycle refers to less than one hundred cycles. Low and high stress refer to whether the part under study undergoes elastic or inelastic deformations (i.e., whether the elastic limit of the material is exceeded), respectively. High-cycle, low stress occurs in machinery and equipment with moving parts, or on structures with moving loads, such as bridges and cranes. On the other hand, low-cycle, high stress fatigue occurs during earthquakes and similar situations, where large inelastic stresses occur for 10 cycles or less. The low-cycle, high stress range case is sometimes illustrated by the bending back and forth of the leg of a paper clip. It usually takes less that 10 cycles of bending at 90 degrees for the clip to fracture. For this module, we will only discuss high-cycle, low stress fatigue as the mechanisms driving low and high-cycle fatigue failures in ductile materials are fundamentally different. To test this type of fatigue failure in metals, we will be conducting a rotating beam test. Fatigue life is usually characterized by S-N (Stress range vs. Number of cycles) curves. As the applied stress range increases, the number of cycles to failure decreases. Fatigue life will vary for a given material with discrete loading conditions. Some materials will have an endurance limit, or a stress range below which fatigue failure will not occur regardless of the number of cycles, whereas other materials, such as wood or concrete, do not exhibit an endurance limit. Most metals and ferrous alloys do experience an endurance limit after a certain number of cycles.
Fatigue design requires checking Nd, the expected number of cycles during the lifetime of the structure, which is often in terms of millions of cycles of loads at a given stress range. The number of cycles and stress range can easily be characterized as sinusoidal and periodic if the source of the excitation is equipment with rotating parts (Fig. 1a). However, most loading histories are random in real life, and thus very difficult to characterize. Fig. 1b shows a typical load history for a bridge detail. In this case, it is not just the stress range that is hard to characterize, but also the number of cycles. Consider a bridge on an interstate highway that has an average of 5 trucks per minute traversing it. For an expected lifetime of 50 years, there will be about 130 million cycles, but clearly there are considerable uncertainties in predicting and extrapolating truck traffic in the future. Similarly, the stress range, which is based on the weight of the truck and the distribution of its axles, is also very difficult to predict.
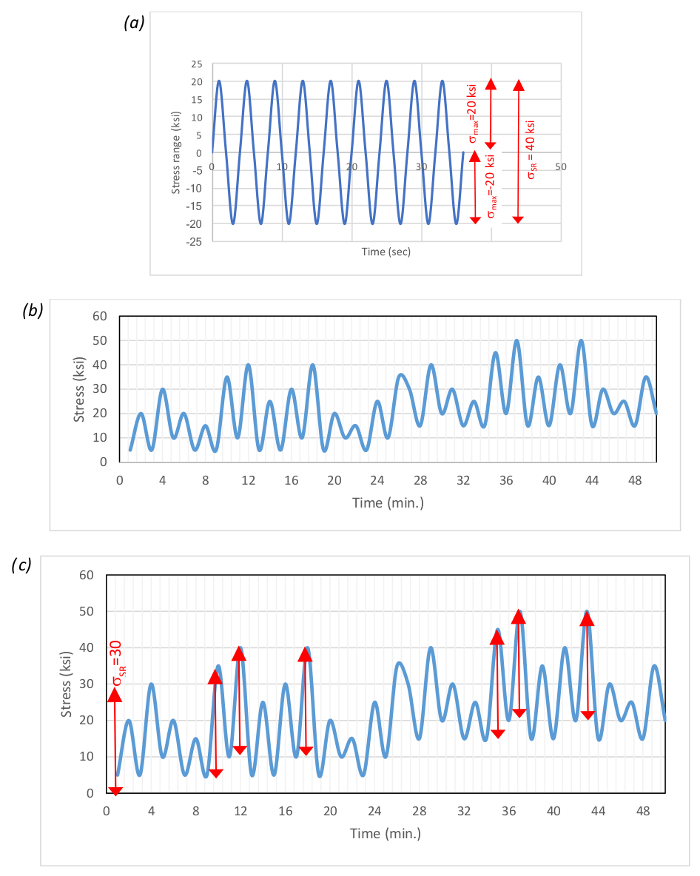
Figure 1: Periodic and random load histories: a. Periodic forcing function, b. Random forcing function, c. Rainflow counting. Please click here to view a larger version of this figure.
To transform a random load history into an equivalent set of periodic ones, simplified techniques, such as the Miner's rule, are employed to model the behavior. Miner's rule (Eq. 1), also known as rainflow counting, accounts for both variations in stress amplitude over service life, as well as cumulative damage. To properly utilize Eq. 1 to transform a random load history, such as the example shown in Fig. 1b, one will divide the signal into a number of stress ranges (□SRi). For each of the stress ranges, one will count the number of cycles (ni) that occur at roughly this stress range and divide by the number of cycles to failure (Ni) at that stress range from a S-N curve. An example of this calculation for the data in Fig. 1b is shown in Fig. 1c. At the left end, a stress range of 30 ksi is shown. If we call 30 ksi = □SR1, there are six cycles (or n1 =6, marked with the red arrows) at □SR1 if we measure from the bottom of one cycle to the top of the next. In addition, there are five at 25 ksi (call it □SR2), four at 20 ksi (□SR3), three at 15 ksi (□SR4), four at 10 ksi (□SR5) and two at 5 ksi (□SR6). If the sum over all the stress ranges is less than 1, the bridge is expected to not experience a fatigue failure, whereas if the value is greater than 1, one would expect to see fatigue failure in the bridge. While this technique is not very sophisticated and has some serious theoretical limitations, it nevertheless represents a useful approach to a very complex problem.
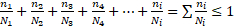 (1)
(1)
Given the very large number of cycles needed to reach failure, testing for fatigue can be a daunting task. A simple but powerful approach to this problem is to use a rotating beam test, in which the specimen is supported at its ends and subjected to two point loads at its third points (four-point bending configuration), and rotated so that there is a constant moment without shear in the center one-third of the specimen. During each revolution, the specimen will undergo the transition from full tension (+) to full compression (-), paralleling the sinusoidal character of a periodic loading history (Fig. 1a). The use of a motor that can run at hundreds of revolutions per minute (rpms) permits millions of cycles and tests to be run in a relatively short time.
While the rotating beam test is a simplified method to measure fatigue failure, there are alternative setups to test fatigue crack growth, which are far more scientific and advanced, as they include a standard crack starter or defect, as well as very precise instrumentation to monitor crack size growth with time. Unfortunately, this type of experiment is extremely expensive to run because of the highly technical and laborious machining requirements for the specimen.
As previously discussed, the initial crack growth is very slow in metals. However, at some point the crack begins to grow at an increasing rate, resulting in an eventual failure. The key to proper civil engineering design is to catch these cracks before the instantaneous failure. Fatigue design is predicated on the concept of fault tolerant design, which assumes that there will be initial cracks present, and that these cracks will grow. To prevent catastrophic fatigue failures, periodic inspections are carried out, with increasing attention as the structure ages. The idea is that at some point in time the crack will reach a size where it becomes visible to the inspector. The inspector may miss the crack the first time, but the concept is that a sufficient number of inspections will occur between the times when the crack becomes visible and when it will reach its critical size, such that the crack should not be missed. The critical size is the crack width at which the crack growth becomes unstable and the crack begins to propagate at the speed of sound. In the aftermath of the Point Pleasant Bridge collapse, a program was instituted at the federal level such that all bridges in the interstate system are inspected at least every two years. Bridges with preexisting and known crack problems are monitored far more frequently (often every six months or less) in order to determine when repairs are needed. Although this program has helped with upholding the integrity of many bridges, this program may not have helped in the case of the Point Pleasant Bridge, as the failure initiated in one of the interior surfaces at the eye bar connection, where it would not have been visible to the inspector. In general, bridge types that are not easily inspected have been taken out of service to avoid similar catastrophes, and new bridges are designed with critical details that are easily inspected.
Following this logic, engineers also employ fault-tolerant design not only when building bridges, but also when designing helicopters and other aircraft, as well as cars and trucks, as all of these structures are very sensitive to fatigue failure given the rotatory motion of their engines at high rpm.
Procedura
- Obtain five A572 Grade specimens with dimensions and machine configuration appropriate for the Moore rotating beam machine being used. In this case we will use a rotating cantilever setup with specimens 2.40 in long and 0.15 in. in diameter with a small necked section 0.50 in. long and 0.04 in. in minimum diameter.
- For the specimen dimensions and machine configuration, calculate the weight required to produce bending stress ranges equal to ±75%, ±60%, ±45%, ±30% and ±15% of the nominal yield stress of the material used if the lower stress is taken as zero stress. For this experiment we will be using an A572 Grade steel with a Fy = 50 ksi, with one specimen tested at each of the stress ranges. A stress rage of ±15% corresponds to ±(0.15*50 ksi) = ±7.5 ksi. Many more specimens will need to be tested at each stress range to obtain statistically valid data.
- Mount the first specimen in the machine; in this case we need to insert the necked section near the middle of the beam and carefully align it so that the beam rotates about its centroid. The cantilever specimen is loaded at the tip by using a point load generated by a set of springs and whose value is monitored by a load cell. The load is applied through a bearing so that the force is always downwards as the beam rotates. The machine speed is set at 1400 rpms, the cycle counter is set to zero, and the test started. The speed, specimen size and applied stress will vary with the testing machine.
- Wait until the specimen fails and record the number of cycles to failure.
- Repeat for the other specimens.
Wyniki
The final results, in terms of stress range vs. number of cycles, should be tabulated (Table 2) and plotted, as demonstrated in Fig. 2. The actual yield stress of the specimen was 65.3 ksi and its tensile strength was 87.4 ksi so the stress ranges shown here correspond to between 23% and 92% of yield.
| Test | Area (in.2) | Inertia (in.4) | Length (in.) | Load (lbs) | Moment (lbs-in.) | Stress (psi) | Number of cycles (N) |
| 1 | 5.102E-03 | 5.102E-03 | 7.64E+00 | 2.50E+00 | 1.91E+01 | 7.541E+01 | 1.00E+07 |
| 2 | 5.102E-03 | 5.102E-03 | 7.64E+00 | 5.00E-01 | 3.82E+00 | 1.508E+01 | 8.95E+04 |
| 3 | 5.102E-03 | 5.102E-03 | 7.64E+00 | 1.00E+00 | 7.64E+00 | 3.016E+01 | 1.20E+04 |
| 4 | 5.102E-03 | 5.102E-03 | 7.64E+00 | 1.50E+00 | 1.15E+01 | 4.525E+01 | 7.80E+03 |
| 5 | 5.102E-03 | 5.102E-03 | 7.64E+00 | 2.00E+00 | 1.53E+01 | 6.033E+01 | 1.23E+03 |
| 6 | 5.102E-03 | 5.102E-03 | 7.64E+00 | 2.50E+00 | 1.91E+01 | 7.541E+01 | 2.10E+02 |
Table 2. Typical results
The data shows that for a number of cycles less than about 100,000, there is a decreasing linear relationship between the stress range and the log of the number of cycles if the stress range exceeds 15 ksi. The best-fit line, then, indicates for a stress range of 25 ksi the number of cycles to failure is about 31,000. Below a stress range of 15 ksi, no failure is indicated. This is considered the endurance limit. The reliability of the endurance limit can be improved by testing more specimens between 10 ksi and 20 ksi.
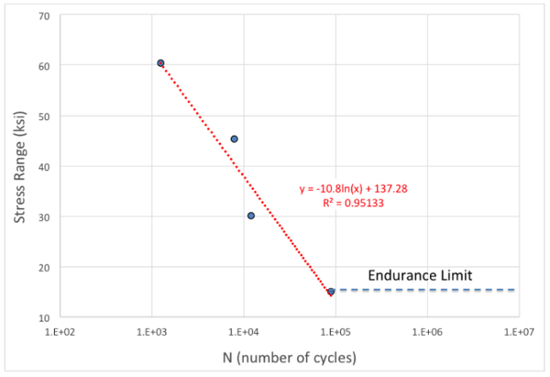
Figure 2: Resulting S-N curve. Please click here to view a larger version of this figure.
If the cyclic load history of a bridge is assumed to consist of a number of cycles (Nexp) and stress ranges (SR) (Table 3), and we know the fatigue behavior of the material, we can use Miner's rule to calculate the cycles to failure by finding the Nmax from the graph in Fig. 2 and summing the Nexp/Nmax across all the stress ranges.
| SR (ksi) | Nexp | Nmax | Nexp /Nmax |
| 50 | 100 | 3431 | 0.029 |
| 45 | 200 | 5327 | 0.038 |
| 40 | 600 | 8272 | 0.073 |
| 35 | 2000 | 12843 | 0.156 |
| 30 | 5000 | 19942 | 0.251 |
| 25 | 6000 | 30964 | 0.194 |
| 20 | 10000 | 48078 | 0.208 |
| 15 | 1000000 | 100000000 | 0.010 |
| Sum = | 0.957 |
Table 3. Calculation for Miner's Rule
As expected, percentagewise, the higher stress ranges have a much larger impact on the damage accumulation. The structure seems to be near its design fatigue life capacity as the value is close to 1.0.
Wniosek i Podsumowanie
Fatigue failures are common in structures subjected to cyclic loads, such as bridges being loaded by heavy trucks. This failure type is due to the growth of preexisting small cracks in areas of large stress concentrations or multi-axial stresses. The initial crack growth is very slow but accelerates with time, eventually reaching a critical size after which the crack propagates at the speed of sound and failure occurs. The principal parameters governing fatigue behavior are the number of cycles and the stress range. In this test, a rotating beam machine was used to impose large number of alternating cycles of tension and compression to a small round beam. The results showed not only the typical trend of S-N curves, but also the significant scatter expected from a test of this type.
Studying fatigue failure helped airplane engineers understand the famous failure of the Comet Airliner. The DeHavilland Company built the Comet Airliner in 1952, making it the most advanced airliner at the time by halving the flight time from Tokyo to London. It flew at relatively high altitudes to achieve this speed, thus it was the first jet airliner to be pressurized. After three airlines exploded in flight in the short span of two years, engineers were charged with determining the source of the failure. To test the effect of normal conditions of use, they took the fuselage of the airliner and submerged it in a swimming pool to simulate pressurization and de-pressurization. The engineers determined that the failure was due to stress concentrations at the corners of the windows fatiguing over repeated loading conditions. As a result, modern day design of airplanes includes rounder corners to counteract this force and reduce the stress concentrations. While the DeHavilland Company was dealing with this safety issue, Boeing learned from this lesson in developing its Boeing 707 airliner, the first of a series of highly successful aircrafts. Boeing prospered and is now the leading manufacturer of airplanes around the world. Today, the successful development of any product that is subjected to large number of loading cycles requires extensive analytical and experimental work to characterize fatigue behavior, in addition to the implementation of a rigorous inspection plan that utilizes fault-tolerant design concepts.
Another example of fatigue failure occurred on the Brandywine River Bridge in 1997. A significant crack was recently discovered on this I-95 bridge over the Brandywine River in Delaware. The steel girder bridge carries six lanes of traffic just north of downtown Wilmington. The crack was located on the fascia girder at mid-span of the bridge's main span. The entire bottom flange was fractured, with the crack extending upwards to within 0.3 meters of the upper flange. In this case, a jogger on the trail below alerted authorities after seeing evidence of the failure. Since the fascia girder is lightly loaded and the bridge had many additional girders (i.e., exhibited redundancy in its load paths), a catastrophic failure was luckily avoided.
Tagi
Przejdź do...
Filmy z tej kolekcji:

Now Playing
Fatigue of Metals
Structural Engineering
40.9K Wyświetleń

Material Constants
Structural Engineering
23.5K Wyświetleń

Stress-Strain Characteristics of Steels
Structural Engineering
109.6K Wyświetleń

Stress-Strain Characteristics of Aluminum
Structural Engineering
88.8K Wyświetleń

Charpy Impact Test of Cold Formed and Hot Rolled Steels Under Diverse Temperature Conditions
Structural Engineering
32.2K Wyświetleń

Rockwell Hardness Test and the Effect of Treatment on Steel
Structural Engineering
28.4K Wyświetleń

Buckling of Steel Columns
Structural Engineering
36.1K Wyświetleń

Dynamics of Structures
Structural Engineering
11.5K Wyświetleń

Tension Tests of Polymers
Structural Engineering
25.4K Wyświetleń

Tension Test of Fiber-Reinforced Polymeric Materials
Structural Engineering
14.4K Wyświetleń

Aggregates for Concrete and Asphaltic Mixes
Structural Engineering
12.2K Wyświetleń

Tests on Fresh Concrete
Structural Engineering
25.8K Wyświetleń

Compression Tests on Hardened Concrete
Structural Engineering
15.2K Wyświetleń

Tests of Hardened Concrete in Tension
Structural Engineering
23.5K Wyświetleń

Tests on Wood
Structural Engineering
32.9K Wyświetleń
Copyright © 2025 MyJoVE Corporation. Wszelkie prawa zastrzeżone