Method Article
Visualizing Lymph Node Structure and Cellular Localization using Ex-Vivo Confocal Microscopy
* Wspomniani autorzy wnieśli do projektu równy wkład.
W tym Artykule
Podsumowanie
This protocol describes a technique to image different cell populations in draining lymph nodes without alterations in the organ structure.
Streszczenie
Lymph nodes (LNs) are organs spread within the body, where the innate immune responses can connect with the adaptive immunity. In fact, LNs are strategically interposed in the path of the lymphatic vessels, allowing intimate contact of tissue antigens with all resident immune cells in the LN. Thus, understanding the cellular composition, distribution, location and interaction using ex vivo whole LN imaging will add to the knowledge on how the body coordinates local and systemic immune responses. This protocol shows an ex vivo imaging strategy following an in vivo administration of fluorescent-labeled antibodies that allows a very reproducible and easy-to-perform methodology by using conventional confocal microscopes and stock reagents. Through subcutaneous injection of antibodies, it is possible to label different cell populations in draining LNs without affecting tissue structures that can be potentially damaged by a conventional immunofluorescence microscopy technique.
Wprowadzenie
Lymph nodes (LNs) are ovoid-shaped organs widely present throughout the body with the crucial function of bridging the innate and adaptive immune responses. LNs filter the lymph in order to identify foreign particles and cancerous cells to mount an immune response against them1. Antigen presenting cells (APCs), T cells and B cells work alongside to generate antigen-specific antibodies (humoral immunity) and cytotoxic lymphocytes (cellular immunity) to eliminate the foreign particles and cancerous cells2. Thus, understanding the dynamics of the immune cells present in the lymphatic system will have important implications for the vaccine development and cancer immunotherapy.
The advent of powerful microscopes - including new confocal and super resolution microscopes - has allowed an extraordinary advancement in understanding how different immune cell populations behave in their native environment3. It is now possible to image several simultaneous cell subtypes using a combination of probes with genetically modified mice that express fluorescent proteins under control of specific targets4,5. In fact, high dimensional techniques, including mass cytometry and multi-parametric flow analysis have been crucial to expanding our knowledge on different immune cell compartmentalization and functionality in the health and disease6,7. However, to prepare samples for these techniques, tissues need digestion and cells are separated from their natural milieu to be analyzed in cell suspensions. To surpass these limitations and allow a better translation in biology, the goal of the protocol proposed here is to apply a straightforward methodology to image ex vivo whole lymph nodes using stock confocal microscopes with the benefit of improved speed, tissue structure preservation, and cell viability compared to the conventional immunofluorescence staining. By using this approach, we were able to show that mice deficient for γδ T cells, a subtype of T lymphocyte involved in host early defense against pathogens4, have compromised follicles and T cell zones as compared to wild type mice. These findings allowed us to pursue a study in which we demonstrated that γδ T cells play a critical role in the homeostasis of lymphoid organs and humoral immune response4. Furthermore, this protocol provides a physiologic pathway for probes and antibodies to reach the lymph node, as they are administered subcutaneously and dissipate through the tissue lymphatic circulation, building on previous reports that used in situ labeling with antibodies to visualize lymphatic-associated structures8,9, germinal center dynamics10,11,12, and targets readily accessible to blood flow13,14,15.
Protokół
The protocol was approved by the Standing Committee on Animals at Harvard Medical School and Brigham and Women’s Hospital, protocol 2016N000230.
1. Mice used for the experiment
- Use 8-week old male and female mice on the B6 background for administering the antibody mix.
- Use CX3CR1GFP/WTCCR2RFP/WT mice to determine whether ex vivo whole LN imaging can also be applied to reporter mice without administering antibody mix as well as to investigate the presence of mononuclear cells, including antigen presenting cells and phagocytes, and their distribution in the LN.
NOTE: CX3CR1GFP/WTCCR2RFP/WT reporter mice have green fluorescent protein (GFP) and red fluorescent protein (RFP) inserted under the control of CX3CR1 and CCR2 promoters, respectively. Reporter mice can be used with or without the injection of the antibody mix. Please see reference4 for antibody mix injection in a reporter mouse. Proceed to surgery if no antibody will be injected.
2. Antibody mix preparation and injection
NOTE: Perform these steps on mice described in step 1.1.
- Dilute 1:10 of brilliant violet (BV) 421 anti-CD4 (GK1.5; 0.2 mg/mL), 1:10 of brilliant blue (BB) 515 anti-CD19 (1D3; 0.2 mg/mL) and 1:20 of phycoerythrin (PE) anti-F4/80 (T45-2342; 0.2 mg/mL) in PBS with the appropriate final volume to inject into the inner thigh (to image inguinal) or into the paw pad (to image popliteal) lymph.
NOTE: Use as isotypes: BV421 Mouse IgG2b, k Isotype Control (R35-38; 0.2 mg/mL); PE Rat IgG2a, κ Isotype Control (R35-95; 0.2 mg/mL); BB515 Rat IgG2a, κ Isotype Control (R35-95; 0.2 mg/mL). If changing the staining antibody, use correct isotype. - To image inguinal LN, inject 100 µL of the antibody mix subcutaneously into the inner thigh (Figure 1A). Alternatively, inject 50 µL subcutaneously of antibody mix into the paw pad to image popliteal LN (Figure 2A). Use delicate 1 mL Insulin syringes, (Insulin U-100) with the needle of size 0.30 mm × 13 mm (30 gauge × ½ inch).
NOTE: Ensure that the injection for inguinal LN staining is subcutaneous and not intramuscular (i.m.), as antibody mix will not be properly drained if i.m. administration is performed. - Do not anesthetize animals before antibody mix injection.
- Wait for a minimum of 3 h (inguinal dLN) and 12 h (popliteal dLN) post injection to remove the organs.
- If LN cell labeling is not completely observed using large polymer fluorescent dyes such as brilliant violet or brilliant blue, use smaller fluorophores, including fluorescein isothiocyanate (FITC), PE and allophycocyanin (APC) as an alternative.
3. Surgery procedure to remove the inguinal draining lymph node
- Euthanize mice using CO2 asphyxiation followed by cervical dislocation.
- Immobilize mice on the acrylic stage with adhesive tape and apply mineral oil with a cotton swab to the abdominal skin to prevent fur deposition around the incision (Figure 1B). Fur removal is not necessary.
- Perform a midline incision using microsurgery curved scissors (11.5 cm) and microsurgery curved forceps (12.5 cm) in the abdomen from the pubis to the xiphoid process (Figure 1C).
- Dissociate the abdominal musculature from the skin (Figure 1D).
- Make horizontal skin incisions at the top and bottom of the vertical incision line to create skin flaps on side of interest (according to the side of the antibody mix injection) and flap the skin to visualize the lymph node (Figure 1E).
- Tape the skin-flap on the acrylic plate (Figure 1F).
- Remove the inguinal draining lymph node using microsurgery curved forceps (Figure 1F). Lymph node will appear as a translucid, usually bilobular, sphere under the skin.
4. Surgery procedure to remove the popliteal draining lymph node
- Euthanize mice using CO2 asphyxiation followed by cervical dislocation.
- Immobilize mice at a prone position on acrylic stage with adhesive tape and apply mineral oil with a cotton swab in the calf and knee (Figure 2A-D).
- Perform a midline incision in the calf from the heel to the knee (Figure 2E,F).
- Dissociate the calf musculature from the skin (Figure 2F,G).
- Expose the popliteal fossa (Figure 2G). Popliteal lymph node will appear as a translucid sphere in the popliteal fossa.
- Remove the popliteal lymph node using microsurgery curved forceps (Figure 2G).
- Alternatively, turn the mouse over on supine position, and approach the popliteal fossa between biceps femoris and semitendinosus for popliteal LN removal by performing a midline incision in the calf from the heel to the knee followed by dissociation of the calf musculature from the skin.
NOTE: Popliteal fossa is a shallow depression located at the back of the knee joint. Open carefully to see the popliteal lymph node.
5. Lymph node preparation
- Place the whole organ in a culture dish with glass bottom (35 mm x 10 mm) and remove the fat that surrounds the organ using microsurgery curved forceps (Figure 1G-I and Figure 2H).
- Centralize the organ in the middle of the dish (Figure 1J and Figure 2H).
- Cover the organ with a fragment of delicate task wipers and keep it soaked with room temperature saline 0.9% or Phosphate Buffer Solution (Figure 1K-M and Figure 2H).
NOTE: It is not necessary to wash lymph nodes after removal or to perform the lymph node extraction in the hood.
6. Ex-vivo confocal microscopy (Imaging)
- Position the Petri dish in the inverted confocal microscope slot (Figure 1N and Figure 2H).
- Image LNs under a confocal microscope (Figure 1O and Figure 2H).
- First, obtain the correct focus by using the conventional light of the confocal microscope with 4x or 10x objective. Then change from the light function to the laser mode.
NOTE: If the confocal microscope does not contain a 4x objective, the focus can be perfectly obtained using the 10x objective. - Adjust the laser power, offset and gain using an isotype-stained, non-stained or non-fluorescent sample (Table 1) to remove autofluorescence and unspecific staining from fluorescent-labeled antibodies such as the ones used in the images showed in this manuscript (BV-421 anti-CD4, BB515 anti-CD19 and PE anti-F4/80).
- Adjust Z and XY positions, using the micrometric and chariot, respectively, on the area of interest in the lymph node.
- Acquire images under 4x, 10x and 20x objectives focusing on the LN structure and cellular distribution. Use 1024 x 1024-pixel definition.
NOTE: Acquire a minimum of five images in different fields per objective per animal. - Analyze images using an image software to separate channels, add scale and colors of interest, and to reconstruct 3D view.
Wyniki
This manuscript shows techniques to remove inguinal and popliteal lymph nodes without damaging their structure following the injection of fluorescent-labeled antibodies to stain specific cell populations in these organs (Figure 1 and Figure 2).
The powerful combination of immunolabeling of LN cells with BV421 anti-CD4 and BB515 anti-CD19 and confocal imaging analysis defined the localization of T cells (CD4+) and B cells (CD19+) in inguinal and popliteal LNs. In both organs, B cell follicles were surrounded by T cell populations (Figure 3, Figure 4 and video 1), a hallmark of the LN structure1. To exclude the possibility that phagocytes lining the lymphatic sinuses could capture the injected fluorescent antibodies and result in non-specific labeling of cell markers, PE anti-F4/80 was included in the antibody mix. As shown in Figure 5, phagocytes did not internalize injected antibodies, indicating that B and T cell staining was specific. Moreover, Video 1 shows that T and B cell staining did not overlap, confirming staining specificity.
To investigate the spatial localization of phagocytic mononuclear cells in the LN, inguinal and popliteal LNs from CX3CR1GFP/+ CCR2RFP/+ were imaged. Mononuclear cells were found throughout the inguinal LN, including the subcapsular sinus. The majority of these cells were CX3CR1GFP/+, followed by CCR2RFP/+ and double positive cells (yellow) (Figure 6A-F). The same pattern of cell distribution and cell phenotypes was observed in the popliteal LN (Figure 7A-I). Both inguinal and popliteal LNs showed black regions without CX3CR1GFP/+ CCR2RFP/+, which are occupied by lymphocytes. Moreover, CX3CR1+ and CCR2+ cells were scarce in the inner area of the LNs and concentrated in the outer area, indicating that these cells primarily occupy the LN subcapsular sinus (Figure 6G-I and Figure 7J-L). Thus, the proposed protocol can clearly define major cell populations present in lymph nodes.
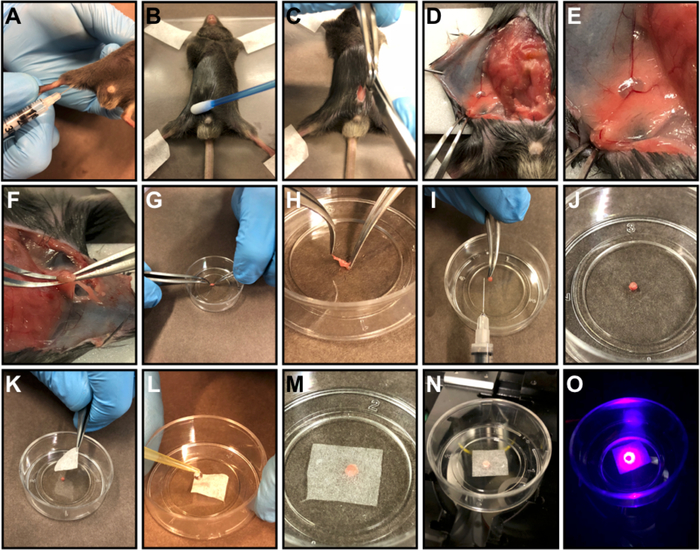
Figure 1: Inguinal lymph node preparation.
(A) Subcutaneous injection of FACS antibody master mix into the inner thigh. (B) 3 h after the injection, euthanize the mouse, immobilize the mouse on an acrylic plate with adhesive tape and apply mineral oil to the abdominal skin to prevent fur deposition around the incision. (C) Perform a midline incision in the abdomen from the pubis to the xiphoid process. (D) Dissociate the abdominal musculature from the skin and do a skin-flap. (E) Tape the skin-flap on the acrylic plate. (F) Remove the inguinal lymph node using a microsurgery curved forceps. (G-H) Place the organ in a culture dish (G) and remove the fat that surrounds the organ (H). (I) Illustrative picture showing the organ size after cleaning. J-M) Centralize the organ in the middle of a petri dish (J), cover the organ with a piece of delicate task wipers (K) and keep soaked with warm 0.9% saline or 1x PBS (L, M). (N) Position the Petri dish in the microscope slot. (O) Scan the organ. Please click here to view a larger version of this figure.

Figure 2: Popliteal lymph node preparation.
(A, B) Subcutaneous injection of FACS antibody master mix into the paw pad. (C, D) 3 h after the injection, euthanize the mouse, immobilize mouse on an acrylic plate with adhesive tape (C) and apply mineral oil to the abdominal skin to prevent fur deposition around the incision (D). (E) Perform a midline incision in the calf from the heel to the knee. (F) Expose the popliteal fossa. (G) Remove the popliteal lymph node using microsurgery-curved forceps. (H) Place the organ in a petri dish and remove the fat that surrounds the organ, centralize the organ in the middle of the Petri dish, cover the organ with a piece of delicate task wipers and keep soaked with warm saline 0.9% or 1x PBS. Position the Petri dish in the microscope slot and scan the organ. Please click here to view a larger version of this figure.
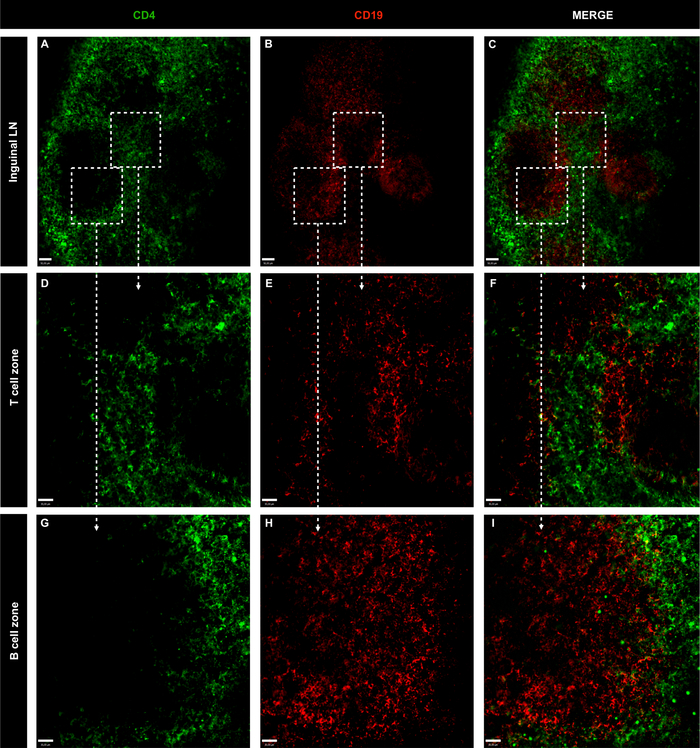
Figure 3: Representative confocal microscopy images of whole inguinal lymph nodes of non-immunized naive mice.
(A-C) LN B and T cells were stained using CD4 (green; T cells) and CD19 (red; B cells); scale bar = 50 μm. (D-I) Amplification of specific area with 10x objective; scale bar = 30 μm. Please click here to view a larger version of this figure.
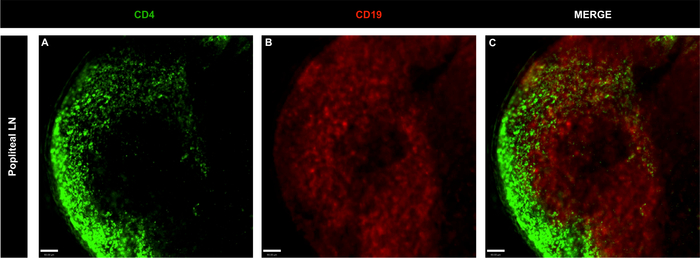
Figure 4: Representative confocal microscopy images of whole popliteal lymph nodes of non-immunized naïve mice.
(A-C) LN B and T cells were stained using CD4 (green; T cells) and CD19 (red; B cells); scale bar = 60 μm. Please click here to view a larger version of this figure.

Figure 5: Representative confocal microscopy images of whole inguinal lymph node of non-immunized naive mice showing phagocytes.
(A-C) LN B and phagocytic cells were stained using CD19 (green; B cells) and F4/80 (blue; phagocytes); scale bar = 100 μm; (D-F) LN T and phagocytic cells were stained using CD3 (green; T cells) and F4/80 (white; phagocytes); scale bar = 100 μm. Please click here to view a larger version of this figure.
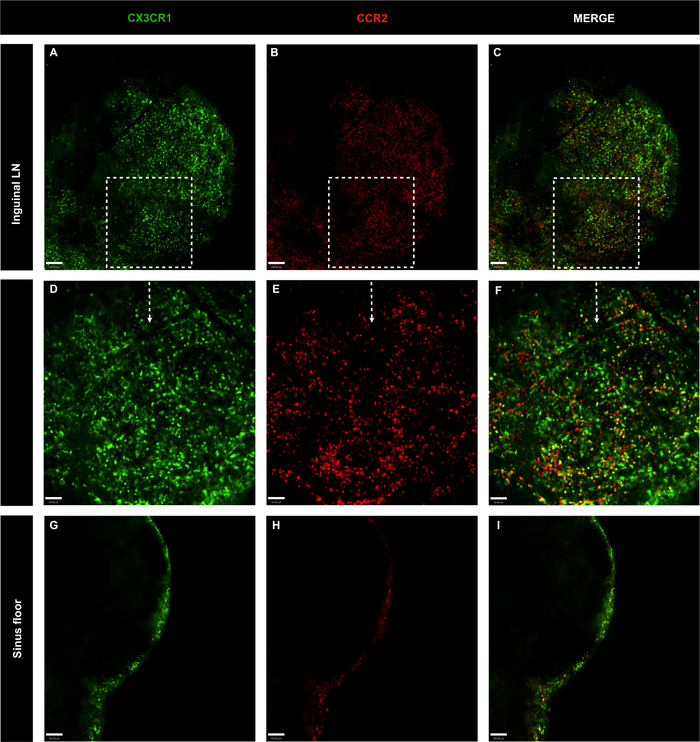
Figure 6: Confocal microscopy images of whole inguinal lymph nodes of genetically-modified CX3CR1GFP/+ CCR2RFP/+ mice without antibody master mix injection.
(A-C) LN cell distribution was evaluated with CX3CR1 (green) and CCR2 (red); scale bar = 100 μm. (D-F) Amplification of specific area with 20x objective; scale bar = 50 μm. (G-I) LN cell distribution in the lymph node sinus floor; scale bar = 100 μm. Please click here to view a larger version of this figure.
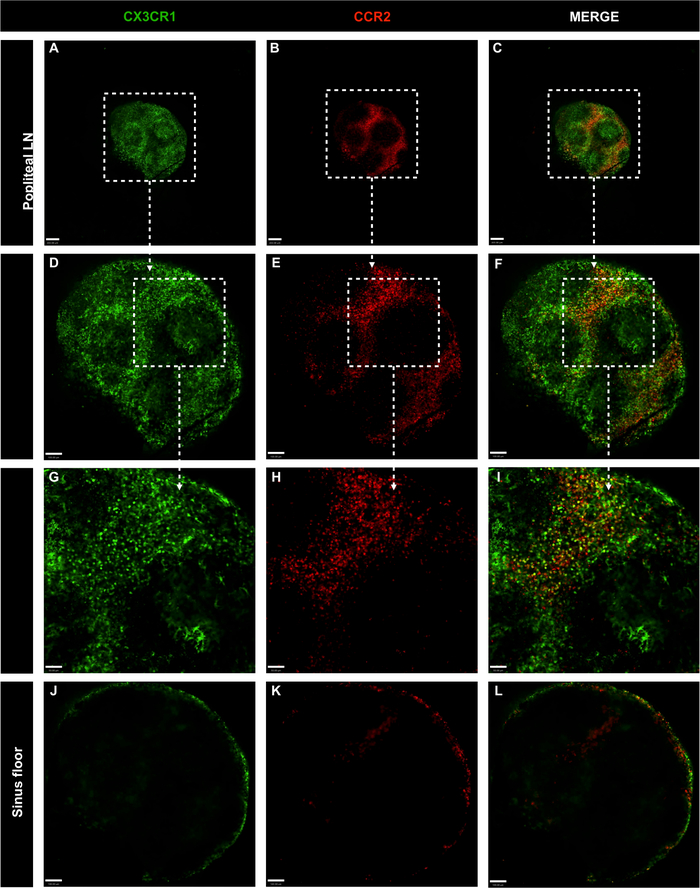
Figure 7: Confocal microscopy images of whole popliteal lymph nodes of genetically-modified CX3CR1GFP/+ CCR2RFP/+ mice without antibody master mix injection.
(A-C) LN cell distribution was evaluated with CX3CR1 (green) and CCR2 (red); scale bar = 200 μm. (D-F) Amplification of entire organ with 10x objective; scale bar = 100 μm. (G-I) Amplification of specific area with 20x objective; scale bar = 50 μm. (J-L) LN cell distribution in the lymph node sinus floor; scale bar = 100 μm. Please click here to view a larger version of this figure.

Video 1: The specificity of T and B cell staining (Right click to download).
| Laser | Laser Power | Gain | Offset | Pinhole |
| 406nm | 20% | 65 | -5 | 60μm |
| 488nm | 25% | 50 | -5 | 60μm |
| 561nm | 25% | 65 | -10 | 60μm |
Table 1: Image acquisition settings.
Dyskusje
The combination of imaging with other techniques, including molecular biology and high dimensional immunophenotyping has enhanced our ability to investigate immune cells in their native context. In fact, while other approaches may require tissue digestion and cell isolation – which can lead to loss of tissue integrity - the use of in vivo or ex vivo imaging grants a great advantage in investigating different cell subtypes in a geographical fashion3,16. It is not surprising that the availability of genetically-modified mouse strains in which cells are specifically targeted to express different fluorophores is rapidly increasing. Importantly, the combination of reporter mice and the injection of the antibody mix is a powerful tool to stain different cell populations in-vivo in the same organ4. Moreover, the popularization of gene editing tools like CRISPR/Cas9 has allowed different groups to customize their mouse strains in a way that virtually any cell type can be now imaged in their bona fide location17. Using this approach, the spatial and functional relationship between different cell types can be assessed in deep details. However, if imaging of the cell movement or dynamic events in vivo are not mandatory, a less complex experimental approach can be used. In this case, antibodies and probes are delivered in vivo, and the organ (or a sample) is directly visualized in the microscope.
Here we described a straightforward protocol that dispensed the use of tissue cryopreservation and cryosectioning that can potentially affect organ structures and allowed the appreciation of immune cells within lymph nodes following in vivo administration of fluorescent-labeled antibodies. These protocols demanded minimal technical and surgical skills and could be adapted to visualize virtually any immune cells in their original location. Importantly, we proposed that antibodies should be administered in a way that they will reach the lymph nodes using the same pathways that antigens and cells travel during an immune response. By injecting fluorescent antibodies in the subcutaneous space, it was possible to mimic all tissues and hemodynamic barriers found in vivo and estimate the chronology of antigen dissipation. In addition to this application, this method could be applied and useful for biodistribution of florescent-labeled drugs and cell-targeting studies of fluorescent-labeled nanoparticles.
However, there are limitations to this method. The amount of antibody required is higher compared to conventional histology methods; however, since conventional immunofluorescence microscopy requires several rounds of tissue preparation and staining in order to optimize the technique and obtain good images, the cost of conventional microscopy can potentially overcome the cost of the high antibody concentration employed in our protocol. Next, based on the known properties of lymphatic antigen drainage into the lymph node9,18, the efficiency of labeling is likely to rapidly decrease with the distance to the lymphatic vasculature due to the size of the labeling reagent employed. Indeed, the black areas in some of the images may result from poor tissue penetration. Only 40-100 μm in depth can be achieved with confocal imaging of LN, and thus only superficial LN regions can be visualized. One way to at least partially overcome this issue is to use fluorophores with better excitation and detection by the microscope. Another alternative approach is to use multiphoton laser microscopy with near-infrared excitation wavelength that has been key to deep tissue imaging and was shown to circumvent severe light scattering issues observed with confocal single photon laser microscopy19. In the case of imaging cells stained by antibodies that were delivered in vivo, only antigens that are expressed on the cell surface can be targeted. If antibodies used have not been validated yet, it becomes critical to perform a corresponding isotype control staining to exclude autofluorescence and validate the labeling. This can be performed in the same animal, i.e., cell targeting antibody mix injected ipsilaterally and isotype control mix injected contralaterally. In addition, the amount of antibody necessary to efficiently stain a cell in vivo may vary between experiments and cell lines and an alternative approach for this limitation is to use genetic-targeted fluorescence expression.
In conclusion, we propose a new protocol for whole lymph node imaging that maintains the tissue architectural integrity, is reproducible, easy-to-perform and use conventional confocal microscopes. This technique demonstrates how simple methods can allow regular laboratory structures to work as poly-functional platforms that enable major advances in immune system investigation.
Ujawnienia
The authors have nothing to disclose.
Podziękowania
This work was supported by the NIH (R01 AI43458 to H.L.W.).
Materiały
| Name | Company | Catalog Number | Comments |
| BV421 anti-CD4 | BD Horizon | 562891 | GK1.5; 0.2 mg mL-1 |
| BB515 anti-CD19 | BD Horizon | 564509 | 1D3; 0.2 mg mL-1 |
| BB515 Rat IgG2a, κ Isotype Control | BD Horizon | 564418 | R35-95; 0.2 mg mL-1 |
| BV421 Mouse IgG2b, K Isotype Control | BD Horizon | 562603 | R35-38 0.2 mg mL-1 |
| Cellview culture dish | Greiner-Bio | 627861 | 35x10 mm with glass bottom |
| Insulin syringes | BD Plastipak | - | Insulin U-100 |
| Kimwipes | Kimtech Science Brand | 7557 | size 21 x 20 cm / 100 sheets per box |
| Microsurgery curved forceps | WEP Surgical Instruments | custom made | 12.5 cm |
| Microsurgery curved scissors | WEP Surgical Instruments | custom made | 11.5 cm |
| Needle | BD PrecisionGlide | - | 30 gauge × ½ inch |
| Nikon Eclipse Te + A1R confocal head | Nikon | - | loaded with main 4 laser lines (405, 488, 543 and 647 nm) |
| PE anti-F4/80 | BD Pharmigen | 565410 | T45-2342; 0.2 mg mL-1 |
| PE Rat IgG2a, κ Isotype Control | BD Pharmigen | 553930 | R35-95; 0.2 mg mL-1 |
| Zeiss LSM 710 confocal microscope | Zeiss | - | loaded with main 4 laser lines (405, 488, 543 and 647 nm) |
Odniesienia
- Willard-Mack, C. L. Normal structure, function, and histology of lymph nodes. Toxicologic Pathology. 34, 409-424 (2006).
- Tas, J. M., et al. Visualizing antibody affinity maturation in germinal centers. Science. 351, 1048-1054 (2016).
- David, B. A., et al. Combination of Mass Cytometry and Imaging Analysis Reveals Origin, Location, and Functional Repopulation of Liver Myeloid Cells in Mice. Gastroenterology. 151, 1176-1191 (2016).
- Rezende, R. M., et al. gammadelta T cells control humoral immune response by inducing T follicular helper cell differentiation. Nature Communications. 9, 3151 (2018).
- Nakagaki, B. N., et al. Generation of a triple-fluorescent mouse strain allows a dynamic and spatial visualization of different liver phagocytes in vivo. Anais da Academia Brasileira de Ciencias. 91 (suppl 1), e20170317 (2019).
- Ajami, B., et al. Single-cell mass cytometry reveals distinct populations of brain myeloid cells in mouse neuroinflammation and neurodegeneration models. Nature Neuroscience. 21, 541-551 (2018).
- Becher, B., et al. High-dimensional analysis of the murine myeloid cell system. Nature Immunology. 15, 1181-1189 (2014).
- McElroy, M., et al. Fluorescent LYVE-1 antibody to image dynamically lymphatic trafficking of cancer cells in vivo. Journal of Surgical Research. 151, 68-73 (2009).
- Gerner, M. Y., Casey, K. A., Kastenmuller, W., Germain, R. N. Dendritic cell and antigen dispersal landscapes regulate T cell immunity. The Journal of Experimental Medicine. 214, 3105-3122 (2017).
- Hauser, A. E., et al. Definition of germinal-center B cell migration in vivo reveals predominant intrazonal circulation patterns. Immunity. 26, 655-667 (2007).
- Allen, C. D., Okada, T., Tang, H. L., Cyster, J. G. Imaging of germinal center selection events during affinity maturation. Science. 315, 528-531 (2007).
- Arnon, T. I., Horton, R. M., Grigorova, I. L., Cyster, J. G. Visualization of splenic marginal zone B-cell shuttling and follicular B-cell egress. Nature. 493, 684-688 (2013).
- Sipkins, D. A., et al. In vivo imaging of specialized bone marrow endothelial microdomains for tumour engraftment. Nature. 435, 969-973 (2005).
- Cinamon, G., Zachariah, M. A., Lam, O. M., Foss, F. W., Cyster, J. G. Follicular shuttling of marginal zone B cells facilitates antigen transport. Nature Immunology. 9, 54-62 (2008).
- Pereira, J. P., An, J., Xu, Y., Huang, Y., Cyster, J. G. Cannabinoid receptor 2 mediates the retention of immature B cells in bone marrow sinusoids. Nature Immunology. 10, 403-411 (2009).
- Nakagaki, B. N., et al. Immune and metabolic shifts during neonatal development reprogram liver identity and function. Journal of Hepatology. (6), 1294-1307 (2018).
- Wang, H., La Russa, M., Qi, L. S. CRISPR/Cas9 in Genome Editing and Beyond. Annual Review of Biochemistry. 85, 227-264 (2016).
- Roozendaal, R., et al. Conduits mediate transport of low-molecular-weight antigen to lymph node follicles. Immunity. 30, 264-276 (2009).
- Sarder, P., et al. All-near-infrared multiphoton microscopy interrogates intact tissues at deeper imaging depths than conventional single- and two-photon near-infrared excitation microscopes. Journal of Biomedical Optics. 18, 106012 (2013).
Przedruki i uprawnienia
Zapytaj o uprawnienia na użycie tekstu lub obrazów z tego artykułu JoVE
Zapytaj o uprawnieniaPrzeglądaj więcej artyków
This article has been published
Video Coming Soon
Copyright © 2025 MyJoVE Corporation. Wszelkie prawa zastrzeżone