16S rRNA Sequencing: A PCR-based Technique to Identify Bacterial Species
Overview
Source: Ewa Bukowska-Faniband1, Tilde Andersson1, Rolf Lood1
1 Department of Clinical Sciences Lund, Division of Infection Medicine, Biomedical Center, Lund University, 221 00 Lund, Sweden
Planet Earth is a habitat for millions of bacterial species, each of which has specific characteristics. Identification of bacterial species is widely used in microbial ecology to determine biodiversity of environmental samples and medical microbiology to diagnose infected patients. Bacteria can be classified using conventional microbiology methods, such as microscopy, growth on specific media, biochemical and serological tests, and antibiotic sensitivity assays. In recent decades, molecular microbiology methods have revolutionized bacterial identification. A popular method is 16S ribosomal RNA (rRNA) gene sequencing. This method is not only faster and more accurate than conventional methods, but also allows identification of strains that are difficult to grow in laboratory conditions. Furthermore, differentiation of strains at the molecular level enables discrimination between phenotypically identical bacteria (1-4).
16S rRNA joins with a complex of 19 proteins to form a 30S subunit of the bacterial ribosome (5). It is encoded by the 16S rRNA gene, which is present and highly conserved in all bacteria due to its essential function in ribosome assembly; however, it also contains variable regions which may serve as fingerprints for particular species. These features have made the 16S rRNA gene an ideal genetic fragment to be used in identification, comparison, and phylogenetic classification of bacteria (6).
16S rRNA gene sequencing is based on the polymerase chain reaction (PCR) (7-8) followed by DNA sequencing (9). PCR is a molecular biology method used to amplify specific fragments of DNA through a series of cycles that include:
i) Denaturation of a double stranded DNA template
ii) Annealing of primers (short oligonucleotides) that are complementary to the template
iii) Extension of primers by the DNA polymerase enzyme, which synthesizes a new DNA strand
A schematic overview of the method is shown in Figure 1.

Figure 1: Schematic overview of the PCR reaction. Please click here to view a larger version of this figure.
There are several factors that are important for a successful PCR reaction, one of which is quality of the DNA template. Isolation of chromosomal DNA from bacteria can be performed using standard protocols or commercial kits. Special care should be taken to obtain DNA that is free of contaminants that can inhibit the PCR reaction.
Conserved regions of the 16S rRNA gene permit the design of universal primer pairs (one forward and one reverse) that can bind to and amplify the target region in any bacterial species. The target region can vary in size. While some primer pairs can amplify most of the 16S rRNA gene, others amplify only parts of it. Examples of commonly used primers are shown in Table 1 and their binding sites are depicted in Figure 2.
| Primer name | Sequence (5'→3') | Forward/ reverse | Reference |
| 8F b) | AGAGTTTGATCCTGGCTCAG | forward | -1 |
| 27F | AGAGTTTGATCMTGGCTCAG | forward | -10 |
| 515F | GTGCCAGCMGCCGCGGTAA | forward | -11 |
| 911R | GCCCCCGTCAATTCMTTTGA | reverse | -12 |
| 1391R | GACGGGCGGTGTGTRCA | reverse | -11 |
| 1492R | GGTTACCTTGTTACGACTT | reverse | -11 |
Table 1: Examples of standard oligonucleotides used in amplification of 16S rRNA genes a).
a) The expected lengths of the PCR product generated using the different primer combinations can be estimated by calculating the distance between the binding sites for the forward and the reverse primer (see Figure 2), e.g. the size of the PCR product using primer pair 8F-1492R is ~1500 bp, and for primer pair 27F-911R ~900 bp.
b) also known as fD1
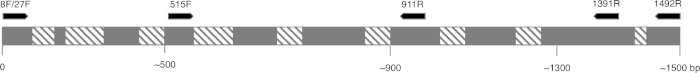
Figure 2: Representative figure of the 16S rRNA sequence and the primer-binding sites. Conserved regions are colored in grey and variable regions are filled with diagonal lines. To allow for the highest resolution, primer 8F and 1492R (name based on location on rRNA sequence) are used to amplify the whole sequence, allowing for the sequencing of several variable regions of the gene. Please click here to view a larger version of this figure.
Cycling conditions for PCR (i.e. the temperature and time required for the DNA to be denatured, annealed with primers, and synthesized) are dependent on the type of polymerase that is used and the properties of the primers. It is recommended to follow the manufacturer's guidelines for a particular polymerase.
After the PCR program is completed, the products are analyzed by agarose gel electrophoresis. A successful PCR yields a single band of expected size. The product must be purified prior to sequencing to remove residual primers, deoxyribonucleotides, polymerase, and buffer which were present in the PCR reaction. The purified DNA fragments are usually sent for sequencing to commercial sequencing services; however, some institutions perform DNA sequencing at their own core facilities.
The DNA sequence is automatically generated from a DNA chromatogram by a computer and must be carefully checked for quality, as manual editing is sometimes needed. Following this step, the gene sequence is compared with sequences deposited in the 16S rRNA database. The regions of similarity are identified, and the most similar sequences are delivered.
Procedure
1. Set up
- While handling microorganisms, it is required to follow good microbiological practice. All microorganisms, especially unknown samples, should be treated as potential pathogens. Follow aseptic technique to avoid contaminating the samples, researchers, or the laboratory. Wash hands before and after handling bacteria, use gloves, and wear protective clothing.
- Carry out a risk assessment for the experimental protocol for the genomic DNA isolation and PCR product purification. Some reagents may be harmful!
- Pure culture is essential for the 16S rRNA sequencing. Before proceeding to isolation of genomic DNA, make sure the starting material is entirely pure. This can be done by streak plating to isolate individual colonies. These can be further grown streaked on plates individually, or in broth, if needed.
- Laboratory equipment required:
- Thermal cycler for PCR. The function of the thermal cycler is to raise and lower temperature according to a set program. While creating the program you will be asked to enter the temperature and time values for every PCR step as well as total number of cycles.
- Agarose gel electrophoresis system. It is used to separate DNA fragments based on their size and charge. In this protocol, agarose gel electrophoresis will be used to visualize the quality of isolated genomic DNA and PCR products.
2. Protocol
Note: The demonstrated protocol applies to 16S rRNA gene sequencing from a pure culture of bacteria. It does not apply to metagenomic studies.
- Culturing bacteria for isolation of genomic DNA (gDNA).
- Grow your microorganism on a suitable medium. Both liquid and solid media can be used in this step. Choose conditions that yield the best growth. While planning the experiment, keep in mind that slow-growing bacteria may need several days to reach the late-log/stationary growth phase. In this protocol, Bacillus subtilis 168 was grown in lysogeny broth (LB) overnight in a shaking incubator set at 200 rpm, 37°C.
- Isolation of gDNA.
- If bacteria were grown on solid medium, scrape some cells using a sterile loop and resuspend them in 1 mL of distilled water
- If bacteria were grown in liquid medium, use approximately 1.5 mL of an overnight culture.
- Pellet the cells by centrifugation (1 minute, 12,000 - 16,000 × g), remove the supernatant, and use the cells for gDNA isolation using a commercial kit or standard protocols [e.g. CTAB total DNA preparation (13) or phenol-chloroform extraction (14)]. Here, a commercial kit was used to isolate gDNA from 1.5 mL of B. subtilis 168 overnight culture, OD600 = 1.5.
Note 1: For some Gram-negative bacteria this step can be omitted and replaced by simple release of DNA from cells by boiling. Resuspend bacterial pellet in distilled water and incubate in a heating block set at 100 °C for 10 minutes.
Note 2: Gram-positive bacterial cells are difficult to disrupt. It is therefore recommended to choose a gDNA isolation method or kit that is dedicated to isolation from this group of bacteria.
- gDNA quality check.
- Check the quality of the isolated gDNA by agarose gel electrophoresis. First, mix 5 µL of the isolated gDNA with 1 µL of the loading dye (6x), and load the sample on a 0.8% agarose gel that contains a DNA staining reagent.
- Load a molecular mass standard and run the electrophoresis until the dye front reaches the bottom of the gel.
- Once the electrophoresis is completed, visualize the gel on a suitable transilluminator (either UV or blue light). gDNA appears as a thick high molecular band (above 10 kb). An example of the gDNA quality check is shown in Figure 3.
- If the gDNA passes the quality control (i.e. the high molecular band is present and there is little-to-no smearing of the gDNA), dilute your gDNA serially by first labelling 3 microcentrifuge tubes as follows: "10x", "100x" and "1000x".
- Pipette 90 µL of sterile distilled water into each of the 3 tubes.
- Take 10 µL of the gDNA solution and add it to the tube marked "10x".
- Pipet the whole volume (i.e. 100 µL) up and down thoroughly to ensure the solution is mixed uniformly. Then, take 10 µL of the solution from this tube and transfer it to the tube marked "100x".
- Mix as described before and repeat the same procedure by transferring 10 µL of the solution from tube "100x" to the tube "1000x". These dilutions will be used as template in the PCR reaction.

Figure 3: Agarose gel electrophoresis of gDNA isolated from Bacillus subtilis. Lane 1: M - molecular mass marker (from top to bottom: 10000 bp, 8000 bp, 6000 bp, 5000 bp, 4000 bp, 3500 bp, 3000 bp, 2500 bp, 2000 bp, 1500 bp, 1000 bp). Lane 2: gDNA - genomic DNA isolated from Bacillus subtilis. Please click here to view a larger version of this figure.
- Amplification of the 16S rRNA gene by PCR.
Note: The PCR protocol below is optimized for a particular DNA polymerase and primer pair 8F - 1492R (see Table 1). Optimization of the protocol is required for each polymerase and primer pair.- Thaw all reagents on ice.
- Prepare the PCR master mix as shown in Table 2. Since the DNA polymerase is active at room temperature, the reaction setup must be performed on ice, i.e. the PCR tubes and the reaction components should be kept on ice all the time. Prepare one reaction per each gDNA sample and one reaction for negative control. Negative control is a PCR mix without the gDNA template and is used to ensure that the other components of the reaction are not contaminated.
Note: In case of multiple samples, a master mix is commonly prepared. Master mix is a solution containing all the reaction components except the template. It helps to omit repetitive pipetting, avoid pipetting error, and ensures high consistency between the samples. To prepare master mix, multiply the volume of each component (except the DNA template) by the number of samples tested. Mix all the components in microcentrifuge tube and pipet the whole volume up and down several times. - Aliquot 49 µL of the master mix into the individual PCR tubes.
- Add 1 µL template into tubes with master mix. For negative control add 1 µL of sterile water. To ensure that the components are well mixed, gently pipet the mix up and down ~10 times with a pipette set to 30-50µL.
- Set the PCR machine with the program shown in Table 3.
- Put the tubes in the PCR machine and start the program.
- Once the program is completed, examine the quality of your PCR product by agarose gel electrophoresis.
- A successful PCR reaction using the 8F-1492R primer pair yields a single band of approximately 1.5 kb (Figure 4). If other bands (i.e. unspecific products) are present, optimize the PCR program by adjusting the annealing temperature. If a single band of expected size is present, proceed to the next step. Here, the PCR reaction with 100x diluted gDNA template yielded the best product as it had a sharp band of expected size and lacked unspecific products. Hence it was chosen to be purified and sent for sequencing.
- Prior to sequencing, the product must be cleaned up from residual primers, deoxyribonucleotides, polymerase, and buffer which were present in the PCR reaction. The PCR products can be isolated using a commercial PCR purification kit. The PCR reaction is loaded on a column that contains a DNA-binding matrix. The PCR product binds to the column, while other components flow through the column. The column is then washed using washing buffer, and finally, the DNA is eluted in the buffer of choice. Confirm that the elution buffer that is supplemented with the kit is compatible with sequencing.
- Send the purified PCR product for DNA sequencing. Follow the guidelines for the submission of sequencing samples at the chosen sequencing facility. For the best sequence coverage, use the PCR amplification primers (the same as used in the section 2.4.1) as sequencing primers. Here, primers 8F and 1492R were used for sequencing the PCR product.
| Component | Final concentration | Volume per reaction | Volume per x reactions (master mix) |
| 5x reaction buffer | 1x | 10 µL | 10 µL × x |
| 10 mM dNTPs | 200 µM | 1 µL | 1 µL × x |
| 10 µM Primer 8F | 0.5 µM | 2.5 µL | 2.5 µL × x |
| 10 µM Primer 1492R | 0.5 µM | 2.5 µL | 2.5 µL × x |
| Phusion polymerase | 1 unit | 0.5 µL | 0.5 µL × x |
| Template DNA * | - | 1 µL | - |
| ddH2O | - | 32.5 µL | 32.5 µL × x |
| Total volume | 50 µL | 49 µL × x |
Table 2: PCR reaction components. * use the 10x, 100x or 1000x diluted gDNA from step 2.3.
| Step | Temperature | Time | Cycles |
| Initial denaturation | 98°C | 30 sec | |
| Denaturation | 98°C | 10 sec | 25-30 |
| Annealing | 60°C | 30 sec | |
| Extension | 72°C | 45 sec | |
| Final extension | 72°C | 7 min | |
| Hold | 4°C | ∞ |
Table 3: PCR program for the amplification of the 16S rRNA gene.

Figure 4: Agarose gel electrophoresis of PCR products amplified using primers 8F and 1492R and gDNA as a template. The gDNA sample from B. subtilis (see Figure 3) was diluted 10, 100 and 1000 times in order to test for the best outcome. Lane 1: M - molecular mass marker (from top to bottom: 10000 bp, 8000 bp, 6000 bp, 5000 bp, 4000 bp, 3500 bp, 3000 bp, 2500 bp, 2000 bp, 1500 bp, 1000bp, 750 bp, 500 bp, 250 bp). Lane 2: PCR reaction with 10x diluted template. Lane 3: PCR reaction with 100x diluted template. Lane 4: PCR reaction with 1000x diluted template. Lane 5: (C-) - negative control (reaction without the DNA template). Please click here to view a larger version of this figure.
3. Data analysis and results
Note: The PCR product is sequenced using the forward (here 8F) and the reverse (here 1492R) primers. Therefore, two sets of data sequence are generated, one for the forward and one for the reverse primer. For each sequence at least two types of file are generated: i) a text file containing the DNA sequence and ii) a DNA chromatogram, which shows the quality of the sequencing run.
- For the forward primer, open the chromatogram, and carefully examine the sequence. An ideal chromatogram for a quality sequence should have evenly spaced peaks and little or no background signals (Figure 5A).
- If the chromatogram is not high quality, the sequence should be discarded, or the sequence text file should be revised according to the following:
- The presence of double peaks throughout the chromatogram indicates the presence of multiple DNA templates. This can be the case if the bacterial culture was not pure. Such a sequence should be discarded (Figure 5B).
- An ambiguous chromatogram might arise from the presence of different colored peaks in the same location. One of the most common errors is the presence of two different colored peaks in the same position and improper assigning of the bases by the sequencing software (Figure 5C). Manually correct any incorrectly assigned nucleotides and edit them in the text file.
- Low resolution chromatograms can result in "broad peaks" that often cause mis-counting of the nucleotides in these regions (Figure 5D). This error is difficult to correct, and therefore possible mismatches in the further alignment step should not be treated as reliable.
- Poor chromatogram reading quality and the presence of multiple peaks is commonly seen at the 5' and 3' ends of the sequence. Some sequencer software removes these low-quality fragments automatically (Figure 5E), and the nucleotides are not included in the text file. If your sequence was not truncated automatically, determine the low-quality fragments (e.g. weak signal, overlapping peaks, loss of resolution) at the ends and remove the respective bases from the text file.
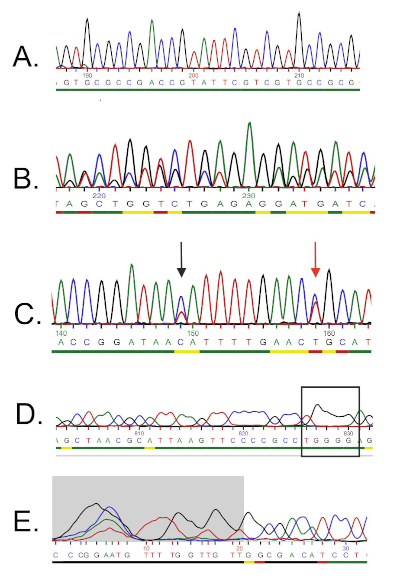
Figure 5: Examples of DNA sequencing troubleshooting. A) An example of a quality chromatogram sequence (evenly-spaced, unambiguous peaks). B) Poor quality sequence that usually occurs at the beginning of the chromatogram. The grey-zone area is considered low quality and automatically removed by the sequencing software. More bases can be trimmed manually. C) Presence of double-peaks (indicated by arrows). A nucleotide that is indicated by the red arrow has been read by the sequencer as "T" (red peak), but the blue peak is stronger, and it can also be interpreted as "C". D) Overlapping peaks indicate DNA contamination (i.e. more than one template). E) Loss of resolution and so called "broad peaks" (marked by rectangle) that prevent reliable base-calling. Please click here to view a larger version of this figure.
- Repeat 3.1 and 3.2 for the reverse primer.
- Finally, assemble the forward and reverse sequences into one contiguous sequence. A good sequencing run yields a sequence of up to 1100 bp. Considering that the PCR product is ~1500 bp long, the sequences obtained using forward and reverse primers should partially overlap.
- Merge the two sequences using the DNA sequence assembly program, e.g. a free tool such as CAP3 (http://doua.prabi.fr/software/cap3) (15).
- Insert the two sequences in FASTA format into the indicated box. Click the "Submit" button and wait for the results to return.
- To view the assembled sequence press "Contigs" in the result tab. To view the details of the alignment press "Assembly details".
Note 1: If CAP3 software is used for contig assembly there is no need to convert the reverse primer sequence into reverse-complementary; however, this step might be needed if another program is used.
Note 2: FASTA format is a text-based format to represent the nucleotide sequence. The first line (the description line) in a FASTA file starts with a symbol ">" followed by the name or a unique identifier of the sequence. Following the description line is the nucleotide sequence. Paste your sequences in the following format:
>sequence_frw_primer
paste your sequence from the text file here
>sequence_rvs_primer
paste your sequence from the text file here
- Conduct a database search by visiting the website for the Basic Local Alignment Search Tool (BLAST; https://blast.ncbi.nlm.nih.gov/Blast.cgi).
- Select the "Nucleotide BLAST" tool to compare your sequence to the database.
- Enter your sequence (the contig assembled in 3.5) into the "Query sequence" text box, then select the database "16S rRNA sequences (Bacteria and Archea)" in the scroll down menu.
- Press the "BLAST" button on the bottom of the page. The most similar sequences will be returned. An example BLAST result is shown in Figure 6. In the presented experiment the top hit is B. subtilis strain 168, showing 100% identity with the sequence available in the BLAST database.
- If the top hit does not show 100% identity, go to the alignment and check for mismatches. Upon clicking on the top hit, you will be directed to the details of the alignment. Aligned nucleotides will be joined by short vertical lines while mismatched nucleotides have a gap between them. Return to the chromatogram that you received from the sequencing company and revise the sequence once again with the focus on the mismatched region. Correct the sequence if any additional errors are found. Run BLAST again using the corrected sequence.
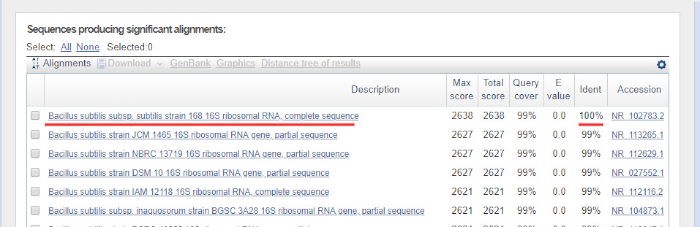
Figure 6: Example of the nucleotide BLAST outcome. 16S rRNA gene sequence from pure culture of B. subtilis 168 was used as a query sequence. The top hit shows 100% identity (underlined) to the B. subtilis strain 168, as expected. Please click here to view a larger version of this figure.
Application and Summary
Identifying bacterial species is important for different researchers, as well as for those in healthcare. 16S rRNA sequencing was initially used by researchers to determine phylogenetic relationships between bacteria. In time, it has been implemented in metagenomic studies to determine biodiversity of environmental samples and in clinical laboratories as a method to identify potential pathogens. It enables a quick and accurate identification of bacteria present in clinical samples, facilitating earlier diagnosis and faster treatment of patients.
References
- Weisburg, W.G., Barns, S.M., Pelletier, D.A. and Lane D.J. 16S ribosomal DNA amplification for phylogenetic study. J Bacteriol. 173 (2): 697-703. (1991)
- Drancourt, M., Bollet, C., Carlioz, A., Martelin, R., Gayral, J.P., Raoult D. 16S ribosomal DNA sequence analysis of a large collection of environmental and clinical unidentifiable bacterial isolates. J Clin Microbiol. 38 (10):3623-3630. (2000)
- Woo, P.C., Lau, S.K., Teng, J.L., Tse, H., Yuen, K.Y. Then and now: use of 16S rDNA gene sequencing for bacterial identification and discovery of novel bacteria in clinical microbiology laboratories. Clin Microbiol Infect. 14 (10):908-934. (2008)
- Tang, Y.W., Ellis, N.M., Hopkins, M.K., Smith, D.H., Dodge, D.E., Persing, D.H. Comparison of phenotypic and genotypic techniques for identification of unusual aerobic pathogenic gram-negative bacilli. J Clin Microbiol. 36 (12):3674-3679. (1998)
- Tsiboli, P., Herfurth, E., Choli, T. Purification and characterization of the 30S ribosomal proteins from the bacterium Thermus thermophilus. Eur J Biochem. 226 (1):169-177. (1994)
- Woese, C.R. Bacterial evolution. Microbiol Rev. 51 (2):221-271. (1987)
- Bartlett, J.M., Stirling, D. A short history of the polymerase chain reaction. Methods Mol Biol. 226:3-6. (2003)
- Wilson, K.H., Blitchington, R.B., Greene, R.C. Amplification of bacterial 16S ribosomal DNA with polymerase chain reaction. J Clin Microbiol. 28 (9):1942-1946. (1990)
- Shendure, J., Balasubramanian, S., Church, G.M., Gilbert, W., Rogers, J., Schloss, J.A., Waterston, R.H. (2017) DNA sequencing at 40: past, present and future. Nature. 550:345-353.
- Lane, D.J. 16S/23S rRNA sequencing. (1991) In Nucleic acid techniques in bacterial systematics. (Goodfellow, M. and Stackebrandt, E., eds.) p.115-175. Wiley and Sons, Chichester, United Kingdom.
- Turner, S., Pryer, K.M., Miao, V.P., Palmer, J.D. (1999) Investigating deep phylogenetic relationships among cyanobacteria and plastids by small subunit rRNA sequence analysis. J Eukaryot Microbiol. 46:327-338.
- Fredricks, D.N., Relman, D.A. (1998) Improved amplification of microbial DNA from blood cultures by removal of the PCR inhibitor sodium polyanetholesulfonate. J Clin Microbiol. 36:2810-2816.
- Wilson, K. Preparation of genomic DNA from bacteria. (2001) Curr Protoc Mol Biol. Chapter 2:Unit 2.4.
- Wright, M. H., Adelskov, J., Greene, A.C. (2017) Bacterial DNA extraction using individual enzymes and phenol/chloroform separation. J Microbiol Biol Educ. 18:18.2.48.
- Huang, X., Madan, A. (1999). CAP3: A DNA sequence assembly program. Genome Res. 9:868-877.
Skip to...
Videos from this collection:

Now Playing
16S rRNA Sequencing: A PCR-based Technique to Identify Bacterial Species
Microbiology
188.0K Views

Creating a Winogradsky Column: A Method to Enrich the Microbial Species in a Sediment Sample
Microbiology
128.5K Views

Serial Dilutions and Plating: Microbial Enumeration
Microbiology
314.3K Views

Enrichment Cultures: Culturing Aerobic and Anaerobic Microbes on Selective and Differential Medias
Microbiology
131.8K Views

Pure Cultures and Streak Plating: Isolation of Single Bacterial Colonies from a Mixed Sample
Microbiology
165.7K Views

Growth Curves: Generating Growth Curves Using Colony Forming Units and Optical Density Measurements
Microbiology
293.5K Views

Antibiotic Susceptibility Testing: Epsilometer Tests to Determine MIC Values of Two Antibiotics and Evaluate Antibiotic Synergy
Microbiology
93.5K Views

Microscopy and Staining: Gram, Capsule, and Endospore Staining
Microbiology
362.6K Views

Plaque Assay: A Method to Determine Viral Titer as Plaque Forming Units (PFU)
Microbiology
185.8K Views

Transformation of E. coli Cells Using an Adapted Calcium Chloride Procedure
Microbiology
86.3K Views

Conjugation: A Method to Transfer Ampicillin Resistance from Donor to Recipient E. coli
Microbiology
38.1K Views

Phage Transduction: A Method to Transfer Ampicillin Resistance from Donor to Recipient E. coli
Microbiology
28.9K Views
Copyright © 2025 MyJoVE Corporation. All rights reserved