Dye-sensitized Solar Cells
Overview
Source: Tamara M. Powers, Department of Chemistry, Texas A&M University
Today's modern world requires the use of a large amount of energy. While we harness energy from fossil fuels such as coal and oil, these sources are nonrenewable and thus the supply is limited. To maintain our global lifestyle, we must extract energy from renewable sources. The most promising renewable source, in terms of abundance, is the sun, which provides us with more than enough solar energy to fully fuel our planet many times over.
So how do we extract energy from the sun? Nature was the first to figure it out: photosynthesis is the process whereby plants convert water and carbon dioxide to carbohydrates and oxygen. This process occurs in the leaves of plants, and relies on the chlorophyll pigments that color the leaves green. It is these colored molecules that absorb the energy from sunlight, and this absorbed energy which drives the chemical reactions.
In 1839, Edmond Becquerel, then a 19-year old French physicist experimenting in his father's lab, created the first photovoltaic cell. He illuminated an acidic solution of silver chloride that was connected to platinum electrodes which generated a voltage and current.1 Many discoveries and advances were made in the late 19th and first half the 20th century, and it was only in 1954 that the first practical solar cell was built by Bell Laboratories. Starting in the 1950s, solar cells were used to power satellites in space.2
Solar cells are electrical devices that utilize light to create a current. This video demonstrates preparation and testing of one such type of cell, the dye-sensitized solar cell (DSSC). First invented at UC Berkeley by Brian O'Regan and Michael Grätzel, Grätzel pursued this work at the École Polytechnique Fédérale de Lausanne in Switzerland, culminating in the first highly efficient DSSC in 1991.3 These solar cells, like plants, use a dye to help harness energy from the sun.
Principles
Band Theory:
When two atoms come together to form molecular orbitals, two orbitals are formed, one with a bonding and the other with an antibonding symmetry.4 These are separated by a certain amount of energy. When n atoms come together to form molecular orbitals, such as in a solid, n molecular orbitals form. When n is large, the number of orbitals that are closely spaced in energy is likewise large. The result is a band of orbitals of similar energy (Figure 1). Electrons from the atoms reside in these bands. The valance band is the highest energy band that is populated with electrons. It is akin to the highest occupied molecular orbital (HOMO) of molecules. The conduction band is the lowest band that is not populated by electrons, and is akin to the lowest unoccupied molecular orbital (LUMO) of molecules. The band gap is the energy difference between these two bands.
When the band gap is large, the solid material is an insulator: electrons cannot freely flow within the material (Figure 1). By contrast, conductors are those in which the valance-conduction band gap is blurred. In a conductor, such as a metal, applying a voltage raises some of the electrons in the valence band to the conduction band. These excited electrons are free to move. The electrons leave behind positive holes, which are also free to move. In reality, the holes do not move, but rather electrons move to fill the positive holes. In conductors, as the temperature increases, molecular vibrations increase, thereby obstructing the flow of electrons and decreasing the conductivity.
Semiconductors are materials which act as insulators at 0 Kelvin, but become conductors as the temperature increases (Figure 1). This is because the band gap-the energy between the valence and conduction band-is small, so thermal energy is sufficient enough to excite electrons into the conduction band. Typical intrinsic semiconductors include silicon and germanium.
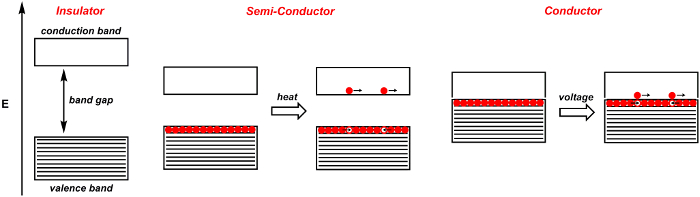
Figure 1. Band diagram for an insulator, semiconductor, and conductor. Shaded bands are filled with electrons, while white bands are empty. Discrete electrons are indicated by a red sphere, while discrete holes are indicated by a white sphere.
Photovoltaic Effect:
When light hits a semiconductor, it can excite an electron from the valence band to the conduction band. This electron can then recombine with the hole it left behind, resulting in no net flow of electrons. Or, it can move through the semiconductor, around a circuit, and recombine with a hole at the other end of the circuit. This flow of electrons created from exposure to sunlight is termed the photovoltaic effect. This latter scenario is desired to generate electricity, and thus systems must be designed to favor this over recombination.
One way to favor this is to design cells with a p-n junction, i.e., a junction between an n- and p-doped semiconductor. These are semiconductors whereby some of the atoms have been replaces be neighboring atoms on the periodic table. In n-doped semiconductors, these are replaced by atoms that have more electrons, and in p-doped semiconductors, these are replaced by atoms that have fewer electrons. "Traditional" silicon-based solar cells make use of this approach.
However, an emerging type of solar cells are DSSC, often referred to as the Grätzel cell.5 These are promising in that they are semi-translucent, and their cost is significantly less. These solar cells still make use of semiconductors, but it is a dye that is used to absorb the light from the sun.
Components of a DSSC:
There are many components to a DSSC, which is shown in Figure 2.
Dye
To promote the photovoltaic effect, a DSSC makes use of dyes. The dye molecule absorbs light, promoting an electron from a bonding orbital to an anti-bonding orbital. This excited electron can then drop back down to the bonding orbital, resulting in no flow of electrons. Or, it can be injected into a semiconductor, the productive pathway of a DSSC. This leaves behind a hole, which must be filled to complete the circuit. For the productive pathway, the energy of the excited-state electron in the dye must be greater than the conduction band of the semiconductor. The dye should also absorb much of the solar spectrum, to improve efficiency of the cell. Typical dyes are Ruthenium (Ru)-based, and hence limits a DSSC, as this metal is not very economical.
In this experiment, we will be utilizing a natural dye (anthocyanins) found in some berries, such as blackberries and raspberries. The structure of the anthocyanin dye must feature several =O or -OH groups, which allow for the dye to bind to the TiIVO2 surface (Figure 3).6
Semiconductor
The excited electron then flows to the conduction band of the semiconductor. The semiconductor we will be using in this experiment is TiO2.
Anode
The electron flows from the semiconductor to the anode, which in this case, is SnO2-coated glass. The SnO2 allows for a conductive surface on the glass, which otherwise would be an insulator.
Cathode
After passing through a load, the electron comes to the cathode, which is likewise covered in SnO2. The cathode is additionally covered with a catalyst, in this case, graphite, which helps promote the redox reaction of the mediator.
Mediator
The electron passes from the cathode to I3-, reducing it to I-. This reduced molecule can then donate an electron to the hole left behind in the dye molecule, completing the circuit. This process regenerates I3-. The difference between the I3-/I- cell potential and the Fermi level corresponds to the open circuit potential of the solar cell, or the maximum voltage that can be produced with the cell.
In this video, a DSSC is prepared and its performance is evaluated.
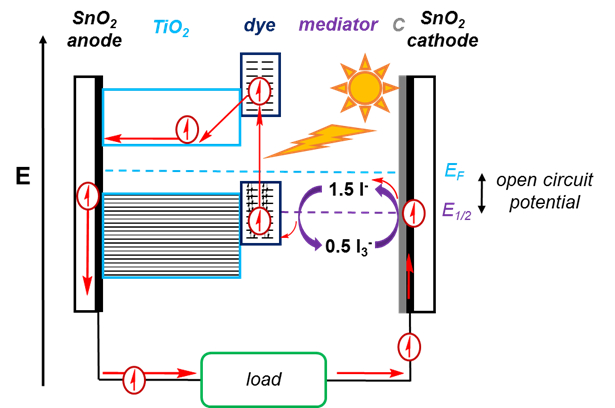
Figure 2. Schematic of a DSSC. Sunlight is absorbed by the dye, raising an electron to an anti-bonding orbital in the dye. This electron then moves to the TiO2 conduction band, leaving behind a hole. The electron goes around the circuit and passes a load, and is used to reduce I3- to I-, which is then oxidized back to I3- as the electron fills the hole left in the dye.

Figure 3. Anthocyanin pigment found in some berries will chelate to the TiO2 surface.
Procedure
1. Preparation of TiO2 Paste
- Mass out 6 g of colloidal TiO2 powder, and place it in a mortar.
- Carefully add 2-3 mL of vinegar to the TiO2, and begin grinding the suspension with the pestle until a uniform paste is obtained. The grinding serves to break up aggregated clumps in the powder.
- Continue adding vinegar, in ~ 1 mL increments while grinding, up to ~ 9 mL total volume. Prior to each addition, the consistency of the paste should be uniform and free of lumps. The final paste should be thick, but not so thick that it cannot be squeezed out of a dropper bottle.
- Add 1 drop of dish soap to 1 mL of distilled water, gently mix.
- Add the dish soap solution to the TiO2 suspension and gently mix, being careful not to produce bubbles.
- Allow the suspension to equilibrate for 15 min. The dish soap serves as a surfactant, to help make the suspension more readily spread out into a uniform film on the glass.
2. Deposition of TiO2 on Glass
- Clean two conductive glass slides. Soak a kimwipe with ethanol and use it to wipe clean two conductive glass slides. Place the clean slides on a fresh kimwipe.
- Determine which side of the glass is conductive. Using a multimeter set to ohms, touch both leads to one side of the glass. If a reading between 10 and 30 Ω is observed, it is the conductive side. A reading of 0 Ω indicates the non-conductive side.
- Mask the slide. Place one glass slide with its conductive side up and the other with its conductive side down. Carefully keeping the slides touching, tape the glass slides to the bench top. Place tape on three of the four sides of the slides, making sure that ~ 5-8 mm of the slide is covered by tape on each of the three sides (Figure 4). Press the tape firmly, to ensure that there are no air bubbles.
- Apply the TiO2 paste. Using a glass rod, apply a thin line of paste across the masked top edge of the slide. Use the glass rod to carefully roll the paste down the length of the slide, and back up. Repeat this motion 2-3x without lifting the rod, or until a uniform film is obtained.
- If the film is not uniform, simply wipe it off with a kimwipe, clean the glass with ethanol, and once dry, try again.
- Allow the film to dry a little, then carefully remove the tape from the glass. The slide with the TiO2 film should be on the conductive side. The other slide can be cleaned and used later.
- Anneal the TiO2 film. Carefully place the slide (TiO2 side up) on a hot plate that is set to 450 °C. Watch as the TiO2 darkens to a purple/brown color, and regains its white color. At this point, turn the hotplate off and allow the film to slowly cool. If the slide is cooled too quickly, it may crack or shatter.
- With a ruler, measure the surface area that is covered with the film, and note this value.

Figure 4. Deposition of TiO2 on glass.
3. Stain the TiO2 Film with Dye
- Place a few blackberries, raspberries, or cherries in a mortar and crush them with a pestle.
- Filter the solution through a coffee filter and into a Petri dish. It may be necessary to add a few mL of water to the juice.
- Place the cooled TiO2 film, face side down in the Petri dish. Be careful to not scratch off any TiO2. Allow the dye to be adsorbed onto the film. This may take several minutes.
- Once the film is fully coated (it should be dark red or purple and there are no white spots), lift the slide up with tongs (be careful to only tough the glass and not the film), and rinse the slide with water, then ethanol. Blot the film dry with a kimwipe, and use immediately.
- If not used immediately, then store the film in a Petri dish that contains acetic acid at pH 3-5, and cover the dish with the lid and wrap in foil.
4. Prepare the Counter Electrode
- Using another conductive glass slide, follow steps 2.1-2.2.
- Apply the carbon catalyst on the conductive side. Using tweezers, hold the slide, conductive side down, over the tip of a Bunsen burner. Move the slide around so that the soot collects on the entire surface, but for no longer than 30 s. Let the slide cool, and wipe the soot along one side of the slide with a cotton swab.
- Alternatively, using an HB pencil, cover the entire conductive surface with graphite. This gives a more robust electrode, but one that performs less well.
5. Assemble the Solar Cell
- Dry the stained film. Rinse it with ethanol and place it on a kimwipe. Gently blot the film with a second kimwipe. The film must be dry as to not impact the electrolyte solution.
- With the electrode film side up, gently place the carbon coated electrode on top (carbon face down). Be sure to offset the slides so that the exposed sides of both electrodes can be clipped to wires. Place two binder clips on the sides adjacent to the offset glass.
- Place a few drops of the electrolyte solution along one edge of the slides, and carefully open/close each side of the cell by alternately opening/closing the binder clips. Be sure that all of the stained area is in contact with the electrolyte solution, and repeat step 5.2 if necessary.
- Wipe off the excess electrolyte from the exposed areas using kimwipes and ethanol.
- Fasten alligator clips to the two exposed sides of the solar cell.
6. Measuring Cell Performance
Note: Ideally, these measurements are to be done outside. However, if the weather is not permitting, they can be done inside using a halogen lamp. All measurements should be done with no movement of the cell so that they are performed under identical conditions.
- Be sure to orient the cell so that the TiO2 film is facing up towards the sun, and place a polycarbonate cover over the cell. This protects the cell from UV damage.
- Connect the negative electrode (TiO2-coated glass) to the negative wire of the multimeter, and the positive electrode (C) to the positive wire of the multimeter (Figure 5).
- Set the multimeter to volts, and measure the voltage. This is the open circuit potential (maximum voltage at zero current). Cover the cell (with a hand or a solid object) to ensure that the voltage decreases.
- Set the multimeter to milliamperes (mA), and measure the maximum current. This is the short circuit current (maximum current at zero voltage). Cover the cell with (with a hand) to ensure that the current decreases.
- Record a full current-voltage curve using a 500-Ω potentiometer as a variable load.
- Determine which lead on the potentiometer is the central tap. This lead allows for the resistance to be varied. To do this, connect the multimeter (set to ohms) to two of the leads on the potentiometer, and vary the resistance on the potentiometer. Note if the resistance changes. Repeat this with the other two combinations of leads. Changes in resistance should be observed in two of the three combinations. The lead that was used in both combinations that gave changes is the central tap, and the other two are functionally identical.
- Assemble the circuit as shown in Figure 5 (right).
- Set the potentiometer to full (or zero) resistance, and note the current and voltage.
- Change the resistance on the potentiometer in small increments and note the current and voltage so that there are several points that span the entire range of the potentiometer. Be sure to not move the cell during these measurements. Once the current starts to change, be sure to collect many data points; fewer data points may be obtained when it is constant.
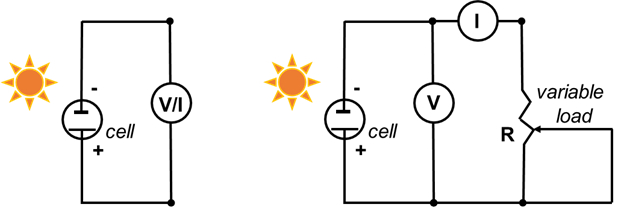
Figure 5. Circuit diagram to measure the open-circuit potential and short circuit current (left, steps 6.3 and 6.4), and to record the I-V curve (right).
Results
For each data point collected in steps 6.5.3-6.5.4, calculate the current density (mA/cm2) and the power density (mW/cm2). To calculate the current density, divide the current by the surface area of the film that was determined in step 2.7. To calculate the power density, multiply the voltage by current density. Plot the current (mA) versus voltage (mV) for the data collected in steps 6.3, 6.4, and 6.5.3-6.5.4. Plot the current density versus volts for all the data. This should be near the "knee" of the curve. Determine the sunlight to electrical energy conversion efficiency by dividing the maximum power (mW/cm2) by the incoming solar power (taken to be 800-1,000 W/m2), and multiplying by 100%.
The analysis of data and preparation of I-V curves is standard in the solar cell literature as a means to compare the performance of cells. The open-circuit voltage measured should be between 0.3 and 0.5 V, and a short circuit potential of 1-2 mA/cm2 should be obtained.
Application and Summary
This video showed the preparation and analysis of a simple DSSC.
Solar cells are becoming more common, and there is much research being done to advance their performances. Traditional solar cells that are based on silicon semiconductors are used to make solar panels that are used in space and on earth. The Denver International Airport makes use of Colorado's sunny climate and has four solar arrays which provides 6% of the airport's energy needs.
DSSCs operate at efficiencies up to 15%,7 compared to 14-17% efficiency for traditional low-cost, commercial silicon panels. While operating efficiencies of DSSCs are competitive, the high-cost of materials (such as the Ru-dye) is problematic for large-scale applications. Possibly the greatest disadvantage of DSSCs is the use of a liquid electrolyte that is sensitive to temperature changes. The liquid electrolyte can freeze at low temperatures, thereby halting power production and/or resulting in structural damage to the solar panel. At high temperatures, the liquid electrolyte expands, which makes sealing the panels challenging.
References
- Williams, R. Becquerel Photovoltaic Effect in Binary Compounds. J Chem Phys, 32 (5), 1505-1514 (1960).
- Perlin (2005), Late 1950s - Saved by the Space Race", Solar Evolution - The history of Solar Energy. The Rahus Institute. Retrieved 28 June 2016.
- Regan, B., Gratzel, M. Nature, 353, 737-740 (1991).
- Miessler, G. L., Fischer, P. J., Tarr, D. A. Inorganic Chemistry, Pearson, 2014.
- Wikipedia page: Dye-sensitized solar cell,
- Smestad, G. P., Grätzel, M. Demonstrating Electron Transfer and Nanotechnology: A Natural Dye-Sensitized Nanocrystalline Energy Converter. J Chem Ed. 75 (6), 752 (1998).
- Burschka, J., Pellet, N., Moon, S.-J., Humphry-Baker, R., Nazeeruddin, M. K., Grätzel, M. Sequential deposition as a route to high-performance perovskite-sensitized solar cells. Nature, 499 (7458), 316-9 (2013).
Tags
Skip to...
Videos from this collection:

Now Playing
Dye-sensitized Solar Cells
Inorganic Chemistry
15.7K Views

Synthesis Of A Ti(III) Metallocene Using Schlenk Line Technique
Inorganic Chemistry
31.5K Views

Glovebox and Impurity Sensors
Inorganic Chemistry
18.6K Views

Purification of Ferrocene by Sublimation
Inorganic Chemistry
54.3K Views

The Evans Method
Inorganic Chemistry
67.9K Views

Single Crystal and Powder X-ray Diffraction
Inorganic Chemistry
103.9K Views

Electron Paramagnetic Resonance (EPR) Spectroscopy
Inorganic Chemistry
25.3K Views

Mössbauer Spectroscopy
Inorganic Chemistry
21.9K Views

Lewis Acid-Base Interaction in Ph3P-BH3
Inorganic Chemistry
38.7K Views

Structure Of Ferrocene
Inorganic Chemistry
79.1K Views

Application of Group Theory to IR Spectroscopy
Inorganic Chemistry
44.9K Views

Molecular Orbital (MO) Theory
Inorganic Chemistry
35.1K Views

Quadruply Metal-Metal Bonded Paddlewheels
Inorganic Chemistry
15.3K Views

Synthesis of an Oxygen-Carrying Cobalt(II) Complex
Inorganic Chemistry
51.5K Views

Photochemical Initiation Of Radical Polymerization Reactions
Inorganic Chemistry
16.7K Views
Copyright © 2025 MyJoVE Corporation. All rights reserved