Dissolved Oxygen in Surface Water
Overview
Source: Laboratories of Margaret Workman and Kimberly Frye - Depaul University
Dissolved oxygen (DO) measurements calculate the amount of gaseous oxygen dissolved in surface water, which is important to all oxygen-breathing life in river ecosystems, including fish species preferred for human consumption (e.g. bluegill and bass), as well as decomposer species critical to the recycling of biogeochemical materials in the system.
The oxygen dissolved in lakes, rivers, and oceans is crucial for the organisms and creatures living in it. As the amount of dissolved oxygen drops below normal levels in water bodies, the water quality is harmed and creatures begin to die. In a process called eutrophication, a body of water can become hypoxic and will no longer be able to support living organisms, essentially becoming a “dead zone.”
Eutrophication occurs when excess nutrients cause algae populations to grow rapidly in an algal bloom. The algal bloom forms dense mats at the surface of the water blocking out two essential inputs of oxygen for water: gas exchange from the atmosphere and photosynthesis in the water due to the lack of light below the mats. As dissolved oxygen levels decline below the surface, oxygen-breathing organisms die-off in large amounts, creating an increase in organic matter. The excess organic matter causes an increase in the oxygen-breathing decomposer populations in the benthic zone, which further depletes the remaining dissolved oxygen levels during the metabolic decomposition activity. Once the oxygen levels become this low, mobile oxygen-breathing species (e.g. fish) will move away, leaving no aerobic life in the water and creating a dead zone.
The Azide-Winkler titration method uses titration to determine the concentration of an unknown in a sample. Specifically, sodium thiosulfate is used to titrate iodine, which can be stoichiometrically related to the amount of dissolved oxygen in a sample.
Principles
The Azide-Winkler method is used to measure DO on site, where surface water is collected. Manganese(II) sulfate and potassium hydroxide are added to the sample, and the dissolved oxygen in the sample oxidizes the manganese and forms a brown precipitate. Azide is added in the form of a purchased alkaline iodide-azide reagent to correct for the presence of nitrites, which are found in wastewater samples and can interfere with the Winkler oxidation procedure.
MnSO4 + 2 KOH ![]() Mn(OH)2 + K2SO4
Mn(OH)2 + K2SO4
4 Mn(OH)2 + O2 + 2 H2O ![]() 4 Mn(OH)3
4 Mn(OH)3
Sulfuric acid is then added to acidify the solution, and the precipitate dissolves. Under these conditions, the iodide from the alkaline iodide-azide reagent in the solution is converted into iodine.
2 Mn(OH)3 + 3 H2SO4 ![]() Mn2(SO4)3 + 6 H2O
Mn2(SO4)3 + 6 H2O
Mn2(SO4)3 + 2 KI ![]() 2 MnSO4 + K2SO4 + 2 I2
2 MnSO4 + K2SO4 + 2 I2
Thiosulfate is then used to titrate the iodine in the presence of an added starch indicator.
4 Na2S2O3 + 2 I2 ![]() 2 Na2S4O6 + 4 NaI
2 Na2S4O6 + 4 NaI
4 moles of S2O32- ![]() 1 mole of O2
1 mole of O2
At the endpoint of this titration, the blue solution will turn clear. The amount of dissolved oxygen in the sample is quantified in direct proportion to the amount of thiosulfate required to reach the endpoint.
X mL S2O3 ![]() X mg/L O:
X mg/L O:

Procedure
1. Sample Dissolved Oxygen Measurement
- At the water collection site, use a calibrated pipette to add 2 mL manganous sulfate to a clear 300-mL BOD bottle filled with the sample water. Be careful not to introduce oxygen into the sample by inserting the pipette tip under the sample surface and carefully dispensing manganous sulfate. This will avoid creating bubbles until the sample is “fixed” and prevents change to the dissolved oxygen concentration.
- Using the same technique, add 2 mL alkaline iodide-azide reagent.
- Immediately insert the stopper, tilting the bottle slightly and quickly pushing the stopper in place so no air bubbles are trapped in the bottle.
- Carefully invert several times (without creating air bubbles) to mix. A floccule (floc) will form from a precipitated aggregation of material with a cloudy appearance (Figure 1).
- Wait until the floc in the solution has settled. Again, invert the bottle several times and wait until the floc has settled. The sample is now fixed to prevent change in dissolved oxygen content, and can be transported back to the lab and stored for up to 8 h, if needed, in a cool and dark condition.
- If storing, samples should be sealed using a small amount of deionized water squirted around the stopper, and the stopper should be wrapped in aluminum foil, secured with a rubber band.
- Pipette 2 mL of concentrated sulfuric acid into the sample by holding the pipette tip just above the sample surface. Invert carefully several times to dissolve the floc (Figure 2).
- In a glass flask, and using a calibrated pipette, titrate 200 mL of sample water with 0.025 N standardized sodium thiosulfate, swirling and mixing continuously until a pale straw color forms (Figure 3).
- Add 2 mL of starch indicator solution with a dropper and swirl to mix. Once the starch Indicator is added, the solution will turn blue (Figure 4).
- Continue the titration, adding one drop at a time until one drop dissipates the blue, causing the colorless endpoint. Be sure to add each drop of titrant carefully and to evenly mix each drop before adding the next. Holding the sample against a white piece of paper can help enhance visualization of the endpoint.
- The concentration of DO is equivalent to the volume (mL) of titrant used. Each milliliter of sodium thiosulfate added to the water sample equals 1 mg/L dissolved oxygen.

Figure 1. A sample after the alkaline iodide-azide reagent has been added and mixed, showing floc formation at the top of the sample before settling.
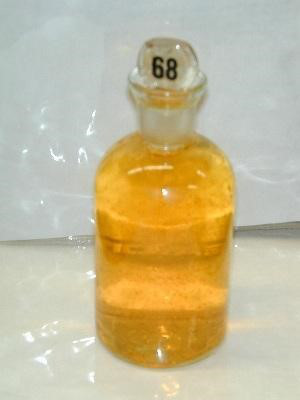
Figure 2. A sample with dissolved floc after addition of sulfuric acid.
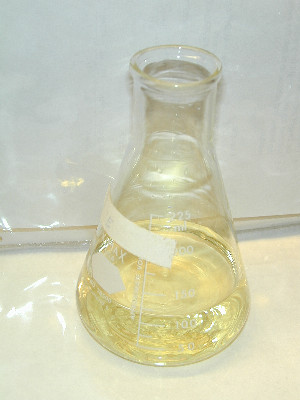
Figure 3. A sample after addition of sodium thiosulfate displaying a pale straw color.

Figure 4. A sample showing the blue color after the starch indicator is added and mixed.
Results
A dissolved oxygen level of 6 mg/L is sufficient for most aquatic species. Dissolved oxygen levels below 4 mg/L are stressful to most aquatic animals. Dissolved oxygen levels below 2 mg/L will not support aerobic aquatic life (Figure 5).
The maximum amount of oxygen that can be dissolved in water varies by temperature (Table 1).
DO measurements in mg/L are converted to % saturation using water temperature and the conversion chart below (Figure 6).
DISSOLVED OXYGEN LEVELS (% SATURATION)
Excellent: 91 – 110
Good: 71 – 90
Fair: 51 – 70
Poor: < 50
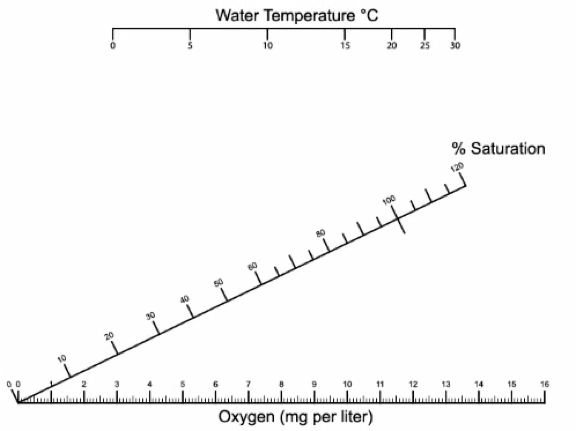
Figure 5. DO measurements are converted to % saturation using the water’s temperature. The water’s temperature on the top horizontal axis and the measured DO value on the bottom horizontal axis. Use a ruler to draw a line between the two values and record where the line meets the middle diagonal axis for % saturation.

Figure 6. A dissolved oxygen level of 6 mg/L is sufficient for most aquatic species. Dissolved oxygen levels below 4 mg/L are stressful to most aquatic animals. Dissolved oxygen levels below 2 mg/L will not support fish and below 1 mg/L will not support most species.
| Temp. (°C) | DO (mg/L) | Temp. (°C) | DO (mg/L) | Temp.(°C) | DO (mg/L) | Temp.(°C) | DO (mg/L) |
| 0 | 14.60 | 11 | 11.01 | 22 | 8.72 | 33 | 7.16 |
| 1 | 14.19 | 12 | 10.76 | 23 | 8.56 | 34 | 7.16 |
| 2 | 13.81 | 13 | 10.52 | 24 | 8.40 | 35 | 6.93 |
| 3 | 13.44 | 14 | 10.29 | 25 | 8.24 | 36 | 6.82 |
| 4 | 13.09 | 15 | 10.07 | 26 | 8.09 | 37 | 6.71 |
| 5 | 12.75 | 16 | 9.85 | 27 | 7.95 | 38 | 6.61 |
| 6 | 12.43 | 17 | 9.65 | 28 | 7.81 | 39 | 6.51 |
| 7 | 12.12 | 18 | 9.45 | 29 | 7.67 | 40 | 6.41 |
| 8 | 11.83 | 19 | 9.26 | 30 | 7.54 | 41 | 6.41 |
| 9 | 11.55 | 20 | 9.07 | 31 | 7.41 | 42 | 6.22 |
| 10 | 11.27 | 21 | 8.90 | 32 | 7.28 | 43 | 6.13 |
Table 1. Maximum amounts of oxygen that can be dissolved in water by temperature.
Application and Summary
Slow-moving rivers are particularly vulnerable to low DO levels, and in extreme cases, these DO levels can lead to hypoxic conditions, creating “dead zones” where aerobic life is no longer supported by a body of water (Figure 7). Once plants and animals die-off, the build-up of sediment that occurs can also raise the riverbed, allowing plants to colonize over the water and could lead to the loss of the river all together (Figure 8). Surface waters at higher altitudes are also more vulnerable to low DO levels, as atmospheric pressure decreases with increasing altitude, and less oxygen gas is suspended in the water.
Low DO levels support life forms considered unappealing or unfit for human use, including leeches and aquatic worms (Oligochaeta).
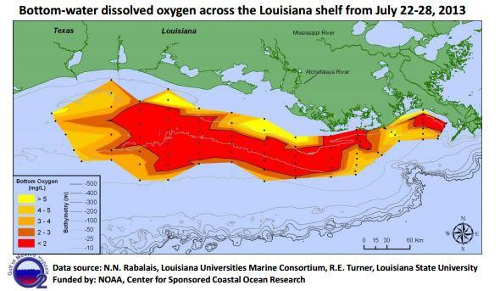
Figure 7. Map of dissolved oxygen concentrations across the Louisiana shelf showing the dead zone region.

Figure 8. Photograph of the Caspian Sea showing severe eutrophication in the north end.
Skip to...
Videos from this collection:

Now Playing
Dissolved Oxygen in Surface Water
Environmental Science
55.7K Views

Tree Identification: How To Use a Dichotomous Key
Environmental Science
81.1K Views

Tree Survey: Point-Centered Quarter Sampling Method
Environmental Science
49.4K Views

Using GIS to Investigate Urban Forestry
Environmental Science
12.6K Views

Proton Exchange Membrane Fuel Cells
Environmental Science
22.0K Views

Biofuels: Producing Ethanol from Cellulosic Material
Environmental Science
53.1K Views

Testing For Genetically Modified Foods
Environmental Science
89.6K Views

Turbidity and Total Solids in Surface Water
Environmental Science
35.8K Views

Nutrients in Aquatic Ecosystems
Environmental Science
38.8K Views

Measuring Tropospheric Ozone
Environmental Science
26.4K Views

Determination Of NOx in Automobile Exhaust Using UV-VIS Spectroscopy
Environmental Science
30.0K Views

Lead Analysis of Soil Using Atomic Absorption Spectroscopy
Environmental Science
125.4K Views

Carbon and Nitrogen Analysis of Environmental Samples
Environmental Science
29.4K Views

Soil Nutrient Analysis: Nitrogen, Phosphorus, and Potassium
Environmental Science
215.7K Views

Analysis of Earthworm Populations in Soil
Environmental Science
16.5K Views
Copyright © 2025 MyJoVE Corporation. All rights reserved