Combined SPECT and CT Imaging to Visualize Cardiac Functionality
Overview
Source: Alycia G. Berman, James A. Schaber, and Craig J. Goergen, Weldon School of Biomedical Engineering, Purdue University, West Lafayette, Indiana
Here we will demonstrate the fundamentals of single-photon emission computed tomography/computed tomography (SPECT/CT) imaging using mice. The technique involves injecting a radionuclide into a mouse, imaging the animal after it is distributed throughout the body, and then reconstructing the produced images to create a volumetric dataset. This can provide information about anatomy, physiology, and metabolism to improve disease diagnosis and monitor its progression.
In terms of collected data, SPECT/CT provides similar information as positron emission tomography (PET)/CT. However, the underlying principles of these two techniques are fundamentally different since PET requires the detection of two gamma photons, which are emitted in opposite directions. In contrast, SPECT imaging directly measures radiation via a gamma camera. As a result, SPECT imaging has lower spatial resolution than PET. However, it is also less expensive because the SPECT radioactive isotopes are more readily available. SPECT/CT imaging provides both noninvasive metabolic and anatomical information that can be useful for a wide variety of applications.
Principles
SPECT/CT imaging utilizes two separate imaging modalities, SPECT and CT, to obtain both functional and anatomical information to improve the overall diagnostic ability. In CT, multiple 2D X-ray images are collected to create a 3D model of the patient's or animal's anatomy. This CT model is then coupled with SPECT, which uses radioactive tracers to provide a functional assessment of an internal organ (i.e., the brain or myocardium). Like CT, SPECT also uses acquired 2D images to create a 3D model. Together, SPECT/CT provides anatomical landmarks and a functional assessment that can be used in initial diagnosis or to characterize disease progression.
The basis of CT imaging is the collection of 2D X-ray images. During imaging, X-rays are emitted from a source. As X-rays move through the patient, some of the X-rays are absorbed. In general, higher density materials absorb more X-rays than lower density materials. Because of that, bone tends to absorb more X-rays than soft tissue. After the X-rays pass through the body, the remaining (non-absorbed) X-rays are collected by a detector that can determine the intensity of the X-rays in Hounsfield Units. This produces a 2D image called a slice. The X-ray source and detector are then rotated to a designated angle and translated to acquire another slice. As the scan progresses, the source and detector continue to rotate acquiring more 2D slices, creating a collection of projections at various orientations (Figure 1). The slices are then reconstructed to create a 3D model.

Figure 1: Diagram demonstrating a) production of a single X-ray projection and b) rotation of an X-ray source and detector to create a complete 2D image. This entire setup can then be translated to create volumetric data.
SPECT works similarly to CT, but acquires the emission of gamma rays instead of X-rays. In this nuclear imaging technique, a radioactive tracer is injected into the patient. Over time, the tracer decays, emitting gamma rays. A gamma camera images the gamma radiation, creating a 2D image. Similar to CT, the camera collects 2D images at various locations. After imaging, the slices are reconstructed, creating a 3D dataset. The volumes from CT and SPECT are then co-registered to provide both anatomical and functional assessments.
Procedure
1. In Vivo Imaging Set-up
- Open up the imaging software.
- To set-up the CT portion of the scan, allow the X-ray tube to warm up by selecting the option on the software. The system will begin heating up the tube.
- Anesthetize the mouse. To ensure that the mouse is unconscious, extend one leg and pinch the animal's paw. If the mouse does not produce a withdrawal reflex, the animal is sufficiently anesthetized.
- Inject the mouse intravenously with the radionuclide. A commonly used SPECT radionuclide is Technetium99m (99mTc), in part due to its half-life. However, there are also many other available radionuclides that can be used including Iodine-123 (123I) and Indium-111 (111In).
- Wait. The radionuclide will take time to distribute through the bloodstream and begin decaying. The amount of time required is dependent on the radionuclide used and the imaging application. For cardiac applications, scans can begin almost immediately, whereas for tumors, the wait time might be several hours to days. Dependent on the timing of the imaging, the mouse can either remain anesthetized for the entirety of the procedure or can wake up and then be re-anesthetized when ready for imaging.
- Place the mouse in the mouse bed located on the SPECT/CT stage. The bed should be equipped with a tube for anesthetic gas, a heater, and a means of monitoring ECG and respiration. During imaging, the operator will be unable to observe the mouse directly, so having alternate means to monitor physiological parameters during imaging (i.e., heart rate and respiration) is necessary.
2. SPECT/CT Imaging
- Move the bed (containing the mouse) inside the collimator.
- Acquire a single axial image of the mouse. Using this pilot image, set a region of interest for a secondary scan.
- Define the settings for SPECT including the number of images collected, the time per image, the scan mode (detector rotation path), and the step mode for improved image accuracy or increased imaging speed.
- To set-up the CT portion of the scan, allow the X-ray tube to warm up by selecting the option on the software. The system will begin heating up the tube.
- Define the setting for CT, such as the tube current and voltage, the angle of rotation, the speed of the scan, and the number of images taken at each rotation angle.
- Begin data acquisition. The length of time required to complete the scan will be dependent on the scan parameters selected, but is typically 30-60 min in length.
- Remove the bed from the collimator.
- Remove the mouse from the bed and continue to monitor the mouse until it is conscious and able to move around normally.
3. SPECT/CT Reconstruction
- Reconstruction is typically performed using built-in software. The CT data and the SPECT data can be separately reconstructed and then combined using internal registration.
Results
Representative results using a 99mTc-based tracer in a rat are demonstrated in Figure 2. Acquisition of SPECT/CT should display the SPECT data (shown as shades of yellow/orange in the figure) overlaid on CT data (shown as shades of gray). Within the SPECT model, the degree of physiological activity is demonstrated by the intensity of color. Thus, the areas of yellow show greater activity than areas of orange. The SPECT data in the figure was acquired by collecting 30 one-min images. The resulting resolution is 0.8 mm.
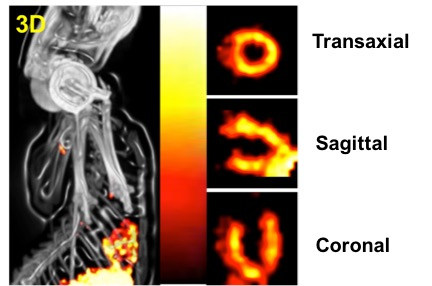
Figure 2: Representative images demonstrating cardiac functionality. The view on the left is the overall SPECT/CT model while the three views on the right show magnified images of the coronal, sagittal, and transaxial planes of the heart. Gray shades are that of the CT and indicate the skeletal structure, while the orange/yellow shades are that of SPECT. Degree of activity is indicated by the intensity of the color with white being greater than black. Images courtesy of Dr. Shuang Liu.
Application and Summary
SPECT/CT was used to provide anatomical and functional information. The general procedure involved injection of a radionuclide, imaging, and then reconstruction of the data. This procedure, discussed within the context of small animal imaging, is similar to what is performed clinically. However, the use of small animals adds some additional technical nuances that should not be overlooked. Small animal models, as might be surmised, necessitate the use of higher resolution in imaging. In addition, small animals have increased heart rates and respiration rates, which require more rapid imaging. Respiration and heart beat can cause movement of the animal during imaging, which makes it difficult to acquire accurate data. To compensate for these potential issues, cardiac and respiration gating can be implemented. The gating allows the machine to acquire images at specific times relative to the animal's cardiac and respiration cycles. For example, imaging occurs in between the animal's breaths and at a specific part of its cardiac cycle. These modifications enable improved imaging of small animal models.
The general procedure for SPECT/CT imaging of small animal model was demonstrated. The resulting data show areas of increased metabolism within the context of anatomy, thus enabling better diagnosis and disease characterization.
SPECT/CT imaging is a widely applicable technique, spanning a variety of areas including cardiology, oncology, and inflammation. In the realm of cardiology, myocardial perfusion studies employ SPECT/CT to diagnose blockages of coronary arteries by demonstrating how well blood flows through the heart muscle. Patients undergoing a myocardial perfusion study will exercise to induce cardiac stress. The patient will then be injected with a radioactive tracer that mixes with the blood moves throughout the body. If the blood is unable to reach a certain area of the heart due to a blockage in a coronary artery, then neither will the tracer. SPECT/CT images will be taken after exercise, and then later, after the patient has rested. During SPECT/CT imaging, areas that blood cannot reach will show up as dark, indicating potential coronary blockages or infarction.
In other applications, such as in oncology and in inflammation, the radioactive tracer can be chosen to selectively target a biological molecule. In the case of oncology, the radioactive tracer targets a specific cell-surface receptor that is found in tumors. Then, uptake of the radioactive tracer during SPECT/CT imaging is suggestive of the presence of a tumor. Finally, in the case of inflammation, the radioactive tracer can target the infection or inflammation while also providing precise anatomical location. This is valuable when diagnosing the extent of osteomyelitis, which is an infection of the bone. In summary, SPECT/CT is a versatile imaging approach that combines two techniques to noninvasively provide anatomical and functional information.
Skip to...
Videos from this collection:

Now Playing
Combined SPECT and CT Imaging to Visualize Cardiac Functionality
Biomedical Engineering
11.0K Views

Imaging Biological Samples with Optical and Confocal Microscopy
Biomedical Engineering
35.7K Views

SEM Imaging of Biological Samples
Biomedical Engineering
23.5K Views

Biodistribution of Nano-drug Carriers: Applications of SEM
Biomedical Engineering
9.3K Views

High-frequency Ultrasound Imaging of the Abdominal Aorta
Biomedical Engineering
14.4K Views

Quantitative Strain Mapping of an Abdominal Aortic Aneurysm
Biomedical Engineering
4.6K Views

Photoacoustic Tomography to Image Blood and Lipids in the Infrarenal Aorta
Biomedical Engineering
5.7K Views

Cardiac Magnetic Resonance Imaging
Biomedical Engineering
14.7K Views

Computational Fluid Dynamics Simulations of Blood Flow in a Cerebral Aneurysm
Biomedical Engineering
11.7K Views

Near-infrared Fluorescence Imaging of Abdominal Aortic Aneurysms
Biomedical Engineering
8.2K Views

Noninvasive Blood Pressure Measurement Techniques
Biomedical Engineering
11.9K Views

Acquisition and Analysis of an ECG (electrocardiography) Signal
Biomedical Engineering
104.9K Views

Tensile Strength of Resorbable Biomaterials
Biomedical Engineering
7.5K Views

Micro-CT Imaging of a Mouse Spinal Cord
Biomedical Engineering
8.0K Views

Visualization of Knee Joint Degeneration after Non-invasive ACL Injury in Rats
Biomedical Engineering
8.2K Views
Copyright © 2025 MyJoVE Corporation. All rights reserved