Measuring Grey Matter Differences with Voxel-based Morphometry: The Musical Brain
Overview
Source: Laboratories of Jonas T. Kaplan and Sarah I. Gimbel—University of Southern California
Experience shapes the brain. It is well understood that our brains are different as a result of learning. While many experience-related changes manifest themselves at the microscopic level, for example by neurochemical adjustments in the behavior of individual neurons, we may also examine anatomical changes to the structure of the brain at a macroscopic level. One famous example of this kind of change comes from the case of the London taxi drivers, who along with learning the complex routes of the city show larger volume in the hippocampus, a brain structure known to play a role in navigational memory.1
Many traditional methods of examining brain anatomy require painstaking tracing of anatomical regions of interest in order to measure their size. However, using modern neuroimaging techniques, we can now compare the anatomy of the brains across groups of people using automated algorithms. While these techniques do not avail themselves of the sophisticated knowledge that human neuroanatomists may bring to the task, they are quick, and sensitive to very small differences in anatomy. In a structural magnetic resonance image of the brain, the intensity of each volumetric pixel, or voxel, relates to the density of the gray matter in that region. For example, in a T1-weighted MRI scan, very bright voxels are found in locations where there are white matter fiber bundles, while darker voxels correspond to grey matter, where the cell bodies of neurons reside. The technique of quantifying and comparing brain structure on a voxel-by-voxel basis is called voxel-based morphometry, or VBM.2 In VBM, we first register all of the brains to a common space, smoothing over any gross differences in anatomy. We then compare the intensity values of the voxels to identify localized, small scale differences in gray matter density.
In this experiment, we will demonstrate the VBM technique by comparing the brains of musicians with those of non-musicians. Musicians engage in intense motoric, visual, and acoustic training. There is evidence from multiple sources that that the brains of people who have gone through musical training are functionally and structural different from those who haven't. Here, we follow Gaser and Shlaug3 and Bermudez et al.4 in using VBM to identify these structural differences in the brains of musicians.
Procedure
1. Recruit 40 musicians and 40 non-musicians.
- Musicians should have at least 10 years of formal musical training. Training with any musical instrument is acceptable. Musicians should also be actively practicing their instrument for at least one hr/day.
- Control subjects should have little to formal training in playing a musical instrument.
- All participants should be right-handed.
- All participants should have no history of neurological, psychiatric, or cardiac disorders.
- All participants should have no metal in their bodies that they cannot remove to ensure that they are MRI-safe.
2. Pre-scan procedures
- Fill out pre-scan paperwork.
- When participants come in for their fMRI scan, have them first fill out a metal screen form to make sure they have no counter-indications for MRI, an incidental findings form giving consent for their scan to be looked at by a radiologist, and a consent form detailing the risks and benefits of the study.
- Prepare participants to go in the scanner by removing all metal from their body, including belts, wallets, phones, hair clips, coins, and all jewelry.
3. Put the participant in the scanner.
- Give the participant ear plugs to protect their ears from the noise of the scanner and ear phones to wear so they can hear the experimenter during the scan, and have them lie down on the bed with their head in the coil.
- Give the participant the emergency squeeze ball and instruct them to squeeze it in case of emergency during the scan.
- Use foam pads to secure the participants head in the coil to avoid excess movement during the scan, and remind the participant that it is very important to stay as still as possible during the scan, as even the smallest movements blur the images.
4. Data collection
- Collect a high-resolution anatomical scan of the whole brain. This scan should be a T1-weighted sequence such as a Magnetization Prepared Rapid Gradient Echo (MP-RAGE) with isotropic 1 mm voxels.
5. Data analysis
- Remove the skull from each anatomical brain scan using automated software. Check the skull stripping for quality.
- Create a study-specific gray matter template using an iterative process of linear and non-linear registration (Figure 1).
- Use automated software to segment each subject's brain into white matter, gray matter, and CSF based on the intensity at each voxel.
- Perform a linear affine transformation with 12 degrees of freedom to register each subject's brain to a standard atlas space, such as the MNI152 atlas.
- Warp each subject's gray matter image into this space, and average them all together.
- Mirror this image left to right and then average the mirror images together to produce the gray matter template brain.
- Re-register each subject's brain to this template using a nonlinear transformation.
- Average all of the newly transformed brains together.
- Make a mirror image of this new template, and average the two mirror images together to produce a final gray matter template for this study.

Figure 1: Creation of study-specific gray matter template. Using iterative linear and nonlinear transformations, each brain is registered to a common space and averaged together to create a study-specific gray matter template brain.
- Register each subject's gray matter image to the template and preprocess.
- Use a nonlinear transformation to register each subject's brain to the study-specific template.
- To compensate for the amount each brain structure has been stretched to fit the template space, multiply by a measure of how much warping has been done. This measure is called the Jacobian of the warp field. This step is to account for the fact that structures may appear to have more gray matter simply because they have been stretched more by the nonlinear registration process.
- Smooth the data using a Gaussian kernel with a Full Width Half Maximum (FWHM) of 10 mm.
- These aligned, smoothed brains will serve as the final data for voxel-based analysis.
- Use the General Linear Model to analyze the difference between the groups at every voxel.
- Model each group of brains with a separate regressor, and compute a contrast that compares the two groups, generating statistical maps that quantify the likelihood of differences at each voxel.
- Threshold the statistical maps to identify statistically significant clusters.
- Employ a multiple comparisons correction technique such as False Discovery Rate (FDR) to control for the fact that were are doing thousands of simultaneous statistical tests. With FDR, a q value of 0.01 will estimate the rate of false positives above threshold to be 1%.
Results
The VBM analysis revealed significant localized increases in gray matter density in musicians' brains compared with non-musician controls. These differences were found in the superior temporal lobes on both sides. The largest, most significant cluster was on the right side and includes the posterior portion of Heschl's gyrus (Figure 2). Heschl's gyrus is the location of the primary auditory cortex, and the surrounding cortices are involved in complex auditory processing. Thus, these results are consistent with previous findings of morphological differences between musicians and non-musicians in auditory brain regions.
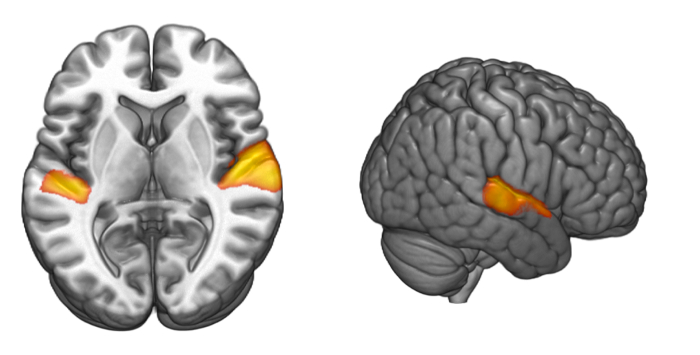
Figure 2: Gray matter differences between groups. Musicians showed significantly higher gray matter density in the superior temporal lobe on both sides, with the greatest differences on the right side. This region includes part of Heschl's gyrus, the primary auditory cortex.
Application and Summary
The VBM technique has the potential to demonstrate localized differences in gray matter between groups of people, or in association with a measurement that varies across a group of people. In addition to finding structural differences that relate to different forms of training, this technique may reveal anatomical differences that are associated with wide ranging neuropsychological conditions such as depression,5 dyslexia,6 or schizophrenia.7
It is important to note that there are multiple explanations for the existence of between-group differences in brain anatomy. For example, in the case of musicians, there could be a self-selection bias. We may find such differences if people with a certain brain anatomy are more likely to become musicians. In order to establish that structural differences between groups of people are the result of experience, the most definitive way is to employ a longitudinal study that follows people over time.
References
- Maguire, E.A., et al. Navigation-related structural change in the hippocampi of taxi drivers. Proc Natl Acad Sci U S A 97, 4398-4403 (2000).
- Ashburner, J. & Friston, K.J. Voxel-based morphometry--the methods. Neuroimage 11, 805-821 (2000).
- Gaser, C. & Schlaug, G. Brain structures differ between musicians and non-musicians. J Neurosci 23, 9240-9245 (2003).
- Bermudez, P., Lerch, J.P., Evans, A.C. & Zatorre, R.J. Neuroanatomical correlates of musicianship as revealed by cortical thickness and voxel-based morphometry. Cereb Cortex 19, 1583-1596 (2009).
- Bora, E., Fornito, A., Pantelis, C. & Yucel, M. Gray matter abnormalities in Major Depressive Disorder: a meta-analysis of voxel based morphometry studies. J Affect Disord 138, 9-18 (2012).
- Richlan, F., Kronbichler, M. & Wimmer, H. Structural abnormalities in the dyslexic brain: a meta-analysis of voxel-based morphometry studies. Hum Brain Mapp 34, 3055-3065 (2013).
- Zhang, T. & Davatzikos, C. Optimally-Discriminative Voxel-Based Morphometry significantly increases the ability to detect group differences in schizophrenia, mild cognitive impairment, and Alzheimer's disease. Neuroimage 79, 94-110 (2013).
Skip to...
Videos from this collection:

Now Playing
Measuring Grey Matter Differences with Voxel-based Morphometry: The Musical Brain
Neuropsychology
17.3K Views

The Split Brain
Neuropsychology
68.2K Views

Motor Maps
Neuropsychology
27.4K Views

Perspectives on Neuropsychology
Neuropsychology
12.0K Views

Decision-making and the Iowa Gambling Task
Neuropsychology
32.3K Views

Executive Function in Autism Spectrum Disorder
Neuropsychology
17.6K Views

Anterograde Amnesia
Neuropsychology
30.3K Views

Physiological Correlates of Emotion Recognition
Neuropsychology
16.2K Views

Event-related Potentials and the Oddball Task
Neuropsychology
27.4K Views

Language: The N400 in Semantic Incongruity
Neuropsychology
19.5K Views

Learning and Memory: The Remember-Know Task
Neuropsychology
17.1K Views

Decoding Auditory Imagery with Multivoxel Pattern Analysis
Neuropsychology
6.4K Views

Visual Attention: fMRI Investigation of Object-based Attentional Control
Neuropsychology
41.5K Views

Using Diffusion Tensor Imaging in Traumatic Brain Injury
Neuropsychology
16.7K Views

Using TMS to Measure Motor Excitability During Action Observation
Neuropsychology
10.1K Views
Copyright © 2025 MyJoVE Corporation. All rights reserved