
Motor Maps
Overview
Source: Laboratories of Jonas T. Kaplan and Sarah I. Gimbel—University of Southern California
One principle of brain organization is the topographic mapping of information. Especially in sensory and motor cortices, adjacent regions of the brain tend to represent information from adjacent parts of the body, resulting in maps of the body expressed on the surface of the brain. The primary sensory and motor maps in the brain surround a prominent sulcus known as the central sulcus. The cortex anterior to the central sulcus is known as the precentral gyrus and contains the primary motor cortex, while the cortex posterior to the central sulcus is known as the postcentral gyrus and contains the primary sensory cortex (Figure 1).
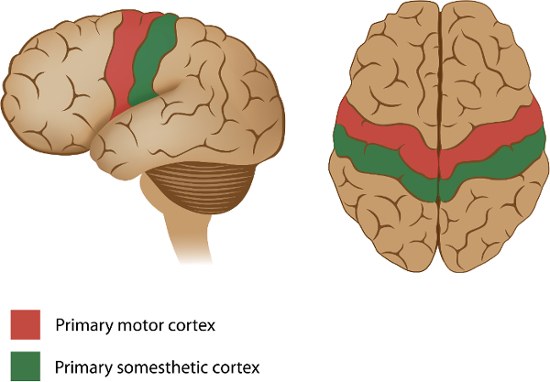
Figure 1: Sensory and motor maps around the central sulcus. The primary motor cortex, which contains a motor map of the body's effectors, is anterior to the central sulcus, in the precentral gyrus of the frontal lobe. The primary somesthetic (sensory) cortex, which receives touch, pain, and temperature information from the external parts of the body, is located posterior to the central sulcus, in the postcentral gyrus of the parietal lobe.
In this experiment, functional neuroimaging is used to demonstrate the motor map in the precentral gyrus. This map is often called the motor homunculus, which is Latin for "little man," because it is as if there is a little version of one's self represented in this part of a person's brain. One interesting property of this map is that more cortical space is devoted to body parts requiring finer control, such as the hands and mouth, which results in disproportionate representation of those appendages in the cortex. Also, because of the anatomy of the motor system, the neurons that control the right side of the body are in the left primary motor cortex, and vice versa. Therefore, when a participant in the experiment is asked to move their right hand or foot, an increased activation on their left precentral gyrus is expected.
In this experiment, participants are asked to alternately move their hands and feet, on the left and right sides, while their brain activity is measured with fMRI. Since the fMRI signal relies on changes in blood oxygenation, which are slow in comparison to the movements the participants make, the periods of movement are separated with periods of stillness to ensure that the various conditions can be distinguished from each other and from the resting baseline. To achieve precise timing of the movements, participants are instructed on when to begin and end each movement with a visual cue. The methods in this video are similar to those used by several fMRI studies that have demonstrated somatotopy in primary motor cortex.1,2
Procedure
1. Recruit 20 participants.
- Confirm that the participants have no history of neurological or psychological disorders.
- Confirm that the participants are all right-handed using the handedness questionnaire.
- To ensure the participants can see the visual cues properly, make sure they have normal or corrected to normal vision.
- Make sure the participants have no metal in their body. This is an important safety requirement due to the high magnetic field involved in fMRI.
- Since the fMRI requires lying in the small space of the scanner bore, confirm that the participants don't suffer from claustrophobia.
2. Pre-scan procedures
- Fill out the pre-scan paperwork.
- When participants come in for their fMRI scan, have them first fill out a metal screen form to make sure they have no counter-indications for MRI, an incidental findings form giving consent for their scan to be looked at by a radiologist, and a consent form detailing the risks and benefits of the study.
- Have the participants remove all metal from their body (including belts, wallets, phones, hair clips, coins, and all jewelry) to prepare to go in the scanner.
3. Provide instructions for the participant.
- Tell the participant that when they see a hand on the screen, they are to begin moving their hand until the visual cue disappears. Inform the participant that the hand movement involves touching the thumb to each finger of the same hand in order and repeating this sequence in reverse. When the cue appears on the left side of the screen, they are to move their left hand, and when the cue appears on the right side of the screen, they are to move their right hand.
- Tell the participant that when they see a foot on the screen, they are to begin moving their foot and continue to do so until the visual cue disappears. Inform the participant that the foot movement involves repetitively pressing the foot down, as if pressing on an imaginary pedal. When the cue appears on the left side of the screen, they are to move their left foot, and when the cue appears on the right side of the screen, they are to move their right foot.
- Stress to the participant the importance of keeping their head still, even while they are moving their hand or foot.
4. Guide the participant into the scanner.
- Give the participant earplugs (to protect their ears from the noise of the scanner) and earphones (to wear so they can hear the experimenter during the scan), and have them lie down on the bed with their head in the coil.
- Give the participant the emergency squeeze ball and instruct them to squeeze it in case of emergency during the scan.
- Secure the participant's head in the coil with foam pads to avoid excess movement during the scan, and remind the participant that it is very important to stay as still as possible during the scan, as even the smallest movements blur the images.
5. Data collection
- Collect a high-resolution anatomical scan.
- Begin functional scanning.
- Synchronize the start of the stimulus presentation with the start of the scanner.
- Present the visual cues via a laptop connected to a projector. The participant should have a mirror above their eyes, reflecting a screen at the back of the scanner bore.
- Present each visual cue for 12 s, followed by 12 s of resting baseline. Alternate between the left hand, right hand, left foot, and right foot.
- Repeat four repetitions of each condition, for a total of 6.5 min.
6. Post-scan procedures
- Bring the participant out of the scanner.
- Debrief the participant.
- Pay the participant.
7. Data analysis
- Preprocess the data.
- Perform motion correction to reduce motion artifacts.
- Perform temporal filtering to remove signal drifts.
- Smooth the data to increase signal-to-noise ratio.
- Model the data for each participant.
- Create a model of what the expected hemodynamic response should be for each task condition.
- Fit the data to this model, resulting in a statistical map, where the value at each voxel represents the extent to which that voxel was involved in the task condition.
- Register the participant's brain to a standard atlas in order to combine data across participants.
- Combine statistical maps across subjects for a group level analysis of the data.
Results
In this experiment, researchers measured brain activity with fMRI, while participants moved their hands or feet. Statistical analysis of the changes in blood flow is represented by different colors on the surface of the standard atlas brain. The colors identify the voxels, whose time course best matched the predicted time course for a specific condition.
The results demonstrate different activation foci within the precentral gyrus for the movement of the different limbs (Figure 2). Movement of the right hand produced the greatest activation on the left lateral surface of the gyrus (blue), while movement of the left hand produced the greatest activation on the right lateral surface (green). When participants moved their feet, activation was greatest where the precentral gyrus extends around to the medial surface of the brain. Right-sided foot movements produced activation on the left medial surface (cyan), while the greatest activation for left foot movements was on the right medial surface (yellow).

Figure 2: Brain activations resulting from movement of the hands and feet across participants. Blue = Movement of the right hand; Green = Movement of the left hand; Cyan = Movement of the right foot; Yellow = Movement of the left foot.
Application and Summary
These results demonstrate the somatotopic, or body-mapped organization of the human primary motor cortex. This mapping has implications for how damage to the brain affects movement. For example, damage to the left precentral gyrus leads to difficulty in moving the right side of the body, and the specific parts of primary motor cortex affected can lead to problems in controlling specific parts of the body. However, it is also important to note that the primary motor cortex is only one of many brain regions involved in the control of movement. The precentral gyrus is part of a wider network of brain regions that participate in the selection, planning, and coordination of movement.
The ability to measure effector-specific activity in motor cortex also leads to the possibility of brain-computer interfaces, such as those that allow control of prosthetic limbs. For example, using direct recordings of neurons in the primary motor cortex, researchers have demonstrated that monkeys can control a prosthetic limb to feed themselves.3
References
- Lotze, M., et al. fMRI evaluation of somatotopic representation in human primary motor cortex. Neuroimage 11, 473-481 (2000).
- Rao, S.M., et al. Somatotopic mapping of the human primary motor cortex with functional magnetic resonance imaging. Neurology 45, 919-924 (1995).
- Velliste, M., Perel, S., Spalding, M.C., Whitford, A.S. & Schwartz, A.B. Cortical control of a prosthetic arm for self-feeding. Nature 453, 1098-1101 (2008).
Skip to...
Videos from this collection:

Now Playing
Motor Maps
Neuropsychology
27.5K Views

The Split Brain
Neuropsychology
68.3K Views

Perspectives on Neuropsychology
Neuropsychology
12.0K Views

Decision-making and the Iowa Gambling Task
Neuropsychology
32.6K Views

Executive Function in Autism Spectrum Disorder
Neuropsychology
17.8K Views

Anterograde Amnesia
Neuropsychology
30.3K Views

Physiological Correlates of Emotion Recognition
Neuropsychology
16.2K Views

Event-related Potentials and the Oddball Task
Neuropsychology
27.5K Views

Language: The N400 in Semantic Incongruity
Neuropsychology
19.6K Views

Learning and Memory: The Remember-Know Task
Neuropsychology
17.2K Views

Measuring Grey Matter Differences with Voxel-based Morphometry: The Musical Brain
Neuropsychology
17.3K Views

Decoding Auditory Imagery with Multivoxel Pattern Analysis
Neuropsychology
6.4K Views

Visual Attention: fMRI Investigation of Object-based Attentional Control
Neuropsychology
41.9K Views

Using Diffusion Tensor Imaging in Traumatic Brain Injury
Neuropsychology
16.8K Views

Using TMS to Measure Motor Excitability During Action Observation
Neuropsychology
10.1K Views
Copyright © 2025 MyJoVE Corporation. All rights reserved