
Creating the Minimal Group Paradigm
Genel Bakış
Source: Julian Wills & Jay Van Bavel—New York University
The study of intergroup relations, such as prejudice, conflict, and discrimination, has always been a central topic in social psychology. Does discrimination stem from competition with other groups, a history of conflict, or derogatory stereotypes? Despite an abundance of real-world examples, the ingredients that lead to intergroup discrimination are often unclear.
To help solve this problem, a group of psychologists created "minimal groups" to strip away confounds like monetary self-interest and a history of conflict that are normally involved in intergroup discrimination. In minimal groups, participants are randomly assigned to completely novel groups. Thus, any consequences emerging from this minimal group induction must stem from identifying with a social group and separating the social world into "us" and "them." Research using minimal groups has shown that, despite the arbitrary nature of group membership, participants willingly discriminate by favoring members of their in-group over members of the out-group.
The minimal group paradigm is widely used in social psychology to study the most basic elements of intergroup relations. This method was first introduced in a 1971 paper called Social Categorization and Intergroup Behaviour by Henri Tajfel and colleagues.1 Across three experiments, the authors documented the in-group favoritism that emerges from a rather minimal group induction. This video will demonstrate how to produce the minimal group induction in a manner similar to the first experiment, where groups were ostensibly created based on dot estimation tendencies.
İlkeler
Intergroup behavior has long been studied within and among various societies. The variables in these studies have been derived from conflict, competition, cooperation, personal interaction, structures, personalities, etc. Whether caused by utilitarian reasons or emotional investment, social environments divide people into "us" and "them," i.e., in-groups and out-groups. Early studies were premised on the notion that there can be no intergroup behavior without the social environments that create these divisions among people.
However, Tajfel and other psychologists' research addressed the issue of whether the sole act of social categorization-isolated from other variables like competition or anticipation of future interaction-can lead to discrimination from the in-group toward the out-group.
Prosedür
1. Participant Recruitment
- Conduct a power analysis and recruit a sufficient number of participants.
2. Organize materials.
- Create forty images of dot clusters with various amounts (see example of one in Figure 1).

Figure 1: Example of dot estimation task. Twenty-three dots are displayed in the image above. Participants are only given 125-500 ms to view each image before estimating the number of dots that were on the screen.
- Generate ordered matrices, each of which should consist of 14 boxes containing two numbers.
- Label each row, "These are rewards and penalties for member number [insert code number] of your group", or "of the other group".
- Create six matrices that satisfy one of three criteria (two each; Figure 2).
- Type A: The maximum penalties exceed maximum rewards. Order the boxes such that the two maximum joint payoff and maximum fairness terms are in the middle.
- Type B: No penalties and constant joint payoff. Order the boxes such that the two maximum fairness terms are in the middle.
- Type C: The maximum rewards exceed maximum penalties. Order the boxes such that the maximum joint payoffs are at both extremes and the two maximum fairness terms are in the middle.
- Replicate these six matrices for three different types of choices corresponding to the following labels for each row:
- In-group choices: The top row refers to rewards and penalty outcomes for one in-group member and the bottom row refers to outcomes for another in-group member.
- Out-group choices: The top row refers to rewards and penalty outcomes for one out-group member and the bottom row refers to outcomes for another out-group member.
- Differential (intergroup) choices: One row refers to rewards and penalty outcomes for an in-group member and the other row refers to outcomes for an out-group member. Randomize the order of these rows such that three matrices reflect in-group choices on the top and the other three reflect out-group choices on the top.

Figure 2: Typical payout matrices used in this experiment. Each matrix consists of two rows, reflecting monetary tradeoffs that affect other in-group or out-group members. Matrix types (A, B, and C) are indicated on the left, with two matrices belonging to each. All six matrices are replicated three times, one for each decision type (in-group, out-group, and differential). A differential choice in matrix 1, for instance, might read, "These are rewards and penalties for Member 3 of your group" (top row) and "Member 2 of the other group" (bottom row) along with 14 tradeoff terms. Thus, term 14 (i.e., the most unfair option) would deduct 19 points from an outgroup member and give 6 points to a fellow in-group member. Terms 7 and 8, on the other hand, reflect the maximally fair options since they minimize the joint penalty (-1) for both players.
- Randomize the order of the 18 matrices.
- Title the front of each section, "For member of the [insert group identification]" where group identification reflects one of the four experimental conditions: (1) under-estimator groups, (2) over-estimator group, (3) better accuracy group, and (4) worse accuracy group.
3. Data Collection
- Seat each participant at a computer.
- Present each of the 40 dot-cluster images very briefly, anywhere from 125-500 ms.
- Allow time between images so that participants can estimate the number of dots they see and record their responses on the computer.
- To assess the effects of the categorization on intergroup behavior, inform participants that you are interested in studying other types of judgments and, for convenience, you will be dividing them into two groups for making these judgments.
- Randomly assign half the participants to either the neutral condition or the value condition.
- Inform participants in the neutral condition that one group will consist of participants who provided the highest estimates for the number of dots and the other group will consist of those who provided the lowest estimates.
- Randomly assign half of these participants to "under-estimators" and the other half to "over-estimators".
- Inform participants in the value condition that one group will consist of participants who provided more accurate estimates for the number of dots and the other group will consist of those who provided less accurate estimates.
- Randomly assign half of these participants to the "better accuracy" group and the other half to the "worse accuracy" group.
- Lead participants to separate cubicles and inform them that they will soon make real monetary decisions where they can (anonymously) reward and punish other participants.
- Have the participants do the matrices with their corresponding group identification. Instruct them to indicate their choices by selecting one box per matrix (Figure 3).

Figure 3: Example page of matrix booklet from participant's perspective. Six of the 18 matrices are displayed on each page of the matrix booklet. In the example above, there are two matrices of each type (A, B, and C) and two matrices for each choice (in-group, out-group, and differential). For instance, matrix 3 is type C with a differential choice since (1) the maximum rewards exceed maximum penalties and (2) participants must decide between outcomes than impact a fellow in-group member (top row) or an out-group member (bottom row).
- Fully debrief participants.
4. Data Analysis
- Score the matrices from 1 to 14, where 14 stands for the choice in the matrix which gives the member of the in-group the maximum possible points on that matrix and 1 gives the in-group the minimum possible points; a score of 7.5 represents maximal fairness.
- Perform one-sample t-tests to determine whether the individual means scores within groups were significantly different from the point of fairness.
Sonuçlar
This procedure typically results in considerably higher payouts (i.e., more rewards and less penalties) for in-group members compared to out-group members. This in-group favoritism emerges regardless of the experimental condition; even when the group labels signal no objective value (i.e., "under-estimator" and "over-estimator"), this distinction is sufficient for discriminatory behavior ( Figure 4). Moreover, these differences cannot be attributed to general tendencies to make unfair decisions, since participants typically choose the maximally fair option when deciding between two in-group or two out-group members.
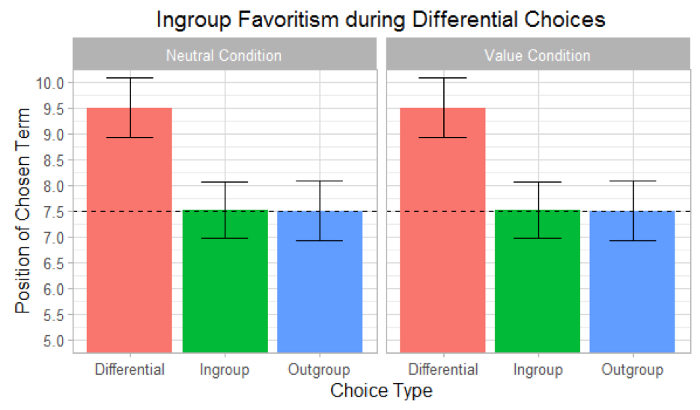
Figure 4: A typical outcome of the minimal group paradigm. Choice types are displayed on the x-axis and the average term number is displayed on the y-axis. The dashed line at 7.5 represents the maximally fair decision across all choice types. For differential choices (pink), values above 7.5 reflect greater in-group favoritism. For instance, a value of 9.5 for differential choices indicates that, on average, participants choose terms positioned around 9 or 10, thereby prioritizing in-group favoritism over fairness.
Başvuru ve Özet
Participants favored their own groups in the distribution of real rewards and penalties in a situation where a fairly irrelevant classification distinguished the in-group and out-group. The results support the theory that social categorization, regardless of the organizing principle, is capable of creating intentional discriminatory behavior.
People deliberately choose decisions that make their in-group "winners" even at the expense of maximizing joint collective utility. These seminal findings eventually led to the development of Social Identity Theory2 and Social Categorization Theory3,which continue to be highly influential models for understanding intergroup relations. These theories stipulate that individuals can simultaneously possess any number of social identities which can then be selectively activated depending on the context. As a result, some researchers have found behavioral and neurological evidence that minimal group inductions can even override racial categorizations.4 Since the original study, the minimal group induction has been used in hundreds of social psychology experiments due to its (1) simplicity, (2) robust influence on cognition and behavior, and (3) relevance to one of the discipline's core constructs. This research has also proven influential in fields ranging from political science to social neuroscience.
Referanslar
- Tajfel, H., Billig, M. G., Bundy, R. P., & Flament, C. (1971). Social categorization and intergroup behaviour. European journal of social psychology, 1, 149-178.
- Tajfel, H. (1974). Social identity and intergroup behaviour. Social Science Information/sur les sciences sociales.
- Turner, J. C., Hogg, M. A., Oakes, P. J., Reicher, S. D., & Wetherell, M. S. (1987). Rediscovering the social group: A self-categorization theory. Basil Blackwell.
- Van Bavel, J. J., Packer, D. J., & Cunningham, W. A. (2008). The neural substrates of in-group bias a functional magnetic resonance imaging investigation. Psychological Science, 19, 1131-1139.
Atla...
Bu koleksiyondaki videolar:

Now Playing
Creating the Minimal Group Paradigm
Social Psychology
25.8K Görüntüleme Sayısı
Creating the Minimal Group Paradigm
Social Psychology
25.8K Görüntüleme Sayısı

Evaluating the Accuracy of Snap Judgments
Social Psychology
21.0K Görüntüleme Sayısı

Büyük Yetişkinlerin Bilişsel Testleri Sırasında Negatif Yaşlanma Stereotiplerinin Etkisini Vurgulama ve Azaltma
Social Psychology
7.3K Görüntüleme Sayısı
JoVE Hakkında
Telif Hakkı © 2020 MyJove Corporation. Tüm hakları saklıdır