Biodistribution of Nano-drug Carriers: Applications of SEM
Overview
Source: Peiman Shahbeigi-Roodposhti and Sina Shahbazmohamadi, Biomedical Engineering Department, University of Connecticut, Storrs, Connecticut
Nanoparticles have been increasingly used research towards targeted drug delivery and controlled drug release. While most of these particles have been developed as polymeric or liposomal particles because of their biocompatibility, there is a trend in current research toward the use of metallic and magnetic nanoparticles. These metallic nanoparticles were originally used as a contrast agent in imaging, but recent advances have shown how important they could be in drug and gene delivery and in therapeutics. Gold, silver, and paramagnetic nanoparticles have the greatest share in research being done. They have been shown to have good biocompatibility and certain varieties of magnetic nanoparticles have already been developed and distributed as therapeutic targeted drugs.
These heavy elements are typically imaged for research using fluorescence to evaluate delivery and distribution, but their atomic weights are good qualifications for increased contrast in backscatter electron analysis using a scanning electron microscope (SEM). Energy dispersive X-ray spectroscopy, which uses characteristic X-rays emitted upon electron beam interaction with the sample to identify chemical composition, can also be used with the SEM. These methods have the benefits of increased resolution and increased confidence in detection, as the EDS can ensure that the subject of an image is of the right composition, while current fluorescence methods can detach from the nanoparticles and can fade quickly while imaging.
This demonstration will examine the size-dependent metal nanoparticle distribution in organs of the body over time. Excised organs will be examined with SEM for various sizes of particles at a range of time points after particle delivery to the body.
Principles
It is hard to overestimate the importance of nanoparticles (NPs) for medical applications. They are used as drugs, drug carriers, contrast agents, etc. However, in order to use a certain type of nanoparticle it is necessary to know how and where it will be distributed in each organ after application and how long it will take before leaving the organ and, subsequently, the body. This is called its biodistribution.
The process of nanoparticle drug delivery can vary widely in its complexity, from passive drugs that do not target the tissue but are instead released into the whole of the body, to more actively manipulated targeting of drugs to a very precise organ or location. Most medicines and therapies will use passive targeting, which still shows great success due to the enhanced permeability and retention (EPR effect) in tumors with large amounts of blood flow and high amounts of vascular leakage. Besides passive targeting, active targeting can be done in processing of the nanoparticles through the attachment of tumor-site specific ligands, or can be done after injection by way of adding a magnetic force to the magnetic nanoparticles. This magnetic field pulls the nanoparticles out of the blood stream towards the afflicted area, thus lowering the time of the medicine spends in the bloodstream and increasing the dose to the affected area. These different methods of delivery should vastly affect the distribution of the nanoparticles after treatment, and this experiment aims to investigate both their initial distribution, and their distribution over time.
Current methods of nanoparticle distribution measurement usually involve attachment of fluorescence particles onto the nanoparticles. Depending on the concentration of the nanoparticles, the size of the target area, and intensity of fluorescence, translucent mice can be analyzed using optical imaging while still alive to determine if the particles are in the correct area. Post-mortem fluorescence can also be used to determine nanoparticle levels in different organs of mice. However, these methods lack the resolution of nanoparticles and affirmation that the fluorescence hasn’t become detached from the nanoparticles.
The current demonstration exploits backscattered electron microscopy (BEM) and energy-dispersive spectroscopy (EDS) based analysis to understand the biodistribution of magnetoelectric nanoparticles (MENs) depending on their size and the time spent in the body. The MENs in the sample are barium and titanium magnetoelectric nanoparticles that were introduced into mouse organs through injection and then passively targeted to the organs. The mice were rendered unconscious and their organs removed and preserved at 1 week, 4 weeks, and 8 weeks after injection. The organs: the liver, spleen, lungs, kidneys, and brain, were then sectioned using a microtome machine and prepared using sample preparation methods described in the educational video "SEM Imaging of Biological Samples.” As a mode of scanning electron microscopy (SEM), BEM along with EDS analysis provides a high-resolution compositional analysis which allows to detect individual nanoparticles as small as 10 nm in diameter. Meanwhile, this demonstration can illustrate how different detectors can be used to detect, confirm and map different elements and particles in a research setting and also how different parameters can affect the resulting image.
Procedure
1. Nanoparticle Injection and Organ Harvesting
- Inject nanoparticles into an anesthetized mouse intravenously to allow passive targeting.
- At the desired time points, i.e., 1, 4 and 8 weeks, post-injection, humanely euthanize the mice according to American Veterinary Medical Association (AVMA) Guidelines.
- Open the body cavity and surgically remove the organs of interest. Place the organs in 10% phosphate buffered formalin in a polypropylene container until sample preparation.
2. Tissue Sample Preparation
- Use forceps to transfer the mouse tissue from the fixative into phosphate buffered saline (PBS). Rock the sample for 30 min, replacing the PBS every 10 min.
- Remove the tissue and dry with a kimwipe. Then place it in a plastic mold containing optimal cutting temperature compound (OCT). Store at -80 °C overnight.
- The next day, transfer the sample to the cryostat and set the temperature to -23 °C.
- Label slides with the organ type and nanoparticle size, and place them on a shelf in the cryostat.
- Cover the cryostat chuck with OCT and place the sample on top. Lower the extractor plunger over the sample and allow it to equilibrate for 3-5 min.
- Mount the chuck onto the specimen holder and orient it so that the blade can cut straight across the frozen sample. Bring the sample close to the blade for rough facing. Set the thickness to 30 μm and slice several sections until an evenly cut slice is produced.
- Switch to fine facing by decreasing the section thickness to 7-8 μm. Collect a sliced section by pressing a labeled glass slide on the slice. Place two slides onto each slide, and store in a slide rack. Allow to dry at room temperature.
- Once dry, dehydrate the samples by dipping the slide rack in 50% ethanol for 3 min to remove OCT. Then transfer the rack to 80% ethanol for 3 min before placing the rack in a 1:1 ratio of cold methanol to acetone for 10 min at -20 °C.
- Remove the slide rack and drain the excess solvent on a paper towel. After 20–30 min, place the slides in a slide box and store in a freezer at -20 °C until imaging.
3. High Resolution Imaging using SEM and EDS
- Prepare the sample as described in “SEM Imaging of Biological Samples.” Then load the sample into the SEM.
- Turn the SEM on, and adjust the working distance to around 5 mm and the accelerating voltage and beam current to 25 keV, which would normally be too high for a biological sample. However, the sample is coated for conductivity and protection.
- Start imaging and zoom to around 1,000-2,000X magnification to see the structures that would contain the nanoparticles. Note that without back-scatter detection (BSD) one cannot distinguish them below a certain depth.
- Insert the BSD under the same parameters and move the stage in the z-direction to the same working distance as before.
- Start imaging at around the same magnification and check that you are able to see high contrast in the presence of nanoparticles. Save the images.
- Use different BSD configurations (where the charges on the detector align) to choose the one that shows the highest contrast for the nanoparticles.
- Zoom-in on a high contrast area showing a nanoparticle or clump of nanoparticles.
- Open the 2nd camera of the chamber and watch as you insert the EDS into the system by pressing the down button on the SEM attachment. Once the EDS is close but not touching the BSD or the gun, release the button.
- Open the Aztec program on the EDS computer (still at workstation) and acquire an image from the SEM. Use the “point and shoot” method to click on an area very dense in contrast and nanoparticles.
- The EDS will show the spectrum of characteristic X-rays from that point. Look for both barium and titanium peaks to be identified on the graph. This confirms that what you are looking at are indeed the nanoparticles and not any kind of contamination.
- Return to the sample and use the Atlas software to map the borders of the organ on the slide. Select the “Organ” protocol for creating a mosaic image of the area, and let it run (this can take a few hours at most).
- Once the composite image is created and stitched by the software, export it as a Tif file.
- Open the Tif file in ImageJ, an open source software, and adjust contrast threshold values to highlight the areas of very high contrast (i.e., the nanoparticles). Use built-in functions to quantify the volume of nanoparticles using the pixel size defined in the Organ protocol (should be around 100 nm).
- While this procedure refers only to the 1-week sample of the mouse lung, this procedure is repeated with the samples from other weeks and other organs to compile a graph showing distribution.
- After calculating the bio-distribution for each organ for each week, biodistribution graphs will show the changes in biodistribution and concentration of nanoparticles over the course of the 8 weeks. These show the peak concentration and also provide information on how long it takes for the nanoparticles to clear from the organ.
Results
The following images illustrate how the biodistribution data can be extracted from the images. The contrast of the nanoparticles is detected by using the BSE detector, as shown in Figure 1. EDS data, which is presented in Figure 2, shows where clusters of titanium and barium correspond to areas of high contrast in the images collected using the BSE detector.

Figure 1: Secondary electron image of the lung (left) and backscatter electron image of the same area (right).

Figure 2: EDS data, showing clusters of titanium and barium in the bottom middle and the top of the image, corresponding to areas of high contrast seen using the BSE detector.
In a composite image, as shown in Figure 3, the red circles indicate areas of high contrast and suggest the locations containing nanoparticles. The volume of the white nanoparticle areas can then be calculated and averaged over the size of the organ itself. This provides a calculation of the area occupied by the nanoparticles. Then, data from multiple organs over several weeks can be aggregated to show the average particle distribution in a square micron of the image. These data are presented in Figure 4, which shows an overall decrease in the 30 nm size nanoparticles over the course of the 8 weeks, an indication of clearance. Another thing to note is the increase of the nanoparticle concentration in the liver after 4 weeks. This gives information on how the body processes the nanoparticles, and the large migration of particles to the liver show that the body may be processing the nanoparticles as toxins. This is important information to know when developing and testing nanoparticles in vivo.
Similarly, data on the organ distribution of particles of varying sizes is presented in Figure 5. This graph demonstrates how the changing size of the nanoparticles can increase the overall uptake into cells of the nanoparticles or increase the rate of clearance.
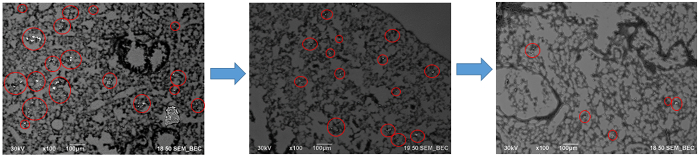
Figure 3: Sections of the composite image created using the Atlas software.

Figure 4: Biodistribution of 30 nm nanoparticles in the lung, liver, spleen, and kidney after injection in a mouse.
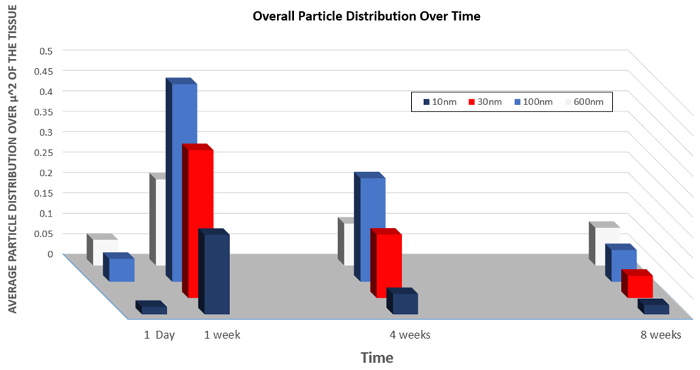
Figure 5: Biodistribution of nanoparticles of varying size over time.
Application and Summary
Nanoparticles are widely used in biomedical engineering research and have applications as imaging, diagnostic, and therapeutic agents. For example, nanoparticles are being developed for use in vaccine delivery. By encapsulating the vaccine in nanoparticles, vaccine components are protected from degradation and stimulate maximum immune response.
In magnetic resonance imaging applications, metallic nanoparticles are often used as contrast agents to visualize tissue structure and function. They are useful diagnostic probes in the detection of artherosclerotic plaques.
Nanoparticles that integrate diagnostic and therapeutic abilities are called theranostics. There nanoparticles simultaneously detect early stage tumors and deliver chemotherapeutic agents.
This experiment demonstrated how SEM can be used in order to calculate the biodistribution of nanoparticles injected into the body over time. This experiment can be replicated on other nanoparticle samples or cell cultures that have nanoparticles as a way to analyze concentrations, cell penetration, or clearance of nanoparticles.
This demonstration focused on studying and measuring the biodistribution of nanoparticles using SEM. The results of such measurements can be important in many fields. Drug companies and research facilities can use these studies for drug development and contrast agent research.
Materials List
| Name | Company | Catalog Number | Comments |
| Equipment | |||
| Sectioned Slice (prepared before) | |||
| ImageJ Open Source Software | |||
| Cross beam SEM | ZEISS | ||
| ATLAS 3-D SEM Software | ZEISS |
References
- Hadjikhani, Ali. "Nanofabrication and Spectroscopy of Magnetic Nanostructures Using a Focused Ion Beam." (2016).
Tags
Skip to...
Videos from this collection:

Now Playing
Biodistribution of Nano-drug Carriers: Applications of SEM
Biomedical Engineering
9.3K Views

Imaging Biological Samples with Optical and Confocal Microscopy
Biomedical Engineering
35.7K Views

SEM Imaging of Biological Samples
Biomedical Engineering
23.7K Views

High-frequency Ultrasound Imaging of the Abdominal Aorta
Biomedical Engineering
14.4K Views

Quantitative Strain Mapping of an Abdominal Aortic Aneurysm
Biomedical Engineering
4.6K Views

Photoacoustic Tomography to Image Blood and Lipids in the Infrarenal Aorta
Biomedical Engineering
5.7K Views

Cardiac Magnetic Resonance Imaging
Biomedical Engineering
14.7K Views

Computational Fluid Dynamics Simulations of Blood Flow in a Cerebral Aneurysm
Biomedical Engineering
11.7K Views

Near-infrared Fluorescence Imaging of Abdominal Aortic Aneurysms
Biomedical Engineering
8.2K Views

Noninvasive Blood Pressure Measurement Techniques
Biomedical Engineering
11.9K Views

Acquisition and Analysis of an ECG (electrocardiography) Signal
Biomedical Engineering
105.0K Views

Tensile Strength of Resorbable Biomaterials
Biomedical Engineering
7.5K Views

Micro-CT Imaging of a Mouse Spinal Cord
Biomedical Engineering
8.0K Views

Visualization of Knee Joint Degeneration after Non-invasive ACL Injury in Rats
Biomedical Engineering
8.2K Views

Combined SPECT and CT Imaging to Visualize Cardiac Functionality
Biomedical Engineering
11.0K Views
Copyright © 2025 MyJoVE Corporation. All rights reserved