Event-related Potentials and the Oddball Task
Overview
Source: Laboratories of Jonas T. Kaplan and Sarah I. Gimbel—University of Southern California
Given the overwhelming amount of information captured by the sensory organs, it is crucial that the brain is able to prioritize the processing of certain stimuli, to spend less effort on what might not be currently important and to attend to what is. One heuristic the brain uses is to ignore stimuli that are frequent or constant in favor of stimuli that are unexpected or unique. Therefore, rare events tend to be more salient and capture our attention. Furthermore, stimuli that are relevant to our current behavioral goals are prioritized over those that are irrelevant.
The neurophysiological correlates of attention have been experimentally examined through the use of the oddball paradigm. Originally introduced in 1975, the oddball task presents the participant with a sequence of repetitive audio or visual stimuli, infrequently interrupted by an unexpected stimulus.1 This interruption by a target stimulus has been shown to elicit specific electrical events that are recordable at the scalp known as event-related potentials (ERPs). An ERP is the measured brain response resulting from a specific sensory, cognitive, or motor event. ERPs are measured using electroencephalography (EEG), a noninvasive means of evaluating brain function in patients with disease and normally functioning individuals. A specific ERP component found across the parietal region of the scalp, known as the P300, is enhanced in response to oddball events. The P300 is a positive-going deflection in the EEG signal that occurs about between 250 and 500 ms after stimulus onset. In general, early potentials reflect sensory-motor processing while later potentials like the P300 reflect cognitive processing.
In this video, we show how to administer the oddball task using EEG. The video will cover the setup and administration of EEG, and analysis of ERPs related to both control and target stimuli in the oddball task. In this task, participants are set up with the EEG electrodes, then brain activity is recorded while they view control stimuli, interspersed with target stimuli. The procedure is similar to that of Habibi et al.2 Each time a target stimulus is presented, the participant presses a button. When the ERPs are averaged across the control and target stimuli, the neural correlates of each event can be compared in a selected time window.
Procedure
1. Participant recruitment
- Recruit 20 participants for the experiment.
- Make sure that the participants have been fully informed of the research procedures and have signed all the appropriate consent forms.
2. Data collection
- EEG preparation (Note: These steps are for use with the Neuroscan 4.3 system with Synamps 2 amplifier and a 64-channel quick cap.)
- Participants in an EEG study should not have any hair products (e.g., gel, mouse, or leave-in conditioner) in their hair prior to their participation.
- Fill 2-4, 10-ml syringes with conductive electrode-gel (i.e., Quick-gel). It is suggested to stir the gel before using it to release air bubbles.
- Brush hair and scalp thoroughly (about 5 min).
- Clean head with alcohol and cotton gauze. Also clean the skin for placement of electrodes: two mastoids (behind each ear), below and above the left eye VEO (vertical electro-ocular), and the far sides of each eye HEO (horizontal electro-ocular; Figure 1, left).
- Using two-sided adhesive disks, place the electrodes.
- Measure the head from the front (directly between the eyebrows, mid-eye) to the inion (below the bump of the head in the back). This distance will determine the size of the cap (small, medium, or large). To place the cap, mark the 10% of the measured distance on the forehead and make sure that the mid-frontal electrode (FPz) is placed on this marked point.
- Attach the face electrodes to their respective cords on the cap
- Start filling the electrodes with gel, using the blunt needle tip to scrape the hair aside underneath the electrode, so the electrode is in direct contact with the scalp. Be mindful not to injure the skin.
- Lifting up the electrode a bit makes it easier to insert the gel. In most cases, there will be hair underneath the electrode. Moving it out of the way will allow for better impedance.
- Take the participant to the soundproof room and plug in the cap and individual electrodes.
- Check the impedance of the electrode-scalp connection to keep it under 10 KΩ. If the impedance is high make sure the electrode has conductive gel and is in touch with the scalp.
- Impedance is the tendency to impede the flow of an alternating current. High impedance may increase noise in the data, and should be minimized before the study begins.
- In most cases, the hair is in the way of the electrode. Moving it out of the way should get better impedance.
- Once the impedance is acceptable for all electrodes, and EEG traces are void of noise, data collection can begin.

Figure 1: Electrode placement. Placement of the face electrodes to detect EOG artifacts (left). Diagram of measurement from directly between the eyebrows to just under the bump in the back of the head. 10% of this measurement is measured above the mid-eye mark, and this is where the FPZ electrode of the cap is placed (right).
- EEG data collection
- Prepare the participant to do the task.
- Place the participant in a chair 75 cm from the 16-in. computer screen, in a sound and light-attenuated room (acoustically and electrically shielded).
- Tell the participant that he/she will be seeing colored circles appear on the screen. Every time a green circle is seen, the participant should press a button held in his/her right hand (Figure 2).
- Show each stimulus for 1000 ms, with a 1000 ms interstimulus interval between stimulus presentations.
- Show the 64 target stimuli, randomly interspersed among 96 presentations of the non-target red circles. Repeat this sequence twice, for a total of 128 target stimulus trials and 192 non-target control trials.
- Start the system, and have continuous recording of EEG throughout the presentation of the functional task.
- EEG is amplified by amplifiers with a gain of 1024 and a band-pass of 0.01-100 Hz.
- Trials contaminated by eye-blinks and artifact rejection (approximately 15% of trials) will be eliminated off-line.
- Prepare the participant to do the task.
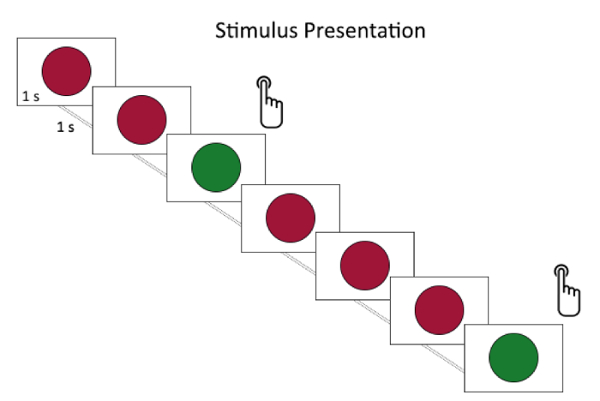
Figure 2: Study design for the oddball task. The participant is presented with either a red circle or a green circle. Each stimulus appears for 1 s, followed by a 1-s blank screen. Each time the participant sees a green circle, he is instructed to press a button held in his right hand.
3. Data analysis
- Offline, reference data to averaged mastoids.
- Segment continuous EEG data into epochs, starting 200 ms before and ending 1000 ms after the onset of the stimulus.
- Epochs are baseline corrected using the epoch 200 ms before the onset of the stimulus.
- To correct for motion artifacts, epochs with a signal change exceeding 150 microvolt at any EEG electrode were not included in the average.
- The data are digitally filtered offline (bandpass 0.05-20 Hz).
- Use the ERP averages that are displayed from the Pz recording sites for target and control stimuli.
- The peak (amplitude and latency) of the parietal P300 is automatically obtained at electrode Pz.
- Statistical analysis
- Plot ERP averages from the parietal Pz electrodes.
- For peak amplitude and latencies, use F-tests for each latency range to determine whether there is a difference between target and control stimuli.
Results
During the oddball task where participants were instructed to respond with a button press each time they saw a green circle, there was an increased parietal P300 compared to when the participant viewed the control red circle. This trace peaked approximately 350 ms following the onset of the stimulus, whereas there was no P300 peak for the control trace (Figure 3).

Figure 3: P300 parietal response to baseline and oddball images. Average ERP time trace of the parietal response to baseline images (red) and oddball images (green). The response is measured in microvolts over milliseconds.
These results show that activity in the parietal lobe increases when an oddball item is presented, reflecting the neural processes that identify task-relevant, salient stimuli. The brain increases its efficiency by identifying these items and focus resources on processing them. Stimuli which capture attention in this way are responded to more quickly, and also remembered better later.
Application and Summary
The ERP approach, due its very high temporal resolution, allows discrimination between the electrical events that correspond to extremely fast psychological processes. The oddball task demonstrates this power, in revealing an electrical signature from the parietal lobe that discriminates between two similar stimuli less than half a second after their presentation. The task provides a window into the brain's process for identifying features in the environment that have current biological importance.3
The oddball paradigm combines aspects of both bottom-up and top-down attention. Bottom-up attention refers to the exogenous ability of a stimulus to capture our attention regardless of our own willful plans or goals. This comes into play in the oddball task in that the targets are rare and different from the other stimuli in the experiment, which makes them stand out. Top-down attention refers to our ability to filter incoming information based on our current task goals. The oddball task involves aspects of top-down attention because we are instructed to respond only to the target stimuli, therefore we are consciously trying to attend to them. Research has found that the P300 potential may have early and late subcomponents, the early subcomponent (called P3a) reflecting the bottom-up saliency that is driven by the novelty of the stimulus, and the later subcomponent (called P3b) that reflects the top-down cognitive classification of the stimulus as a target. The oddball task is therefore a robust and complex probe of attentional processes.
As a reliable marker of attentional processes in the brain, the P300 elicited by the oddball task can be a useful biomarker of attentional dysfunction. For example, children with ADHD show a smaller and later P300 potential,4 and these differences tend to decrease with effective drug therapy.5
References
- Squires, N.K., Squires, K.C. & Hillyard, S.A. Two varieties of long-latency positive waves evoked by unpredictable auditory stimuli in man. Electroencephalogr Clin Neurophysiol 38, 387-401 (1975).
- Habibi, A., Wirantana, V. & Starr, A. Cortical Activity during Perception of Musical Rhythm; Comparing Musicians and Non-musicians. Psychomusicology 24, 125-135 (2014).
- Halgren, E. & Marinkovic, K. Neurophysiological networks integrating human emotions. in The Cognitive Neurosciences (ed. Gazzaniga, M.S.) 1137-1151 (MIT Press, Cambridge, MA, 1995).
- Doyle, A.E., et al. Attention-deficit/hyperactivity disorder endophenotypes. Biol Psychiatry 57, 1324-1335 (2005).
- Winsberg, B.G., Javitt, D.C. & Silipo, G.S. Electrophysiological indices of information processing in methylphenidate responders. Biol Psychiatry 42, 434-445 (1997).
Skip to...
Videos from this collection:

Now Playing
Event-related Potentials and the Oddball Task
Neuropsychology
27.4K Views

The Split Brain
Neuropsychology
68.2K Views

Motor Maps
Neuropsychology
27.4K Views

Perspectives on Neuropsychology
Neuropsychology
12.0K Views

Decision-making and the Iowa Gambling Task
Neuropsychology
32.3K Views

Executive Function in Autism Spectrum Disorder
Neuropsychology
17.6K Views

Anterograde Amnesia
Neuropsychology
30.3K Views

Physiological Correlates of Emotion Recognition
Neuropsychology
16.2K Views

Language: The N400 in Semantic Incongruity
Neuropsychology
19.5K Views

Learning and Memory: The Remember-Know Task
Neuropsychology
17.1K Views

Measuring Grey Matter Differences with Voxel-based Morphometry: The Musical Brain
Neuropsychology
17.3K Views

Decoding Auditory Imagery with Multivoxel Pattern Analysis
Neuropsychology
6.4K Views

Visual Attention: fMRI Investigation of Object-based Attentional Control
Neuropsychology
41.5K Views

Using Diffusion Tensor Imaging in Traumatic Brain Injury
Neuropsychology
16.7K Views

Using TMS to Measure Motor Excitability During Action Observation
Neuropsychology
10.1K Views
Copyright © 2025 MyJoVE Corporation. All rights reserved