Differential Scanning Calorimetry
Overview
Source: Danielle N. Beatty and Taylor D. Sparks, Department of Materials Science and Engineering, The University of Utah, Salt Lake City, UT
Differential scanning calorimetry (DSC) is an important measurement to characterize thermal properties of materials. DSC is used primarily to calculate the amount of heat stored in a material as it heats up (heat capacity) as well as the heat absorbed or released during chemical reactions or phase changes. However, measurement of this heat can also lead to the calculation of other important properties such as glassy transition temperature, polymer crystallinity, and more.
Due to the long, chain-like nature of polymers it is not uncommon for polymer strands to be entangled and disordered. As a result, most polymers are only partially crystalline with the remainder of the polymer being amorphous. In this experiment we will utilize DSC to determine polymer crystallinity.
Principles
As the name suggests, differential scanning calorimetry relies on a differential in heat flow between a sample of interest and a reference sample with known thermal properties. In fact, measuring heat accurately with a heat meter is very difficult. The measurement is further complicated by the fact that the sample is placed within a pan which also absorbs heat and the measurement typically occurs within a larger furnace. A more accurate measurement would involve monitoring the temperature of a sample and calculating what heat flow must have been present in order to produce the temperature change.
Therefore, DSC involves either the simultaneous or sequential measurement of temperatures of both a sample and a reference. To accurately measure heat in and out of the sample while accounting for thermal contributions and losses to the pan and surrounding environment, the measurement of both sample and reference should occur in the exact same environment and heat conditions. Preparations to the pan should also be consistent between reference and sample. These include crimping to seal the pan and poking a hole in the lid, to allow equilibration with the inert atmosphere in the furnace and avoid pressurization in the pan as phase changes occur in the sample.
A schematic of the DSC sample set-up and heat cell are shown in Figure 1. For each scan, the DSC contains an empty reference pan and a sample pan. The DSC reads the difference in power required to keep the reference pan and the sample pan at the set temperature (defined prior to measurement by the user). The sample pan will require more power to heat when the sample absorbs heat (in an endothermic reaction) and more power to cool when the sample gives off heat (in an exothermic reaction).

Figure 1: DSC sample set-up and heat cell schematic.
An empty pan is placed in the reference position for all DSC measurements. For all thermal characterization techniques, a baseline measurement is performed first with an empty pan inside the furnace in the sample position. This measurement accounts for atmospheric changes and is automatically subtracted from the following sample measurement. For a crystallinity measurement, a precisely measured amount of sample material is placed into a separate pan (which is placed in the sample position in the furnace) and run using the same measurement program as the baseline. Percent crystallinity is calculated using values obtained from the sample measurement. The equation used is:
% Crystallinity =  (Equation 1)
A typical DSC results curve is shown in Figure 2. The heat of melting (ΔHm) is obtained by taking the area under the endothermic peak (present during the heating phase of the measurement) and the heat of cold crystallization (ΔHc) is obtained by taking the area under the exothermic peak (present during the cooling phase of the measurement); accompanying software is used to calculate these values from the sample measurement. The known heat of melting of a 100% crystalline form of the sample (ΔHm°) is a material property that must also be known to calculate polymer percent crystallinity.
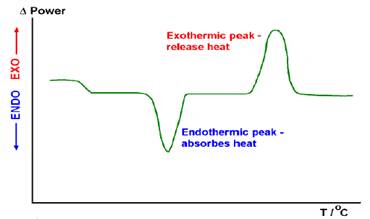
Figure 2: Schematic of a DSC results curve. Exothermic and endothermic peaks are labeled.
When performing a heat capacity measurement, one additional step is added: prior to running the sample measurement, a measurement identical to the baseline is performed with a precisely measured amount of a standard material. The standard material should be a compound with well-characterized heat capacity, such as sapphire. The sample material is then run using the same measurement program as the baseline and standard. The heat capacity and heat flow in/out of the sample are also calculated by the user in accompanying software. The baseline measurement is subtracted and the heat capacity of the standard material is used to go from temperature to heat flow.
Procedure
- Turn on the machine and allow it to warm up for about an hour.
- Check to ensure the compressed nitrogen tank and liquid nitrogen tank are both full and the valve connecting them is open. The compressed nitrogen pressure flow is set at 10 psi by the adjustment knobs on the regulator.
- Prepare two empty pans. Poke a small hole in the lid of each and seal by using the crimping press. Remove the three furnace lids and place the pans on the two circular sensors within the furnace. Replace all three lids.
- Click on the icon labeled DSC 3500 Sirius to launch the machine's software.
- Select File → New. The Measurement Definition window will open; four tabs are included that ask for information input. The first tab is the Setup tab. It contains information about the instrument and does not need to be altered for running a measurement using standard procedure.
- Click on the second tab, labeled Header. Select Correction under Measurement Type. This will save the baseline measurement as a correction file, which will later be subtracted from the sample measurement by the software.
- Input Baseline with the date as the sample Identity and Name under the Sample section.
- Under Temperature Calibration, click Select. This will open a separate window; find the most recent temperature calibration file saved to the computer and select it.
- For a percent crystallinity measurement, click Select under Sensitivity Calibration and select the most recent sensitivity calibration file saved to the computer.
- Select the third tab, labeled Temperature Program.
- Check the Purge 2 and Protective boxes listed under Step Conditions. This turns the nitrogen purge gas on for all temperature steps.
- Select Initial under Step Category and input 20 °C as the Start Temperature.
- Select Dynamic under Step Category and input a temperature for the End Temperature. This end temperature should be approximately 30 °C higher than the reported melting temperature of the polymer sample. The maximum temperature allowed by the aluminum pans is 600 °C; as a precaution do not go higher than 550 °C. Enter 10 K/min as the Heating Rate.
- Select Dynamic under Step Category and input 20 °C for the End Temperature.
- At the top of the screen, click on the drop-down arrow under LN2 for the second cooling step, which brings the furnace back to room temperature. Select Auto. This tells the temperature program to automatically turn on the liquid nitrogen to cool the furnace after the heating step has finished.
- Select Final under Step Category. Input 20 °C as the End Temperature.
- The program will ask for an Emergency Reset temperature. Input a temperature 10 °C higher than the highest temperature set in the temperature program. This is a protective setting, which stops the machine from heating higher than a set temperature in case of machine malfunction. This protects the furnace from heating to a temperature that could vaporize the sample and damage the machine.
- The program will then ask for Final Standby information. This information will hold the furnace at the final temperature for up to 2 hours to keep it equilibrated but has no effect on the data collected. Input 20 °C for the Standby Temperature, 40 K/min as the Heating Rate, and a Max Standby Time of 2 hours.
- Select the Fourth Tab, labeled Last Items.
- To the right of File Name click Select. Choose a location on the computer to save the scan and name it Baseline with the date (same name as listed under the Header tab).
- Click Forward at the bottom right hand corner of the Measurement Definition Window. A new, smaller window will appear, listing the Initial temperature as defined in the temperature program and the current furnace temperature. To start the program, the current furnace temperature must be within 5 degrees of the initial temperature.
- If the furnace temperature is within 5 degrees of the initial program temperature, click Start and the measurement will begin. If the furnace temperature is too low, click start and the machine will do a heating and equilibration step prior to beginning the measurement. If the furnace is too hot, select Diagnosis → Gases and Switches. Check the box for LN2 and allow the liquid nitrogen to flow until the temperature reaches within 5 degrees of the initial. Then uncheck the LN2 box and press Start to start the measurement.
- After the Baseline scan has run, remove the empty baseline pan and replace it with the pan containing the sample. The pans are approximately 6 millimeters in diameter with a volume of 25 microliters, and so require a very small amount of sample. Cut the sample into small pieces that fit into the pan. To ensure even heat flow and accurate DSC readings, a thin layer of the sample pieces are placed so the entire bottom of the pan is covered.
- Select File → Open. Click Okay when the program asks to delete current configuration and find and open the Baseline scan.
- The Measurement Definition Window will open to a Fast Definition page. Select Correction plus Sample under Measurement Type.
- Under the Sample section, input the sample name under Identity and Name and input the sample mass in milligrams.
- At the bottom of the window, click Select. Choose a place to name and save the scan.
- Select Forward. Press Start when the smaller window appears.
- After the measurement has finished, close the program, turn off the compressed nitrogen tank and turn off the machine.
- Find the saved measurement for the sample scan and double click on it. This will open the scan in the Proteus Analysis software.
- Use the software to find the area under the melting and recrystallization curves. These values are the heat of melting and heat of cold crystallization of the polymer sample in Joules per gram.
- The percent crystallinity can be calculated using the equation listed above:
Crystallinity =
Results
Figure 3 shows the result of a DSC percent crystallinity sample scan on a polybutylene terephthalate (PBT) polymer sample. The result is displayed as a DSC power reading (in milliwatts per milligram of sample) verses time. The power reading, the blue trace in Figure 3, indicates how much additional power was required to change the temperature of the sample pan in comparison to the empty reference pan. The temperature program is also displayed as the dashed red line in Figure 3. The first peak in the blue trace is an endothermic peak; its area gives a value for the heat of melting of the polymer sample. The second peak is an exothermic peak whose area gives a value for the heat of crystallization of the polymer sample.
Figure 4 shows zoomed views of the endothermic and exothermic peaks from the PBT scan (Figure 3). The area of each peak is shown (calculated using the Proteus Analysis software). From these calculated values, the percent crystallinity of this PBT polymer sample is calculated using Equation 1 and a reported value of 142 J/g for ΔHm°:
% Crystallinity = 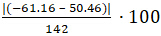 = 78.6% crystalline
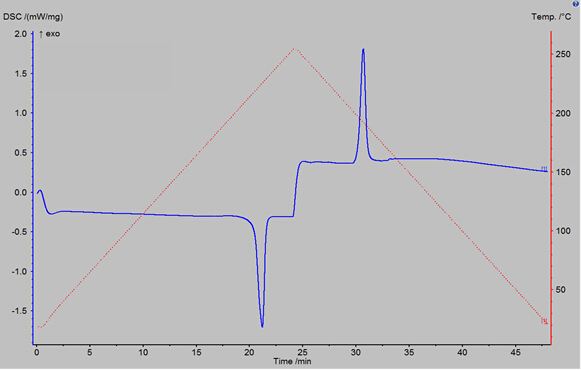
Figure 3: DSC reading vs time for a polybutylene terephthalate polymer sample, run using the DSC 3500. The temperature program used is also shown as the red dashed curve.

Figure 4: Zoomed view of the endothermic peak (A) and the exothermic peak (B) of PBT polymer DSC scan. Areas under each curve are calculated; these correspond to the heat of melting and heat of cold crystallization of the PBT polymer sample, respectively.
Application and Summary
Differential scanning calorimetry is a technique used to determine many thermal properties of materials, such as heat of melting, heat of crystallization, heat capacity, and phase changes. DSC measurements can also be used to calculate additional material properties including glassy transition temperature and polymer percent crystallinity. The DSC requires very small samples that must conform to the size and shape of the pans used in the machine and is based on a differential heat comparison between an empty reference and a sample. Polymer percent crystallinity calculations are relatively simple if the heat of melting of a 100% crystalline form of the polymer being tested is known. Other characterization methods that can determine percent crystallinity include density measurements, which also require a 100% crystalline and a 100% amorphous version of the polymer, and X-ray diffraction, which requires a sample that can be thoroughly mixed with a standard material such as silicon.
Percent crystallinity is an important parameter that significantly contributes to many of the properties of polymer materials used every day. Percent crystallinity plays a role in how brittle (high crystallinity) or how soft and ductile (low crystallinity) a polymer is. Polyethylene is one of the most widely used polymer materials and is a good example of the importance of crystallinity to material properties. HDPE (high density polyethylene) is a more crystalline form and thus is a harder, more brittle plastic used in garbage bins and cutting boards, whereas LDPE (low density polyethylene) has a lower crystallinity and is thus a ductile plastic used in disposable plastic shopping bags. Polymer crystallinity can also affect transparency and color; polymers with higher crystallinity are more difficult to color and are often more opaque. Percent crystallinity plays a large role in how we create and use different plastics and different forms of the same plastic every day, from polymers used in fabrics, to those used in bullet proof vests. Other polymeric characteristics that can affect these properties, and can contribute to percent crystallinity values, include previous heat treatments and degree of crosslinking.
Skip to...
Videos from this collection:

Now Playing
Differential Scanning Calorimetry
Materials Engineering
37.1K Views

Optical Materialography Part 1: Sample Preparation
Materials Engineering
15.3K Views

Optical Materialography Part 2: Image Analysis
Materials Engineering
10.9K Views

X-ray Photoelectron Spectroscopy
Materials Engineering
21.5K Views

X-ray Diffraction
Materials Engineering
88.2K Views

Focused Ion Beams
Materials Engineering
8.8K Views

Directional Solidification and Phase Stabilization
Materials Engineering
6.5K Views

Thermal Diffusivity and the Laser Flash Method
Materials Engineering
13.2K Views

Electroplating of Thin Films
Materials Engineering
19.6K Views

Analysis of Thermal Expansion via Dilatometry
Materials Engineering
15.6K Views

Electrochemical Impedance Spectroscopy
Materials Engineering
23.0K Views

Ceramic-matrix Composite Materials and Their Bending Properties
Materials Engineering
8.0K Views

Nanocrystalline Alloys and Nano-grain Size Stability
Materials Engineering
5.1K Views

Hydrogel Synthesis
Materials Engineering
23.5K Views
Copyright © 2025 MyJoVE Corporation. All rights reserved