Turbulence Sphere Method: Evaluating Wind Tunnel Flow Quality
Overview
Source: Jose Roberto Moreto and Xiaofeng Liu, Department of Aerospace Engineering, San Diego State University, San Diego, CA
Wind tunnel tests are useful in the design of vehicles and structures that are subjected to airflow during their use. Wind tunnel data are generated by applying a controlled air flow to a model of the object being studied. The test model usually has a similar geometry but is a smaller scale compared to the full-sized object. To ensure accurate and useful data is collected during low speed wind tunnel tests, there must be a dynamic similarity of the Reynolds number between the tunnel flow field over the testing model and the actual flow field over the full-sized object.
In this demonstration, wind tunnel flow over a smooth sphere with well-defined flow characteristics will be analyzed. Because the sphere has well-defined flow characteristics, the turbulence factor for the wind tunnel, which correlates the effective Reynolds number to the test Reynolds number, can be determined, as well as the free-stream turbulence intensity of the wind tunnel.
Principles
To maintain dynamic similarity in low-speed flows, the Reynolds number of an experiment must be the same as the Reynolds number of the flow phenomenon being studied. However, experiments performed in different wind tunnels and in free air, even at the same Reynolds number, could provide different results. These differences may be attributed to the effect of the free-stream turbulence inside the wind tunnel test section, which could be perceived as a higher "effective Reynolds number" for the wind tunnel test [1].
A simple method that is used to obtain the effective Reynolds number for a wind tunnel and estimate its turbulence intensity is the use of the turbulence sphere. This method obtains an indirect measurement of the turbulence intensity by determining the turbulence factor of the wind tunnel. The turbulence factor, TF, correlates the effective Reynolds number, Reff, with the tunnel Reynolds number, Retest, as

The turbulence intensity can be measured directly by a hotwire anemometry, Laser Doppler Velocimetry, or Particle Image Velocimetry flow field survey. Before the introduction of these direct measurement methods, a turbulence sphere was the primary way to measure the relative turbulence of a wind tunnel. Since the direct methods are usually time consuming and expensive, the conventional turbulence sphere method still remains a fast and inexpensive alternative for gauging air flow quality.
The turbulence sphere method relies on two empirical results: the sphere drag crisis and the strong correlation between the critical Reynolds number, Rec, and the flow turbulence intensity. The drag crisis refers to the phenomenon that the sphere drag coefficient, Cd, suddenly drops off due to the backward shift of the flow separation point. When the flow reaches the critical Reynolds number, the boundary layer transition from laminar flow to turbulent flow occurs very close to the leading edge of the sphere. This early transition causes a delayed flow separation because the turbulent boundary layer is better able to negotiate an adverse pressure gradient for a longer distance and is therefore less prone to separation than the laminar boundary layer. The delayed separation promotes better pressure recovery, which reduces the size of the wake and the pressure drag and significantly decreases the overall drag.
The turbulence spheres used in this demonstration have one pressure tap at the leading edge and four pressure taps at points located 22.5° from the trailing edge. Three spheres with diameters of 4.0, 4.987 and 6.0 in, respectively, will be investigated. For a smooth sphere, the critical Reynolds number is well defined and occurs when CD = 0.3. This corresponds to a value of ΔP/q = 1.220, where ΔP is the difference between the average pressure measured at the four rear pressure ports and the stagnation pressure at the sphere leading edge, and q is the flow dynamic pressure.
While Rec is well defined by CD and ΔP/q, it strongly depends on flow turbulence. This demonstration using spheres can be used to define the turbulence factor. Early flight measurements found that in the free atmosphere, Rec = 3.85 x 10⁵ for a smooth sphere. The free air critical Reynolds is correlated to the wind tunnel turbulence by the following equation:

Procedure
1. Preparation of turbulence sphere in the wind tunnel
- Connect the wind tunnel pitot tube to port #1 on the pressure scanner, and connect the static pressure port to port #2 on the pressure scanner.
- Lock external balance.
- Fix the sphere strut to the balance support inside the wind tunnel.
- Install the sphere with 6 in diameter.
- Connect the leading-edge pressure tap to port #3 on the pressure scanner, and connect the four aft pressure taps to port #4 on the pressure scanner.
- Attach the air supply line to the pressure regulator, and set the pressure to 65 psi.
- Connect the manifold of the pressure scanner to the pressure line.
- Start up the data acquisition system and pressure scanner. Make sure to turn them on at least 20 minutes prior to the test.
- Estimate the maximum dynamic pressure based on the free-air critical Reynolds number for a smooth sphere:
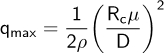 . See Tables 1 and 2 for recommended test parameters.
 - Define the dynamic pressure test range from 0 to qmax and define the test points by dividing the range in 15 intervals.
Table 1. Parameters for the first test.
| Sphere diameter (in) | qMin [in H2O] | qMax [in H2O] |
| 4 | 4 | 6 |
| 4.987 | 2 | 3.4 |
| 6 | 1 | 2.4 |
Table 2. Parameters for the second test.
| Sphere diameter (in) | qMin [in H2O] | qMax [in H2O] |
| 4 | 3.4 | 7.2 |
| 4.987 | 1.3 | 5.1 |
| 6 | -- | -- |
2. Conducting stabilization and pressure scan measurement
- Read the barometric pressure and room temperature and record the values.
- Apply the corrections to the barometric pressure using equations provided by the manometer manufacturer.
- Setup the data acquisition software and connect it to the pressure scanner, setting the proper IP address.
- Insert the following commands pressing enter after each command.
>calz
>set chan1 0
>set chan 1-1..1-4
>set fps 10 - Check that the test section and wind tunnel are free from debris.
- Close the test section doors.
- Set the wind tunnel speed dial to zero.
- Turn on the wind tunnel and wind tunnel cooling system.
- With the wind speed at 0 mph, start recording data, then insert the following command to scan the pressure:
>scan - Record the wind tunnel air temperature.
- Increase the wind speed up to the next test point dynamic pressure as defined in step 1.10.
- Wait until the airspeed stabilizes, then repeat steps 2.9 - 2.11 until the last test point is executed.
- Slowly reduce the airspeed to zero.
- When all the points have been measured, replace the 6 in sphere with the next sphere following steps 1.2 - 1.5.
- Repeat steps from 2.3 - 2.14 to repeat the stabilization and pressure scan experiments.
- Wait the wind tunnel to cool down after the test is executed for all three spheres.
- Turn off the wind tunnel and data acquisition software.
Results
For each sphere, the stagnation pressure and the pressure at the aft ports were measured. The difference between these two values gives the pressure difference, ΔP. The total pressure, Pt, and static pressure, Ps, of the test section were also measured, which are used to determine the test dynamic pressure, q = Pt - Ps, and the normalized pressure  . The ambient air pressure, Pamb, and the airflow temperature was also recorded to calculate the air flow properties, including the air density, ρtest, and viscosity, μtest. The density is obtained using the ideal gas law, and the viscosity is obtained using Sutherland's formula. Once the air density and viscosity are determined, the test Reynolds number can be computed.
By plotting the test Reynolds number with respect to the normalized pressure difference, the critical Reynolds number for each sphere was determined (Figure 1). The critical Reynolds number corresponds to a normalized pressure value of = 1.220. The three curves for the three spheres provide a more accurate estimate of the critical Reynolds number, ReCtunnel, because an averaged value is used. With the ReCtunnel estimate, the turbulence factor, TF, and the effective Reynolds number can be determined according to the following equations:

and

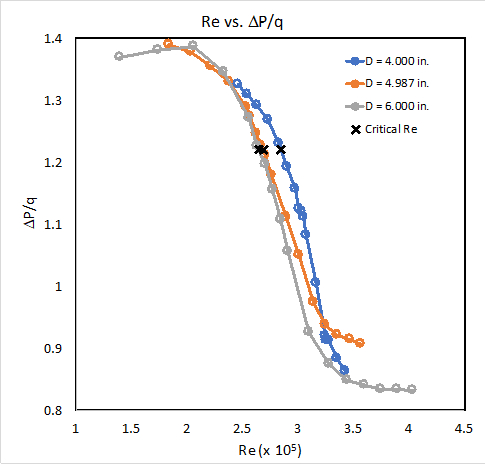
Figure 1. Critical Reynolds number for each sphere.
Application and Summary
Turbulence spheres are used to determine wind tunnel turbulence factor and estimate the turbulence intensity. This is a very useful method to evaluate a wind tunnel flow quality because it is simple and efficient. This method does not directly measure the air velocity and velocity fluctuations, such as hotwire anemometry or particle image velocimetry, and it cannot provide a complete survey of the flow quality of the wind tunnel. However, a complete survey is extremely cumbersome and expensive, so it is not suitable for periodic checks of the wind tunnel turbulence intensity.
The turbulence factor can be checked periodically, such as after making minor modifications to the wind tunnel, to gauge the flow quality. These quick checks can indicate the necessity of a complete flow turbulence survey. Other important information obtained from the turbulence factor is the effective Reynolds number of the wind tunnel. This correction on the Reynolds number is important to ensure the dynamic similarity and the usefulness of data obtained from scaled models and their application to full-scale objects.
The turbulence sphere principle can be also used to estimate the turbulence level in other environments besides the wind tunnel test section. For example, this method can be used to measure inflight turbulence. A turbulence probe can be developed based on the principles of the turbulence sphere and installed in airplanes to measure turbulence levels in the atmosphere in real-time [2].
Another application is the study of flow structures during a hurricane. In situ measurements of the flow inside a hurricane can be extremely dangerous and complicated to obtain. Methods like hotwire anemometry and particle image velocimetry are unattainable in these conditions. The turbulence sphere principle can be used to make an expendable measurement system which can be placed in a region prone to hurricanes to measure the flow turbulence inside a hurricane safely and at a low cost [3].
| Name | Company | Catalog Number | Comments |
| Equipment | |||
| Low-speed wind tunnel | SDSU | Closed return type with speeds in the range 0-180 mph | |
| Test section size 45W-32H-67L inches | |||
| Smooth spheres | SDSU | Three spheres, diameters 4", 4.987", 6" | |
| Miniature pressure scanner | Scanivalve | ZOC33 | |
| Digital Service Module | Scanivalve | DSM4000 | |
| Barometer | |||
| Manometer | Meriam Instrument Co. | 34FB8 | Water manometer with 10" range. |
| Thermometer |
References
- Barlow, Rae and Pope. Low speed wind tunnel testing, John Wiley & Sons, 1999.
- Crawford T.L. and Dobosy R.J. Boundary-Layer Meteorol. 1992. 59; 257-78.
- Eckman R.M., Dobosy R.J., Auble D.L., Strong T.W., and Crawford T.L. J. Atmos. Ocean. Technol. 2007; 24; 994-1007.
Skip to...
Videos from this collection:

Now Playing
Turbulence Sphere Method: Evaluating Wind Tunnel Flow Quality
Aeronautical Engineering
8.7K Views

Aerodynamic Performance of a Model Aircraft: The DC-6B
Aeronautical Engineering
8.3K Views

Propeller Characterization: Variations in Pitch, Diameter, and Blade Number on Performance
Aeronautical Engineering
26.2K Views

Airfoil Behavior: Pressure Distribution over a Clark Y-14 Wing
Aeronautical Engineering
21.0K Views

Clark Y-14 Wing Performance: Deployment of High-lift Devices (Flaps and Slats)
Aeronautical Engineering
13.3K Views

Cross Cylindrical Flow: Measuring Pressure Distribution and Estimating Drag Coefficients
Aeronautical Engineering
16.1K Views

Nozzle Analysis: Variations in Mach Number and Pressure Along a Converging and a Converging-diverging Nozzle
Aeronautical Engineering
37.9K Views

Schlieren Imaging: A Technique to Visualize Supersonic Flow Features
Aeronautical Engineering
11.4K Views

Flow Visualization in a Water Tunnel: Observing the Leading-edge Vortex Over a Delta Wing
Aeronautical Engineering
8.0K Views

Surface Dye Flow Visualization: A Qualitative Method to Observe Streakline Patterns in Supersonic Flow
Aeronautical Engineering
4.9K Views

Pitot-static Tube: A Device to Measure Air Flow Speed
Aeronautical Engineering
48.7K Views

Constant Temperature Anemometry: A Tool to Study Turbulent Boundary Layer Flow
Aeronautical Engineering
7.2K Views

Pressure Transducer: Calibration Using a Pitot-static Tube
Aeronautical Engineering
8.5K Views

Real-time Flight Control: Embedded Sensor Calibration and Data Acquisition
Aeronautical Engineering
10.2K Views

Multicopter Aerodynamics: Characterizing Thrust on a Hexacopter
Aeronautical Engineering
9.1K Views
Copyright © 2025 MyJoVE Corporation. All rights reserved