
Gas Chromatography (GC) with Flame-Ionization Detection
Overview
Source: Laboratory of Dr. B. Jill Venton - University of Virginia
Gas chromatography (GC) is used to separate and detect small molecular weight compounds in the gas phase. The sample is either a gas or a liquid that is vaporized in the injection port. Typically, the compounds analyzed are less than 1,000 Da, because it is difficult to vaporize larger compounds. GC is popular for environmental monitoring and industrial applications because it is very reliable and can be run nearly continuously. GC is typically used in applications where small, volatile molecules are detected and with non-aqueous solutions. Liquid chromatography is more popular for measurements in aqueous samples and can be used to study larger molecules, because the molecules do not need to vaporize. GC is favored for nonpolar molecules while LC is more common for separating polar analytes.
The mobile phase for gas chromatography is a carrier gas, typically helium because of its low molecular weight and being chemically inert. Pressure is applied and the mobile phase moves the analyte through the column. The separation is accomplished using a column coated with a stationary phase. Open tubular capillary columns are the most popular columns and have the stationary phase coated on the walls of the capillary. Stationary phases are often derivatives of polydimethylsiloxane, with 5–10% of the groups functionalized to tune the separation. Typical functional groups are phenyl, cyanopropyl, or trifluoropropyl groups. Capillary columns are usually 5–50 m long. Narrower columns have higher resolution but require higher pressures. Packed columns can also be used where the stationary phase is coated onto beads packed in the column. Packed columns are shorter, 1–5 m. Open tubular capillaries are generally preferred because they allow higher efficiencies, faster analyses, and have higher capacities.
Flame-ionization detection (FID) is a good general detector for organic compounds in GC that detects the amount of carbon in a sample. After the column, samples are burned in a hot, hydrogen-air flame. Carbon ions are produced by the combustion. While the overall efficiency of the process is low (only 1 in 105 carbon ions produce an ion in the flame) the total amount of ions is directly proportional to the amount of carbon in the sample. Electrodes are used to measure the current from the ions. FID is a destructive detector, as the entire sample is pyrolyzed. FID is unaffected by noncombustible gases and water.
Principles
The equilibrium for gas chromatography is partitioning, and the components of the sample will partition (i.e. distribute) between the two phases: the stationary phase and the mobile phase. Compounds that have greater affinity for the stationary phase spend more time in the column and thus elute later and have a longer retention time (tR) than samples that have higher affinity for the mobile phase. Affinity for the stationary phase is driven mainly by intermolecular interactions and the polarity of the stationary phase can be chosen to maximize interactions and thus the separation. Ideal peaks are Gaussian distributions and symmetrical, because of the random nature of the analyte interactions with the column. Asymmetrical peak features, such as peak fronting or tailing, can be due to overloading the column, injection problems, or the presence of adsorptive functional groups such as carboxylic acids.
In GC, the temperature is adjusted to change the equilibrium and thus the elution times. Separations in GC are based on volatility because higher boiling point substances may condense on a column if the temperature is low, thus they are not eluted or take a long time to elute. Isothermal separations are performed at one temperature or gradient separations are performed where the temperature is ramped up during the separation. Temperature ramps allow both low- and high-boiling point compounds to be separated in the same separation.
The readout produced by GC is a chromatogram that gives the signal over time. Peaks are observed for each compound in the sample. For each peak, a peak height and a peak area can be calculated. Peak area is generally used to make calibration curves and to calculate concentrations of samples in unknowns. The number of theoretical plates (N) is calculated from each peak to give a measure of column efficiency. A practical equation for measuring N is N=16(tR/W)2 where tR is the retention time of the analyte and W is the width of the bottom of the peak. N is used to compare separations on different columns.
The flame-ionization detector is mass sensitive. Thus, the amount of signal is proportional to the mass of carbon in the sample, not the number of moles. Compounds with more carbon give greater signals. The burning of carbon produces ions which are detected as a current. FID is one of the most sensitive general detectors for GC with a limit of detection in the picogram range. The response is linear over seven orders of magnitude, giving it a large linear range.
Procedure
1. Initialization of the GC
- Turn on the helium carrier gas and air and adjust the pressure gauges on the instrument.
- Turn on the column oven to a high temperature (typically 250 °C or above) to bake in the column. Do not exceed the maximum temperature of the column. This will remove any contaminants. Let it bake for at least 30 min before running a sample.
2. Making a Methods File
- In the software controlling the instrument, input all the desired values for a methods file. First, set the autosampler settings. Set the number of pre-run rinses, post-run rinses, and rinses with sample. These rinses clean the column between different samples.
- The amount injected is typically 1 µL. A split ratio is usually set because injecting all of a sample might overload the column. If the split ratio is 100:1, this means that for every 1 part that is injected into the instrument 100 parts goes to waste.
- Input the mobile phase parameters. The flow rate is controlled by the pressure set. Faster flow rates lead to faster separations, but there is less time for the analyte to interact with the column.
- Enter the temperature programming. For an isothermal run, enter the temperature of the separation and then a time for the separation. For a gradient elution, enter the starting temperature and hold time, the ending temperature and hold time, and the ramp speed in °C/min. An equilibration time is also set that allows the column to cool back down the original temperature between runs.
- Enter the detector parameters. A detector temperature and sampling rate will be entered. The detector must always be a higher temperature than the column temperature so that no analyte condenses on the detector.
- Save the methods file. The parameters may also need to be downloaded so they are read by the GC.
3. Collection of GC Data
- Turn on the hydrogen gas and make sure the pressure gauge is set correctly. Light the flame of the FID.
- On the autosampler rack, fill the wash vial with wash solvent, like acetonitrile or methanol. Make sure the waste vial is empty.
- Prepare the sample. If there is any chance of particulates in the sample, filter the sample. Because plastic residues can sometimes be seen with GC, use only glass syringes and glass vials to prepare your sample.
- Fill the vial at least half way with sample so the autosampler syringe is ensured to pick up the sample. Autosampler vials are typically 2 mL, but if sample volume is limited, vial inserts are available to reduce the sample volume needed.
- Load the sample vial(s) into the autosampler rack. Keep track of what position each sample is in.
- Before the run, zero the baseline of the chart recorder on the computer software.
- Files can be collected either as a single run or using a batch table for multiple runs. Make sure to specify the correct vial number for the sample. Hit the "start" button and make a file.
- Data is typically analyzed with a software program. Parameters that can be measured include retention time, peak height, peak area, and number of theoretical plates.
4. Results: GC Analysis of Coffee Samples
- In this example, GC-FID analysis was performed for caffeine and palmitic acid, two compounds found in coffee. The caffeine is less polar than the palmitic acid, which has a long chain alkane tail. Thus, the caffeine is less retained and elutes first on the nonpolar column of 95% dimethylpolysiloxane and 5% phenyl-arylene (Figure 1).
- From the chromatogram, the peak areas can be calculated. The peak areas are proportional to the mass of carbon that goes through the detector and they can be used to make a calibration curve of instrument response vs concentration. For Figure 1, the peak area is 27,315 for caffeine and 18,852 for palmitic acid.
- A measure of column efficiency is N, the number of theoretical plates. N can be calculated from the chromatogram for each peak. For Figure 1, N is 283,000 for caffeine and 261,000 for palmitic acid.
- Figure 2 shows the effect of temperature on isothermal separations. Two separations are overlaid of the same caffeine and palmitic acid sample. The first is at 180 °C and the second at 200 °C. The retention times are much smaller for the higher temperature run.
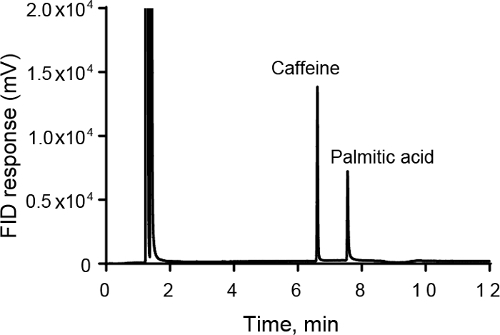
Figure 1. GC-FID analysis of caffeine and palmitic acid samples. The 5 mM caffeine standard elutes first, followed by the 1 mM palmitic acid sample. The temperature ramp was 0.1 min at 150 °C followed by a ramp at 10 °C/min to 220 °C where the temperature was held for 5 min.

Figure 2. GC-FID analysis of isothermal runs of a dark roast coffee sample. A comparison of GC-FID runs at 180 °C and 200 °C for a dark roast coffee sample. The peaks elute much quicker with the 200 °C temperature.
Application and Summary
GC is used for a variety of industrial applications. For example, it is used to test the purity of a synthesized chemical product. GC is also popular in environmental applications. GC is used to detect pesticides, polyaromatic hydrocarbons, and phthalates. Most air quality applications use GC-FID to monitor environmental pollutants. GC is also used for headspace analysis, where the volatiles that are evaporated from a liquid are collected and measured. This is useful for the cosmetic and food and beverage industries. GC is used for forensic applications as well, such as detecting drugs of abuse or explosives. In addition, GC is useful in the petroleum industry for measuring hydrocarbons. The extensive applications makes GC a billion dollar per year worldwide market.
Figure 3 shows an example of how GC could be used in the food industry. Figure 3 shows a chromatograph of artificial vanilla (black) and real vanilla (red). GC can be used to identify the real sample, which contains a large peak for vanillin but does not contain a second peak for ethylvanillin.
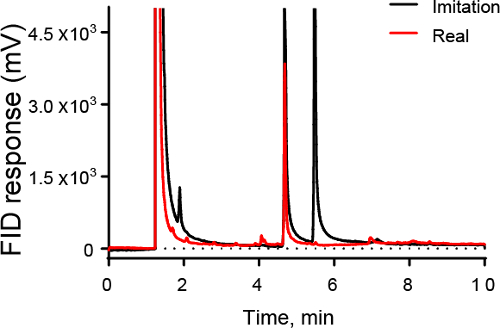
Figure 3. GC-FID chromatogram of vanilla samples. Both imitation and real vanilla show large peaks at 4.7 min due to vanillin, the principle component of vanilla. However, imitation vanilla also has a large peak at 5.3 min, which is due to ethylvanillin, a compound not present in large quantities in real vanilla.
Tags
Skip to...
Videos from this collection:

Now Playing
Gas Chromatography (GC) with Flame-Ionization Detection
Analytical Chemistry
281.9K Views

Sample Preparation for Analytical Characterization
Analytical Chemistry
84.6K Views

Internal Standards
Analytical Chemistry
204.7K Views

Method of Standard Addition
Analytical Chemistry
320.0K Views

Calibration Curves
Analytical Chemistry
796.5K Views

Ultraviolet-Visible (UV-Vis) Spectroscopy
Analytical Chemistry
623.3K Views

Raman Spectroscopy for Chemical Analysis
Analytical Chemistry
51.2K Views

X-ray Fluorescence (XRF)
Analytical Chemistry
25.4K Views

High-Performance Liquid Chromatography (HPLC)
Analytical Chemistry
384.3K Views

Ion-Exchange Chromatography
Analytical Chemistry
264.4K Views

Capillary Electrophoresis (CE)
Analytical Chemistry
93.8K Views

Introduction to Mass Spectrometry
Analytical Chemistry
112.2K Views

Scanning Electron Microscopy (SEM)
Analytical Chemistry
87.1K Views

Electrochemical Measurements of Supported Catalysts Using a Potentiostat/Galvanostat
Analytical Chemistry
51.4K Views

Cyclic Voltammetry (CV)
Analytical Chemistry
125.1K Views
Copyright © 2025 MyJoVE Corporation. All rights reserved