Flow Visualization in a Water Tunnel: Observing the Leading-edge Vortex Over a Delta Wing
Genel Bakış
Source: Jose Roberto Moreto, Gustaaf Jacobs and Xiaofeng Liu, Department of Aerospace Engineering, San Diego State University, San Diego, California
The delta wing, shown in Figure 1D, is a popular design in high-speed airplanes due to its superb performance in transonic and supersonic flight regimes. This type of wing has a small aspect ratio and high sweep angle, which reduces drag at high subsonic, transonic and supersonic flight regimes. The aspect ratio is defined as the wing span divided by the average chord  .
.
An important advantage of the delta wing is its high stall angle. The stall of a delta wing is delayed compared to the stall of a high aspect ratio wing. This is because the lift of a delta wing is enhanced by the leading-edge vortex over the wing.
An effective way to observe this vortex flow phenomenon and study the vortex breakdown in a delta wing is by visualizing the flow in a water tunnel. By injecting dye in the flow surrounding a model from dye ports on the leading-edge, the vortex development and breakdown can be observed and its position measured. The data can also be used to estimate the stall angle.

Figure 1. Typical wing planform shapes: A) Rectangular, with constant chord along span, B) elliptical, C) tapered, with variable chord along the span, and D) delta wing, an aft-swept wing with zero taper ratio.
İlkeler
When a delta wing is subjected to slightly higher angles of attack, usually angles exceeding 7°, a flow separation occurs at the leading-edge. Instead of the flow separation occurring downstream near the trailing edge, as it would happen in a rectangular wing, the roll up of the leading-edge vortices, as shown in Figure 2, induce low pressure on the upper surface of the wing and enhance the lift. This phenomenon is called vortex lift and contributes to a delayed high stall angle compared to the stall angle of a rectangular wing.

Figure 2. Vortex formation over a delta wing at a moderate angle of attack. A) Top view with a blue streakline showing the core and vortex forming at the wing apex, and the green streakline showing the vortex rollup from the leading edge at half chord. B) Side view with the vortex rollup. The vortex originating from the apex (blue dye) interacts with the vortex generated at half chord (green dye).
These vortices start at the wing apex and progress downstream where at some point they burst (vortex breakdown) due to a high adverse pressure gradient. Once vortex breakdown occurs, the vortex can no longer induce low pressure. For relatively low angles of attack, the vortex breakdown occurs downstream of the trailing-edge. However, when the angle of attack increases, the location of the vortex breakdown moves upstream, to a point where the breakdown occurs over most of the wing surface. This reduces the lift and causes the wing to stall.
These vortex patterns can be observed using flow visualization with dye in a water tunnel. A steady stream of dye is released through ports at appropriate locations on the model near the leading edge. The dye mixes with the water and follows the flow allowing visualization of streaklines. The dyed flow is tracked, and vortex formation, development, and interaction with other vortices and flow structures is observed until the vortex breakdown.
The dye and the water in the tunnel should have similar physical properties, and the release pressure at the port opening should be the same as the local flow pressure to minimize disturbances to the flow. The streaklines, formed by the dye, highlight various flow structures, such as vortices, laminar regions, turbulent regions and transition regions. These structures can be observed and used to compare the effects of different geometries or model attitudes on flow.

Figure 3. Delta wing experimental setup. A) Delta wing mounted in the C-strut inside a water tunnel test section. B) C-Strut connection to the walls of the water tunnel. C) Dye containers, pressurized air supply, and three valves to control the dye flow rate.
Prosedür
1. Preparing the water tunnel
- Obtain three 500-mL containers, and fill each container at least half-full with dye. There should be one container with blue dye, one with green dye and one with red dye. The concentration is not important because the dye flow rate will be adjusted accordingly.
- Install the delta wing on its support in the water tunnel. Attach the C-strut support to the water tunnel with screws, keeping the yaw angle at zero. See Figure 3.
- Fill the water tunnel with water.
- Position one camera to capture a top view of the wing, and a second camera to capture the side view.
2. Visualizing streaklines over a delta wing
- Set the angle of attack to zero by adjusting the angle on the C-strut.
- Set the water tunnel flow speed to 4 in/s, and allow the flow to stabilize.
- Supply pressure to the dye reservoirs using the pump.
- Observe the streaks of dye, then adjust the dye flow rate as needed to have a continuous streak. There is no set flow rate for the dye. Apply all of the colors at the same time. Each color is applied to a different region of the wing to visualize vortex interactions. See Figure 2.
- Press record on each camera to start capturing footage. Observe the vortex interactions and identify the vortex roll-up and primary vortex core.
- Record at least 10 s of the vortex.
- Increase the angle of attack to 5°, wait for the flow and streaklines to stabilize, and record the vortices for 10 s.
- Repeat the experiment by increasing the angle of attack by 5° increments from 0 - 55°.
- If the water becomes too murky, causing the streaklines to appear dull, close the dye supply, stop the tunnel and replace it with fresh water before proceeding.
- When all trials have been performed, turn off the cameras, and close the dye supply.
- Turn off the tunnel, drain the water from the tank, and wash off any remnants of dye from the walls of the tunnel.
Sonuçlar
From the experiment, we can identify the vortex breakdown, as illustrated in Figure 4. The distance from the wing apex to the vortex breakdown can be measured using the scale drawn in the wing (Figure 4B). During the experiment, the angle of attack of the wing was incrementally increased, and the vortex breakdown location, lb, with respect to the wing apex, was measured. The breakdown location, x/c, with respect to the wing trailing edge was graphed against the angle of attack, as shown in Figure 5. When α ≈ 10°, the time-averaged position of the leading-edge vortex breakdown is located at the trailing edge of the delta wing. Along with an increase in the angle of attack, the location of the vortex breakdown gradually moved upstream. When α ≈ 40°, the vortex breakdown occurred at 96% chord location from the trailing edge, almost at the apex of the delta wing. At this attitude, the delta wing experiences a full stall, a total loss of lift.
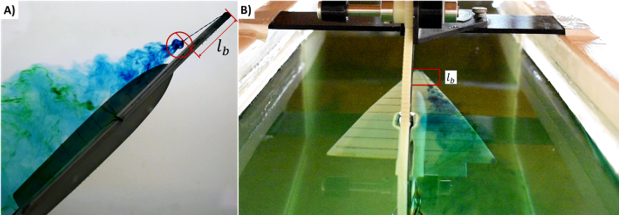
Figure 4. Vortex breakdown identification. A) Side view of vortex breakdown and the distance of vortex breakdown from wing apex lb. B) Top view of the vortex breakdown and the distance from the wing apex lb.
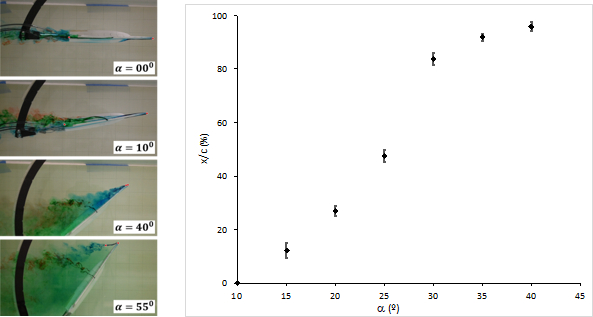
Figure 5. Vortex breakdown location. For angles of attack < 10°, the vortex breakdown occurred downstream of the wing. For angles of attack >40°, the flow separates at the wing tip.
Başvuru ve Özet
By using flow visualization in a water tunnel, the vortex breakdown locations for various angle of attacks in a delta wing were identified. Flow visualization in a water tunnel is performed by injecting dye into specific locations of the flow field. The dye follows the flow, which enables us to observe the flow streaklines. This method is similar to the smoke visualization technique that is used in a wind tunnel. However, the ability to use multiple different dye colors allowed easy visualization of the flow structures and interactions. Another advantage of this method is that it is a low cost technique that supplies 3D information of the flow field.
Dye injection for flow visualization is a classical method with numerous applications. For example, the famous Reynolds experiment on turbulence in pipe flow was executed using dye for the visualization, and it identified laminar and turbulent flow regions in circular pipes. This technique can be used not only to identify the turbulent regions but can also be used to study the mixing that is promoted by turbulence to study other flow structures.
Flow structures, such as vortices and separation bubbles, provide important information about the physics governing phenomena, including the vortex lift. Therefore, this method can be used for flow visualization to aid in the design and optimization of devices affected by flow fields, such as automobiles, ships, tall buildings, and long bridges.
| Name | Company | Catalog Number | Comments |
| Equipment | |||
| University Desktop Water Tunnel | Rolling Hills Research Corporation | Model 0710 | Test section 7" x 10" x 18" (WxHxL) |
| Down Stream Window 7" x 9.5" (WxH) | |||
| Flow Velocity 2 to 5 in./sec. | |||
| Red dye | |||
| Green dye | |||
| Blue dye | |||
| Video camera | |||
| Delta wing | SDSU |
Etiketler
Atla...
Bu koleksiyondaki videolar:

Now Playing
Flow Visualization in a Water Tunnel: Observing the Leading-edge Vortex Over a Delta Wing
Aeronautical Engineering
8.0K Görüntüleme Sayısı

Aerodynamic Performance of a Model Aircraft: The DC-6B
Aeronautical Engineering
8.3K Görüntüleme Sayısı

Propeller Characterization: Variations in Pitch, Diameter, and Blade Number on Performance
Aeronautical Engineering
26.1K Görüntüleme Sayısı

Airfoil Behavior: Pressure Distribution over a Clark Y-14 Wing
Aeronautical Engineering
21.0K Görüntüleme Sayısı

Clark Y-14 Wing Performance: Deployment of High-lift Devices (Flaps and Slats)
Aeronautical Engineering
13.3K Görüntüleme Sayısı

Turbulence Sphere Method: Evaluating Wind Tunnel Flow Quality
Aeronautical Engineering
8.7K Görüntüleme Sayısı

Cross Cylindrical Flow: Measuring Pressure Distribution and Estimating Drag Coefficients
Aeronautical Engineering
16.1K Görüntüleme Sayısı

Nozzle Analysis: Variations in Mach Number and Pressure Along a Converging and a Converging-diverging Nozzle
Aeronautical Engineering
37.8K Görüntüleme Sayısı

Schlieren Imaging: A Technique to Visualize Supersonic Flow Features
Aeronautical Engineering
11.4K Görüntüleme Sayısı

Surface Dye Flow Visualization: A Qualitative Method to Observe Streakline Patterns in Supersonic Flow
Aeronautical Engineering
4.9K Görüntüleme Sayısı

Pitot-static Tube: A Device to Measure Air Flow Speed
Aeronautical Engineering
48.7K Görüntüleme Sayısı

Constant Temperature Anemometry: A Tool to Study Turbulent Boundary Layer Flow
Aeronautical Engineering
7.2K Görüntüleme Sayısı

Pressure Transducer: Calibration Using a Pitot-static Tube
Aeronautical Engineering
8.5K Görüntüleme Sayısı

Real-time Flight Control: Embedded Sensor Calibration and Data Acquisition
Aeronautical Engineering
10.1K Görüntüleme Sayısı

Multicopter Aerodynamics: Characterizing Thrust on a Hexacopter
Aeronautical Engineering
9.1K Görüntüleme Sayısı
JoVE Hakkında
Telif Hakkı © 2020 MyJove Corporation. Tüm hakları saklıdır