Airfoil Behavior: Pressure Distribution over a Clark Y-14 Wing
Обзор
Source: David Guo, College of Engineering, Technology, and Aeronautics (CETA), Southern New Hampshire University (SNHU), Manchester, New Hampshire
An airfoil is a 2-dimensional wing section that represents critical wing performance characteristics. The pressure distribution and lift coefficient are important parameters that characterize the behavior of airfoils. The pressure distribution is directly related to the lift generated by airfoils. A Clark Y-14 airfoil, which is used in this demonstration, has a thickness of 14% and is flat on the lower surface from 30% of chord length to the back.
Here we will demonstrate how the pressure distribution around an airfoil is measured using a wind tunnel. A Clark Y-14 airfoil model with 19 pressure ports is used to collect pressure data, which is used to estimate the lift coefficient.
Принципы
An airfoil develops lift at various angles of attack through lower gage pressures on the upper surface and higher gage pressures on the lower surface with respect to the pressure of the approaching air (free-stream pressure). If the shear forces parallel to the surface of the airfoil are neglected (typically their contributions to lift are small), then the total pressure force is the reason for the lift generated by the airfoil. Figure 1 shows a schematic of the pressure distribution over an airfoil.

Figure 1. Pressure distribution over an airfoil.
The non-dimensional pressure coefficient, Cp, for an arbitrary point on the airfoil is defined as:
 (1)
(1)
where P is the absolute pressure, P∞ is the undisturbed free-stream pressure, Pgage = P − P∞ is the gage pressure, and 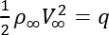 is the dynamic pressure, which is based on the free-stream density, ρ∞, and airspeed, V∞.
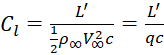
The non-dimensional lift coefficient Cl is similarly defined:
 (2)
(2)
where L' is the lift per unit span, and c is the chord length of the airfoil.
Except for points along the leading-edge, the pressure forces uniformly point upward, in approximately the same direction as lift. As such, at small angles of attack, the lift coefficient can be estimated by:
 (3)
(3)
where x is the horizontal coordinate position with origin starting from leading edge.
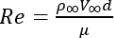
Airfoil performance takes into account the Reynolds number, Re, which is defined as:
 (4)
(4)
where the new parameter μ is the dynamics viscosity of the fluid.
Here, the overall pressure distribution along the airfoil is measured with 19 small tubes embedded in the wing and attached to a pressure transducer. A Clark Y-14 airfoil is shown in Figure 2. It has a thickness of 14% and is flat on the lower surface from 30% of the chord length to the back.

Figure 2. Airfoil profile of a Clark Y-14 wing with locations of gage pressure ports.
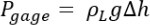
The gage pressures are measured using a manometer panel with 24 columns filled with liquid oil marked with water inch graduations. The gage pressure reading is determined using the following equation:
 (5)
(5)
where Δh is the height difference of the manometer with reference to free-stream pressure, ρL is the density of the liquid in the manometer, and g is the acceleration due to gravity.
Once the pressure distribution is obtained, the non-dimensional lift coefficient, Cl, can be numerically determined to evaluate Equation 3:
 (6)
(6)
where Δxi is the increment between 2 adjacent ports.
Процедура
- Remove top cover of test section to install the Clark Y-14 model (chord length, c = 3.5 in). The test section should be 1 ft x 1 ft and the wind tunnel should be able to sustain a maximum airspeed of 140 mph.
- Mount the aluminum Clark Y-14 model on the turntable inside the test section so that port #1 is facing upstream. Replace top cover. Note that the model is touching both the floor and the ceiling of the wind tunnel test section so no 3D flow around the airfoil develops.
- Connect the 19 pressure tubes labeled 1 - 19 to the corresponding ports of the manometer panel, respectively. The ports on the Clark Y-14 model are located as follows: port 1: x/c = 0 (right on leading edge), ports 2 and 11: x/c = 5%, ports 3 and 12: x/c = 10%, ports 4 and 13: x/c = 20%, ports 5 and 14: x/c = 30% ports 6 and 15: x/c = 40%, ports 7 and 16: x/c = 50%, ports 8 and 17: x/c = 60%, ports 9 and 18: x/c = 70%, and ports 10 and 19: x/c = 80% (Figure 2). The manometer panel should have 24 columns filled with colored oil and marked with water inch graduations.
- Rotate the turntable so that the angle of attack is 0°.
- Run the wind tunnel at 90 mph, and record all 19 pressure measurements by reading the manometer.
- Repeat steps 4 and 5 for angles of attack of 4 and 8°.
Результаты
The results of the lab are shown in Table 1 and Table 2. The data is plotted in Figure 3, which shows the pressure coefficient, Cp, versus the pressure port coordinate, x/c, for angles of attack at 0, 4, and 8°. To be more visually intuitive, the negative Cp values are plotted above the horizontal axis. This is to show that the upper surface (the top line of the chart) is mostly negative pressures and the lower surface (the bottom line of the chart) is mostly positive pressures.
From Figure 3, the pressure significantly changes immediately after the leading edge: the pressure reaches its minimum (or maximum absolute) values at approximately 5% - 15% chord length. As a result, half of the lift is generated in the first quarter of the chord length of the airfoil. Additionally, the upper surface contributes more lift than the lower surface: in all 3 cases, the upper surface contributed to about 70 - 80% of the total lift. Therefore, it is critical to maintain a clean and rigid surface on the top of the wing.
| Pressure port # | Ports coordinates x/c | Pgage from manometer (in. water) | Calculated pressure coefficient Cp |
| 1 | 0.0 | 3.7 | 1.00 |
| 2 | 0.05 | -1.2 | -0.67 |
| 3 | 0.10 | -3.0 | -1.00 |
| 4 | 0.2 | -3.9 | -0.79 |
| 5 | 0.3 | -3.4 | -0.57 |
| 6 | 0.4 | -3.0 | -0.55 |
| 7 | 0.5 | -2.5 | -0.53 |
| 8 | 0.6 | -2.3 | -0.33 |
| 9 | 0.7 | -1.5 | -0.31 |
| 10 | 0.8 | -0.8 | -0.20 |
| 11 | 0.05 | -0.7 | 1.00 |
| 12 | 0.10 | -0.6 | 0.29 |
| 13 | 0.2 | -0.3 | 0.28 |
| 14 | 0.3 | -0.2 | 0.24 |
| 15 | 0.4 | 0.1 | 0.22 |
| 16 | 0.5 | 0.1 | 0.21 |
| 17 | 0.6 | 0.2 | 0.21 |
| 18 | 0.7 | 0.2 | 0.21 |
| 19 | 0.8 | 0.3 | 0.21 |
Table 1. Experimental results at zero angle of attack.
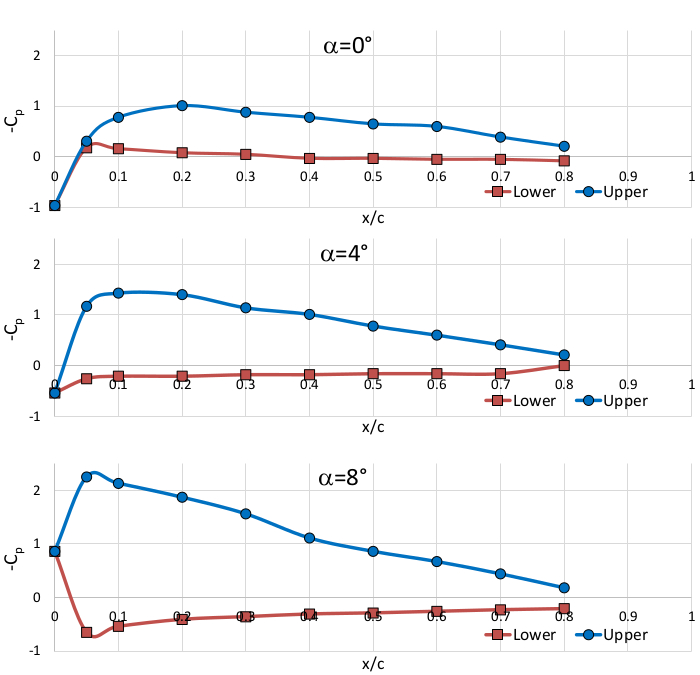
Figure 3. Pressure coefficient distribution, Cp, vs position coordinate, x/c.
| Angle of attack | Lift coefficient cl |
| 0° | 0.53 |
| 4° | 0.89 |
| 8° | 1.29 |
Table 2. Lift coefficient, cl, estimated based on pressure distribution (Re = 2.34 x 10⁵).
| Parameters | Values |
| Air density ρ | 0.00230 slug/ft3 |
| Water density ρL | 1.935 slug/ft3 |
| Gravitational acceleration g | 32.17 ft/s2 |
| Viscosity m | 3.79 x 10⁻⁷ lbf*s/ft2 |
| Free-stream airspeed V∞ | 90 mph |
| Reynolds number Re | 2.34 x 10⁵ |
| Chord length c | 3.5 in |
Table 3. Parameters used for calculations.
Заявка и Краткое содержание
Pressure distributions on airfoils are directly related to lift generation and important information to characterize the performance of airfoils. Airfoil designers manipulate pressure distributions to acquire desired characteristics of airfoils. As such, pressure distribution information is the foundation of aerodynamics analysis during aircraft development.
In this experiment, the pressure distribution of Clark Y-14 was investigated in a wind tunnel and the 19 ports of pressure measurement were made to find the pressure distribution along the upper and lower surface of the airfoil. The lift coefficient is also calculated reasonably from pressure distribution data.
Перейти к...
Видео из этой коллекции:

Now Playing
Airfoil Behavior: Pressure Distribution over a Clark Y-14 Wing
Aeronautical Engineering
21.0K Просмотры

Aerodynamic Performance of a Model Aircraft: The DC-6B
Aeronautical Engineering
8.3K Просмотры

Propeller Characterization: Variations in Pitch, Diameter, and Blade Number on Performance
Aeronautical Engineering
26.2K Просмотры

Clark Y-14 Wing Performance: Deployment of High-lift Devices (Flaps and Slats)
Aeronautical Engineering
13.3K Просмотры

Turbulence Sphere Method: Evaluating Wind Tunnel Flow Quality
Aeronautical Engineering
8.7K Просмотры

Cross Cylindrical Flow: Measuring Pressure Distribution and Estimating Drag Coefficients
Aeronautical Engineering
16.1K Просмотры

Nozzle Analysis: Variations in Mach Number and Pressure Along a Converging and a Converging-diverging Nozzle
Aeronautical Engineering
37.9K Просмотры

Schlieren Imaging: A Technique to Visualize Supersonic Flow Features
Aeronautical Engineering
11.4K Просмотры

Flow Visualization in a Water Tunnel: Observing the Leading-edge Vortex Over a Delta Wing
Aeronautical Engineering
8.0K Просмотры

Surface Dye Flow Visualization: A Qualitative Method to Observe Streakline Patterns in Supersonic Flow
Aeronautical Engineering
4.9K Просмотры

Pitot-static Tube: A Device to Measure Air Flow Speed
Aeronautical Engineering
48.7K Просмотры

Constant Temperature Anemometry: A Tool to Study Turbulent Boundary Layer Flow
Aeronautical Engineering
7.2K Просмотры

Pressure Transducer: Calibration Using a Pitot-static Tube
Aeronautical Engineering
8.5K Просмотры

Real-time Flight Control: Embedded Sensor Calibration and Data Acquisition
Aeronautical Engineering
10.2K Просмотры

Multicopter Aerodynamics: Characterizing Thrust on a Hexacopter
Aeronautical Engineering
9.1K Просмотры
Авторские права © 2025 MyJoVE Corporation. Все права защищены