High-frequency Ultrasound Imaging of the Abdominal Aorta
Обзор
Source: Amelia R. Adelsperger, Evan H. Phillips, and Craig J. Goergen, Weldon School of Biomedical Engineering, Purdue University, West Lafayette, Indiana
High-frequency ultrasound systems are used to acquire high resolution images. Here, the use of a state-of-the-art system will be demonstrated to image the morphology and hemodynamics of small pulsatile arteries and veins found in mice and rats. Ultrasound is a relatively inexpensive, portable, and versatile method for the noninvasive assessment of vessels in humans as well as large and small animals. These are several key advantages that ultraound offers compared to other techniques, such as computed tomography (CT), magnetic resonance imaging (MRI), and near-infrared fluorescence tomography (NIRF). CT requires ionizing radiation and MRI can be prohibitively expensive and even impractical in some scenarios. NIRF, on the other hand, is limited by the penetration depth of light required to excite the fluorescent contrast agents.
Ultrasound has limitations in terms of imaging depth; however, this may be overcome by sacrificing resolution and using a lower frequency transducer. Abdominal gas and excess body weight can severely diminish image quality. In the first case, the propagation of sound waves is limited, while in the latter case, they are attenuated by overlying tissues, such as fat and connective tissue. As a result, no contrast or faint contrast may be observed. Finally, ultrasound is a highly user-dependent technique, requiring the sonographer to be familiar with anatomy and to be able to work around issues, such as the appearance of imaging artifacts or acoustic interference.
Принципы
Ultrasound is a common clinical imaging modality. The fundamental principles of ultrasound involve the propagation of acoustic waves, their interaction with tissue, and the recording of reflected and scattered waves (i.e., echoes). Recently developed high-frequency transducers can emit acoustic waves between approximately 13–70 MHz. For example, a transducer with a frequency range between 22 and 55 MHz has a center frequency of 40 MHz. This range enables a spatial resolution on the order of 50 µm in the direction of the ultrasound beam, making it suitable for imaging structures at the millimeter scale. In order to scan, a transducer first emits a beam of acoustic waves. Some of these waves are reflected back to the transducer when they collide with a boundary between two tissues, which have different acoustical impedances. The transit time for a wave (i.e., the time between emission and detection) is used to determine individual horizontal lines in an image. Scattering of acoustic waves, that is, the deflection of waves in many directions when they interact with structures much smaller than the wavelength, is responsible for most of the ultrasound image information. Some of this acoustic wave scatter is recorded by the transducer, providing the fine details within an ultrasound image. High-frequency acoustic waves have lower depth penetration because of the higher attenuation of sound in tissue. For this reason, high-frequency transducers are only practical for imaging up to a depth of 15-30 mm. In vascular imaging, ultrasound image contrast appears along vessel walls. Red blood cells and platelets also provide speckle contrast within blood. The velocity (v in cm/s) can be measured according to the principle of the Doppler effect:
v = c × ΔF / (2 × Fo × cosθ)
where c = speed of sound in tissue (154 cm/s); ΔF = Doppler shift frequency (1/s); Fo = transmitted frequency (1/s); and θ = angle between the ultrasound beam and the direction of blood flow. Doppler imaging of vessels is used to assess blood flow dynamics in healthy and diseased states.
Процедура
1. Image setup
- Turn the ultrasound system on using the switch on the back. Turn the monitor on.
- Plug in the physiological monitoring unit and turn on heart rate and temperature monitoring. Turn on the gel warmer and ensure the light is on.
- Check the isoflurane level in the anesthetic vaporizer and refill if necessary.
- Turn on your O2 tank or filtered air source and adjust the air flow on the vaporizer to approximately 1 L/min.
- Attach the mouse or rat stage, and then plug the VGA cord into that stage. Secure the corresponding nosecone into place, and check that the isoflurane (black) and waste gas (blue) tubes are properly connected to nosecone.
- Choose a transducer to use for your procedure and plug it into the “active” port below the imaging system. Run the transducer cable through plastic holders above the probe mount and secure the transducer into the clamp. Note there is a small, raised line on one side of each transducer to determine image orientation.
- Anesthetize the animal according to AVMA guidelines and preparing it for imaging. Add ophthalmic ointment to the eyes, secure the paws to the stage electrodes, and remove the hair in the area of interest using a depilatory cream. Cover the area to be imaged with warmed ultrasonic transducing gel.
2. Image Acquisition
- On the system, start a new study by selecting New and Study, or find a study you previously started and select New and Series. Once in a new series, select a user off of the menu and name your series appropriately.
- Once your series has been created, select B-mode (brightness mode) from the keyboard. All imaging modality keys are on the bottom row of the black keyboard.
- Roll the transducer down to the desired location making sure to look at the screen to avoid applying too much pressure to the animal. Check the respiratory rate (RR) that appears on the screen as well, because too much pressure may cause the RR to drop.
- While looking at the B-mode image, adjust the placement of the transducer by gently turning the x- and y-axis knobs found on the stage until you find the desired location.
- Once you have the desired location, wait for the white bar at the bottom of the image to fill before pressing Image Label to save the image. When labelling your image, the type of modality will be indicated next to the image label on the study management screen, so you do not need to worry about including this in the image label.
- For M-mode images, select M-mode (motion mode) from the keyboard. Use SV gate to narrow or widen the yellow bars and the cursor to align the bars over the desired location. Once placed correctly, push M-mode again. The placement of the bars may be adjusted while in M-mode.
- For EKV imaging, select B-mode and ensure you are in the proper location. Then select EKV, adjust the settings, and push Scan. The EKV modality averages many B-mode images over several cardiac cycles.
- To use color doppler, select B-mode, check that you are in the proper location, and then select Color. Select Update and move the cursor up, down, left, or right to achieve the desired box size, and select Update to lock it. You may then use the cursor to move the box to the desired location. Turning the Velocity knob up increases the velocity threshold and may decrease background signal.
- To use pulsed wave doppler for measuring blood flow velocity, it is helpful to first be in color Doppler mode before pressing PW. Two yellow, angled lines will appear. The user must align the shorter, dotted line to be parallel to the anterior and posterior vessel walls by adjusting Beam Angle and turning the PW Angle knob. The dotted, yellow line will turn blue if the angle between the two lines is too large. Once this is aligned, press PW, and then adjust the Baseline, Velocity, and Doppler Gain controls to center and brighten the wave forms.
- To use 3D mode, begin in B-mode and align the probe in the center of the structure you wish to image. Use respiratory gating and EKG-trigger for cardiovascular applications. Press 3D and set the desired scan distance and step size. Once the scan is complete, click Load into 3D to visualize your 3D data.
- You may view your acquired images at any time during imaging by pressing Study Management from the top right of the two columns of buttons on the left side.
- When you are finished acquiring images in a series, select Close Series from the study management screen. You may now open a new series within your study, if needed.
3. Data transfer and clean-up
- To transfer data for analysis, select the studies or individual series you wish to copy from the study management screen.
- Click Copy to from the top right corner on the study management screen. Select your desired file location, and press okay.
- You may now remove the anmial and return it to its housing to recover.
- To clean the ultrasound set-up, spray a paper towel with T-spray and wipe off the heated stage and rectal probe. Never spray the disinfectant directly on the stage.
- The transducer should be wiped off with 70% ethanol on a paper towel before being placed back in the holder.
- To turn off the air, shut off the O2 tank or filtered air source. You should see the air flow bead slowly drop to 0 on the vaporizer.
- Once you are done with the system, click the power button on the study management screen in the top right corner and allow the monitor to turn off completely.
- Turn the power button on the back of system off only after the monitor is completely off. You should hear the fan stop once it has been properly shut down.
Результаты
This procedure allowed the anatomical and functional imaging of the abdominal aorta. Acquiring real-time images in short-axis and long-axis by B-mode, M-mode, and Doppler ultrasound takes at least thirty minutes and therefore requires careful monitoring of the anesthetized animal. Some data are readily analyzed on-the-fly, such as two-dimensional B-mode scans (Fig. 1). These data can provide aortic diameter or cross-sectional area measurements. Other data, such as three-dimensional B-mode (Fig. 2), M-mode (Fig. 3), Color Doppler (Fig. 4), and PW Doppler images (Fig. 5), are usually analyzed offline to determine aortic volume, circumferential cyclic strain, and blood flow velocity. Together these datasets provide quantitative and qualitative information on the three-dimensional morphology as well as the hemodynamics and pulsatility of the abdominal aorta.

Figure 1: Dissecting aortic aneurysm in a mouse. The celiac artery and superior mesenteric artery can be seen branching off of the top of the vessel. The mouse’s ECG signal (green line) and respiration signal (yellow line) are shown below the image.
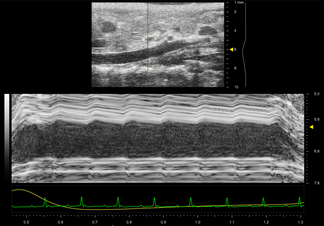
Figure 2: Motion mode (M-mode) trace of the suprarenal aorta in a healthy mouse. A B-mode scout image is shown above the one-dimensional M-mode data, which is acquired in the anteroposterior direction. The M-mode data shows pulsatile motion, particularly in the anterior wall. This suggests that measurements of vessel strain will be normal.
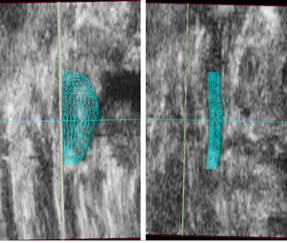
Figure 3: Volume renderings (cyan mesh) of a mouse suprarenal aorta with (left) and without (right) a dissecting abdominal aortic aneurysm. Ultrasound data from a coronal plane is shown and the head of the animal is towards the top of the screen. The aneurysm has expanded leftward and the volume and maximal aortic diameter are notably larger than before expansion.
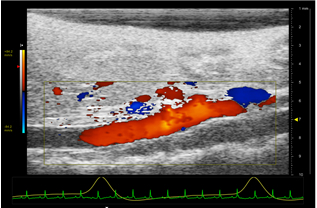
Figure 4: Color Doppler image of a healthy suprarenal aorta. The head of the mouse is to the left, the tail is to the right, and the animal is positioned supine. The mouse's EKG (green) and respiratory (yellow) signals are shown below the image. The scale on the left quantifies the velocity of blood flow by color. Red flow is towards the transducer while blue flow is away from the transducer. The scale on the right represents the depth in mm.
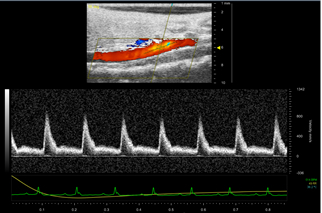
Figure 5: Pulsed Wave (PW) image of a healthy suprarenal aorta. The yellow cursor is placed parallel to the vessel walls in the center of the aorta. Color doppler mode helps the user decide where they will pick up a strong signal. The velocity wave forms are shown below the image. The scale on the right of the peaks is the blood flow velocity in mm/s. The sharp peaks represent arterial flow.
Заявка и Краткое содержание
Recently developed high-frequency ultrasound transducers are well suited for visualizing small structures to a depth of up to 3 cm. Here the versatility of a small animal ultrasound system was demonstrated to acquire in vivo imaging data of the dynamics of the mouse aorta. This technique requires practice and recognition of common difficulties, such as abdominal shadows and Doppler scan alignment. Despite these limitations, it is a powerful and versatile technique for quickly obtaining non-invasive imaging data. Importantly, this technique lends itself well to serial imaging of the same animal for longitudinal studies of disease progression or treatment.
Small animal high frequency ultrasound can be used in a variety of cardiovascular applications. Vascular applications include screening for aortic disease (such as aortic aneurysms and dissections), detecting atherosclerotic plaque, and measuring blood flow in patients with peripheral arterial disease. Carotid arteries, iliac arteries, and the inferior vena cava, can be easily imaged with ultrasound. Cardiac imaging is also a major application of this technique and is used to be able to visualize the atria and ventricles of mice or rat hearts. Cardiac ultrasound imaging can give the user a lot of information about the heart including anatomical dimensions, contractility, stiffness, cardiac output, flow patterns, valve function, and/or thrombus formation, to name a few. Ultrasound may also be used for reproductive system imaging (such as the uterus and cervix) or on the bladder. Reproductive system imaging would be useful to look at the structures of and obtain dimensions for the uterus, cervix, and/or vagina. Pups could also be visualized and measured in a pregnant mouse or rat. Due to the advances in transducer technology and innovations in ultrasound technology, these applications work well in small animals and may also have applicability to superficial human imaging.
Теги
Перейти к...
Видео из этой коллекции:

Now Playing
High-frequency Ultrasound Imaging of the Abdominal Aorta
Biomedical Engineering
14.4K Просмотры

Imaging Biological Samples with Optical and Confocal Microscopy
Biomedical Engineering
35.7K Просмотры

SEM Imaging of Biological Samples
Biomedical Engineering
23.5K Просмотры

Biodistribution of Nano-drug Carriers: Applications of SEM
Biomedical Engineering
9.3K Просмотры

Quantitative Strain Mapping of an Abdominal Aortic Aneurysm
Biomedical Engineering
4.6K Просмотры

Photoacoustic Tomography to Image Blood and Lipids in the Infrarenal Aorta
Biomedical Engineering
5.7K Просмотры

Cardiac Magnetic Resonance Imaging
Biomedical Engineering
14.7K Просмотры

Computational Fluid Dynamics Simulations of Blood Flow in a Cerebral Aneurysm
Biomedical Engineering
11.7K Просмотры

Near-infrared Fluorescence Imaging of Abdominal Aortic Aneurysms
Biomedical Engineering
8.2K Просмотры

Noninvasive Blood Pressure Measurement Techniques
Biomedical Engineering
11.9K Просмотры

Acquisition and Analysis of an ECG (electrocardiography) Signal
Biomedical Engineering
104.9K Просмотры

Tensile Strength of Resorbable Biomaterials
Biomedical Engineering
7.5K Просмотры

Micro-CT Imaging of a Mouse Spinal Cord
Biomedical Engineering
8.0K Просмотры

Visualization of Knee Joint Degeneration after Non-invasive ACL Injury in Rats
Biomedical Engineering
8.2K Просмотры

Combined SPECT and CT Imaging to Visualize Cardiac Functionality
Biomedical Engineering
11.0K Просмотры
Авторские права © 2025 MyJoVE Corporation. Все права защищены