Visual Attention: fMRI Investigation of Object-based Attentional Control
Przegląd
Source: Laboratories of Jonas T. Kaplan and Sarah I. Gimbel— University of Southern California
The human visual system is incredibly sophisticated and capable of processing large amounts of information very quickly. However, the brain's capacity to process information is not an unlimited resource. Attention, the ability to selectively process information that is relevant to current goals and to ignore information that is not, is therefore an essential part of visual perception. Some aspects of attention are automatic, while others are subject to voluntary, conscious control. In this experiment we explore the mechanisms of voluntary, or "top-down" attentional control on visual processing.
This experiment leverages the orderly organization of visual cortex to examine how top-down attention can selectively modulate the processing of visual stimuli. Certain regions of the visual cortex appear to be specialized for processing specific visual items. Specifically, work by Kanwisher et al.1 has identified an area in the fusiform gyrus of the inferior temporal lobe that is significantly more active when subjects view faces compared to when they observe other common objects. This area has come to be known as the Fusiform Face Area (FFA). Another brain region, known as the Parahippocampal Place Area (PPA), responds strongly to houses and places, but not to faces.2 Given that we know how these regions respond to specific types of stimuli, their activity can be further explored to identify a key component of vision-visual attention.
This video shows how to use fMRI to localize the FFA and PPA in the brain, and then examines how object-based attentional control modulates activity in these areas. The use of a functional localizer to restrict subsequent hypothesis testing is a powerful technique in functional imaging. Participants will undergo functional MRI while being presented with an overlaid image of a face and a house. Even though both a face and a house are presented in each stimulus, we predict that patterns of activity in their FFA and PPA will change based on which item is being attended to.3
Procedura
1. Participant recruitment
- Recruit 20 participants.
- Participants should be right-handed and have no history of neurological or psychological disorders.
- Participants should have normal or corrected-to-normal vision to ensure that they will be able to see the visual cues properly.
- Participants should not have metal in their body. This is an important safety requirement due to the high magnetic field involved in fMRI.
- Participants should not suffer from claustrophobia, since the fMRI requires lying in the small space of the scanner bore.
2. Pre-scan procedures
- Fill out pre-scan paperwork.
- When participants come in for their fMRI scan, instruct them to first fill out a metal screen form to make sure they have no counter-indications for MRI, an incidental-findings form giving consent for their scan to be looked at by a radiologist, and a consent form detailing the risks and benefits of the study.
- Prepare participants to go in the scanner by removing all metal from their body, including belts, wallets, phones, hair clips, coins, and all jewelry.
3. Provide instructions for the participant.
- Tell the participant that in the scanner, they will see images of faces and houses.
- For the initial localizer runs, instruct participants that they will passively view faces and houses.
- Explain to the participants that in the task runs, they will see a face and a house superimposed on each other. Their task will be to pay attention to either the house or the face, as follows.
- When the task first begins, they will be told via text instructions whether to pay attention to houses or faces.
- Participants will have four runs where they are instructed to pay attention to houses, and four runs where they are instructed to pay attention to faces.
- The schedule of face and house runs will be random for each subject.
- Stress to the participant the importance of keeping their head still throughout the scan.
4. Put the participant in the scanner.
- Give the participant ear plugs to protect their ears from the noise of the scanner and ear phones to wear so they can hear the experimenter during the scan, and have them lie down on the bed with their head in the coil.
- Give the participant the emergency squeeze ball and instruct them to squeeze it in case of emergency during the scan.
- Use foam pads to secure the participants head in the coil to avoid excess movement during the scan, and remind the participant that it is very important to stay as still as possible during the scan, as even the smallest movements blur the images.
5. Data collection
- Collect a high-resolution anatomical scan.
- Begin functional scanning.
- Synchronize the start of stimulus presentation with the start of the scanner.
- Present pictures via a laptop connected to a projector. The participant has a mirror above their eyes, reflecting a screen at the back of the scanner bore.
- Present each participant with two localizer runs, in which they passively see blocks of faces and houses. These localizer runs are used to identify the FFA and PPA in each individual participant.
- Present each set of faces and houses in a 30-s block, with 20 s of fixation between blocks. Show each stimulus for 750 ms, followed by a 250-ms inter-stimulus interval, in which only a fixation cross is present on the screen. Repeat blocks in alternating order to obtain five blocks of faces and five blocks of houses.
- Present each participant with eight functional runs of the attention task.
- Begin each run with a superimposed face and house (Figure 1) in the center of the screen, and an instruction to begin by attending to either the face or the house. The initial attention target will be random from run to run.
- Each run will contain 300 pairs of superimposed faces and houses. Pairs of faces and houses are repeated between runs, but not within runs.
- Show each superimposed stimulus pair for one second. Every second, replace the superimposed house and face with a new superimposed house and face.

Figure 1. Face stimulus and house stimulus superimposed together. Each stimulus presented was a superimposed face and house. The participant was instructed to focus on either the face or the house.
6. Post-scan procedures
- Bring the participant out of the scanner.
- Debrief the participant.
7. Data analysis
- Preprocess the data.
- Perform motion correction to reduce motion artifacts.
- Perform temporal filtering to remove signal drifts.
- Smooth the data to increase signal-to-noise ratio.
- Model the data for each participant.
- Create a model of what the expected hemodynamic response should be for each task condition (faces and houses) in the localizer scan.
- Fit the data to this model, resulting in a statistical map, where the value at each voxel represents the extent to which that voxel was involved in the task condition.
- Identify the clusters for each subject that correspond to FFA and PPA based on their anatomical locations. The FFA will include all contiguous voxels in the mid-fusiform gyrus (which responds significantly more to faces than to houses) and the PPA included all voxels in the parahippocampal gyrus that responded more significantly to houses than to faces. To establish these regions of interest, a minimum significance threshold of p < 10-6 was used for each voxel.
- Use each individual's FFA and PPA masks as an ROI to extract signal activations during the four focus-on-faces runs and the four focus-on-houses runs.
- Quantify percent signal change for face-focus and house-focus conditions in FFA and PPA for each subject.
- Create a model of what the expected hemodynamic response should be for each task condition (faces and houses) in the localizer scan.
- Perform a two-way analysis of variance (ANOVA) on percent signal change values to test for differences among the conditions. The factors in this test are ROI (PPA vs. FFA) and attention (faces vs. houses).
Wyniki
In the localizer scans, bilateral FFA were more active when subjects were viewing faces than when they were viewing houses. Conversely, the PPA was more active when subjects were viewing houses than when they were viewing faces (Figure 2). These regions, localized via the block-design scans, were later used as regions of interest to extract signal related to shifting attention to faces and to houses during the functional runs.
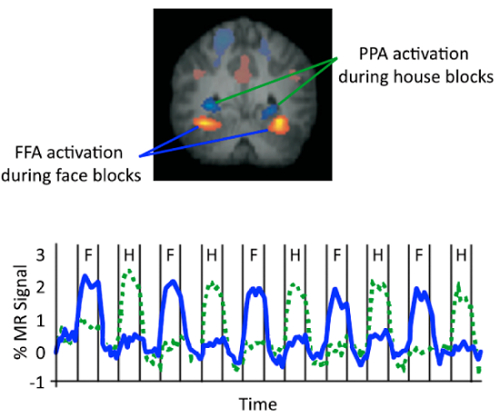
Figure 2. Localizer for the Fusiform Face Area (FFA) and the Parahippocampal Place Area (PPA). Example of a single subject localization of the FFA during blocks of viewing faces and the PPA during blocks of viewing houses (top). Signal in the FFA was increased during blocks of faces but not houses (blue), and signal in the PPA was increased during blocks of houses but not faces (green).
During functional runs, where participants simultaneously saw a face and a house in their direct visual field, activity in the FFA and PPA was modulated based on which item was being attended. When attention was on the face, there was increased activity in the FFA, but not the PPA. Conversely, when attention was on the house, there was increased activity in the PPA but not the FFA (Figure 3).
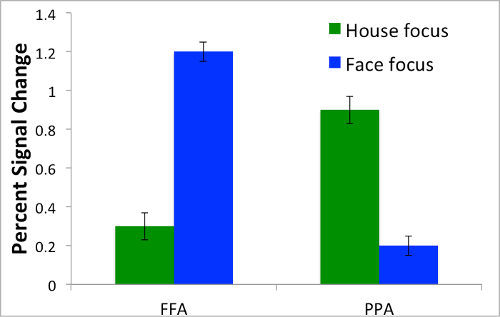
Figure 3. Activation in the Fusiform Face Area (FFA) and the Parahippocampal Place Area (PPA) during attention-switching task. When attention was on the house (green), PPA showed increased activation while FFA did not. Reversely, when focus was on the face (blue), FFA showed increased activation while PPA did not.
Wniosek i Podsumowanie
The use of localizer scans is a powerful tool for cognitive neuroimaging and has some distinct advantages over whole-brain imaging. By focusing a hypothesis on a small number of specific locations that have known response properties, we can generate very specific predictions with high statistical power. Whole-brain voxel-wise neuroimaging studies must control for the tens of thousands of statistical tests performed at every location in the brain, a process that reduces statistical power. Also, defining these regions based on their functional properties in each individual minimizes the problems posed by individual differences in neuroanatomy.
In this example, we built upon the specialized stimulus-specific responses in sub-regions of visual cortex to understand how a more general cognitive process, top-down attention, could influence perceptual processes. Even though the stimulus on the retina was the same for each item presentation, cortical activity varied based on which stimulus was being attended. This demonstrates that top-down attention has the potential to reach down into low-level sensory cortex to modulate how information is processed. A more complete understanding of how attention modulates activation in the brain could lead to advances in treatments and interventions for attention-related disorders.
Odniesienia
- Kanwisher N.G, McDermott J, Chun M.M. (1997). The fusiform face area: a module in human extrastriate cortex specialized for face perception. J. Neurosci., 17, 4302-4311.
- Epstein, R., & Kanwisher, N. (1998). A cortical representation of the local visual environment. Nature, 392, 598-601.
- Serences, J. T., Schwarzbach, J., Courtney, S. M., Golay, X., & Yantis, S. (2004). Control of Object-based Attention in Human Cortex. Cerebral Cortex, 14, 1346-1357.
Tagi
Przejdź do...
Filmy z tej kolekcji:

Now Playing
Visual Attention: fMRI Investigation of Object-based Attentional Control
Neuropsychology
41.5K Wyświetleń

The Split Brain
Neuropsychology
68.2K Wyświetleń

Motor Maps
Neuropsychology
27.4K Wyświetleń

Perspectives on Neuropsychology
Neuropsychology
12.0K Wyświetleń

Decision-making and the Iowa Gambling Task
Neuropsychology
32.3K Wyświetleń

Executive Function in Autism Spectrum Disorder
Neuropsychology
17.6K Wyświetleń

Anterograde Amnesia
Neuropsychology
30.3K Wyświetleń

Physiological Correlates of Emotion Recognition
Neuropsychology
16.2K Wyświetleń

Event-related Potentials and the Oddball Task
Neuropsychology
27.4K Wyświetleń

Language: The N400 in Semantic Incongruity
Neuropsychology
19.5K Wyświetleń

Learning and Memory: The Remember-Know Task
Neuropsychology
17.1K Wyświetleń

Measuring Grey Matter Differences with Voxel-based Morphometry: The Musical Brain
Neuropsychology
17.3K Wyświetleń

Decoding Auditory Imagery with Multivoxel Pattern Analysis
Neuropsychology
6.4K Wyświetleń

Using Diffusion Tensor Imaging in Traumatic Brain Injury
Neuropsychology
16.7K Wyświetleń

Using TMS to Measure Motor Excitability During Action Observation
Neuropsychology
10.1K Wyświetleń
Copyright © 2025 MyJoVE Corporation. Wszelkie prawa zastrzeżone