Nutrients in Aquatic Ecosystems
Przegląd
Source: Laboratories of Margaret Workman and Kimberly Frye - Depaul University
Nitrogen and phosphorus are essential plant nutrients found in aquatic ecosystems and both are monitored as a part of water quality testing because in excess amounts they can cause significant water quality problems.
Nitrogen in water is measured as the common form nitrate (NO3-) that is dissolved in water and readily absorbed by photosynthesizers such as algae. The common form of phosphorus measured is phosphate (PO43-), which is strongly attracted to sediment particles as well as dissolved in water. In excess amounts, both nutrients can cause an increase in aquatic plant growth (algal bloom, Figure 1) that can disrupt the light, temperature, and oxygen levels in the water below and lead to eutrophication and hypoxia (low dissolved oxygen in water) forming a “dead zone” of no biological activity. Sources of nitrates and phosphorus include wastewater treatment plants, runoff from fertilized lawns and agricultural lands, faulty septic systems, animal manure runoff, and industrial waste discharge.
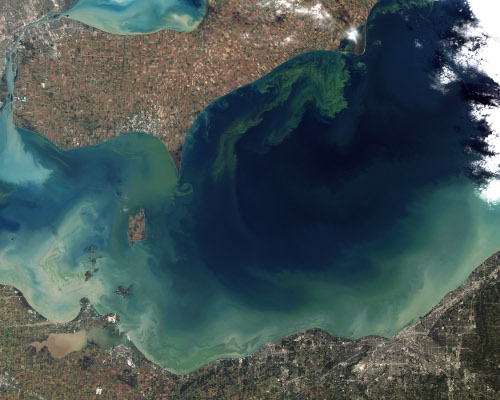
Figure 1. Algal bloom
Taken in 2011, the green scum shown in this image was the worst algae bloom Lake Erie has experienced in decades. Record torrential spring rains washed fertilizer into the lake, promoting the growth of microcystin producing cyanobacteria blooms. Vibrant green filaments extend out from the northern shore.
Zasady
Nitrate and phosphate concentrations can be measured in water samples using known chemical reagents that cause the sample to change color when in the presence of a specific nutrient, with increasing color intensity indicating an increased concentration of the nutrient. To ensure release of any phosphate molecules that are bonded to sediments in the water, phosphorus samples are digested chemically and with heat to release phosphate bonds for a measure of total phosphate in the sample.
To quantify the color intensity produced by the reagent, a spectrophotometer is used to measure the specific wavelength of light that corresponds with each color caused by the nutrients and their reagents (nitrates amber; phosphates blue). The spectrophotometer then sends a beam of light through each sample to measure the amount of that light that is absorbed by the color (absorbance). The darker the color, the higher the absorbance. The spectrophotometer then converts the absorbance to a displayed nutrient concentration (mg/L) based on known concentration assays.
Procedura
1. Measure Nitrogen in Sample
- On the spectrophotometer, find the program for nitrate (with user manual or instrument menu) and enter the program number.
- Pipette 10 mL of the water sample into one of the sample tubes. Pour this into one of the sample tubes.
- Repeat for a second sample tube.
- Add the contents of one nitrate reagent powder pillow to one sample tube.
- Cap both sample tubes.
- On the spectrophotometer, press timer and enter to start a reaction period for the reagent. Shake the sample vigorously until the reaction time is over and timer beeps. Sample will begin to turn amber.
- Press enter. A second 5-min reaction period will begin.
- After the timer beeps the second time, wipe off the outside of the two sample tubes with a lint-free paper towel.
- Place the sample tube without reagent (blank) tube into the spectrophotometer.
- Tightly cover the cell with the instrument cap to ensure ambient light is blocked.
- Zero the spectrophotometer for a reading of 0.0 mg/L NO3-N.
- Remove the blank cell and place the sample cell with reagent into the cell holder. Tightly cover the sample cell with the instrument cap.
- Press READ. The cursor will move to the right, then the results in mg/L NO3-N will be displayed.
2. Measure Phosphorus in Sample
- Measure out 5.0 mL of the water sample using a pipette.
- Pour measured water into a sample tube.
- Add the contents of one potassium persulfate powder pillow for phosphonate to the sample tube.
- Cap the tube tightly and shake to dissolve.
- Label the top of the tube cap and place the tube in a COD reactor (in a chemical hood) and heat for 30 min.
- Place it in a test tube rack and allow to cool to room temperature.
- Using a graduated cylinder, measure out 2 mL of 1.54 N sodium hydroxide.
- Pour this into the sample tube. Cap and mix.
- On the spectrophotometer, find the program number for phosphate (with user manual or instrument menu) and enter the program number.
- Clean the outside of the sample tube with a lint-free paper towel.
- Place the test tube so that it is facing the front of the instrument.
- Place the cover on the test tube.
- Take out test tube and add the contents of the purchased reagent powder pillow for the ascorbic acid method.
- Cap tightly and shake for 10-15 s.
- Press timer and then enter. A 2-min waiting period will begin.
- After the timer beeps, clean the outside of the test tube with a lint-free paper towel.
- Place the test tube into the instrument with the logo facing the front of the instrument.
- Place the cover over the test tube.
- Press read. The display will show the results in mg/L.
Wyniki

Figure 2. Graph comparing nitrates between different land use types (undeveloped, agricultural, and urban).
Average nitrate concentrations compared upstream and downstream from a water treatment plant (Figure 3). The downstream measurement represents the discharge from the treatment.
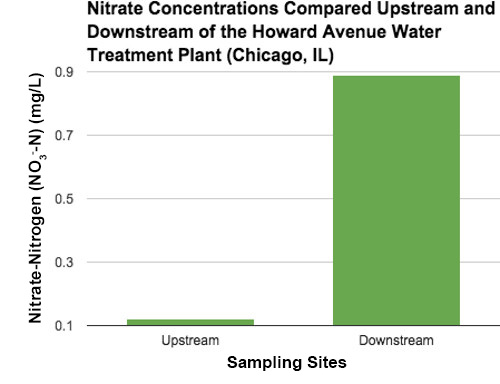
Figure 3. Average nitrate concentrations compared upstream and downstream from a water treatment plant. The downstream measurement represents the discharge from the treatment.
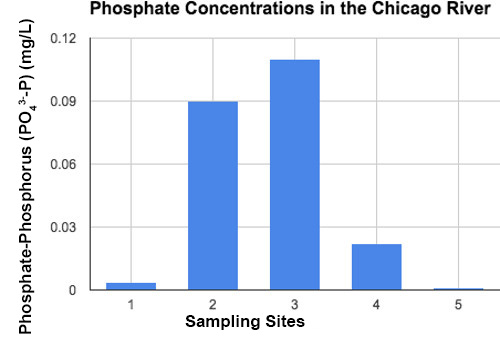
Figure 4. Graph of phosphorus for different locations along the Chicago River.
Average phosphate concentrations compared upstream and downstream from a water treatment plant (Figure 5). The downstream measurement represent the discharge from the treatment.

Figure 5. Average phosphate concentrations compared upstream and downstream from a water treatment plant. The downstream measurement represent the discharge from the treatment.
Wniosek i Podsumowanie
High concentrations of nitrates and phosphorus can stimulate eutrophic conditions in water by causing algal bloom that negatively affects other water quality factors including dissolved oxygen, temperature, and other indicators. Excess nitrates can lead to hypoxic water (low levels of dissolved oxygen) no longer able to support aerobic life creating a “dead zone,” where non-mobile species mass die-offs and mobile species move away to other waters. Dead zones are occurring globally in coastal regions where large amounts of high-nutrient runoff and wastewater converge, and aquatic life is most highly concentrated (Figure 6). Two of the largest dead zones are in the Baltic Sea where on average 49,000 km2 of water contained less than 2 mg/L of dissolved oxygen, and the northern Gulf of Mexico with a dead zone measured at 17,353 km2.
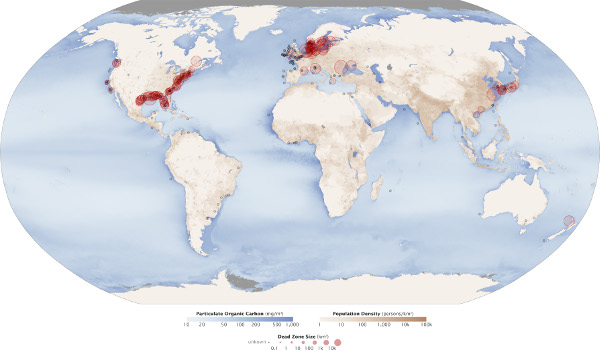
Figure 6. Marine dead zones world-wide
Red circles show the location and size of many dead zones. Black dots show dead zones of unknown size. Darker blues in this image show higher concentrations of particulate organic matter, an indication of the overly fertile waters that can culminate in dead zones. The size and number of marine dead zones — areas where the deep water is so low in dissolved oxygen that sea creatures can’t survive — have grown explosively in the past half-century. It’s no coincidence that dead zones occur downriver of places where human population density is high (darkest brown).
Tagi
Przejdź do...
Filmy z tej kolekcji:

Now Playing
Nutrients in Aquatic Ecosystems
Environmental Science
38.9K Wyświetleń

Tree Identification: How To Use a Dichotomous Key
Environmental Science
81.2K Wyświetleń

Tree Survey: Point-Centered Quarter Sampling Method
Environmental Science
49.4K Wyświetleń

Using GIS to Investigate Urban Forestry
Environmental Science
12.6K Wyświetleń

Proton Exchange Membrane Fuel Cells
Environmental Science
22.1K Wyświetleń

Biofuels: Producing Ethanol from Cellulosic Material
Environmental Science
53.2K Wyświetleń

Testing For Genetically Modified Foods
Environmental Science
89.7K Wyświetleń

Turbidity and Total Solids in Surface Water
Environmental Science
35.8K Wyświetleń

Dissolved Oxygen in Surface Water
Environmental Science
55.7K Wyświetleń

Measuring Tropospheric Ozone
Environmental Science
26.4K Wyświetleń

Determination Of NOx in Automobile Exhaust Using UV-VIS Spectroscopy
Environmental Science
30.1K Wyświetleń

Lead Analysis of Soil Using Atomic Absorption Spectroscopy
Environmental Science
125.4K Wyświetleń

Carbon and Nitrogen Analysis of Environmental Samples
Environmental Science
29.4K Wyświetleń

Soil Nutrient Analysis: Nitrogen, Phosphorus, and Potassium
Environmental Science
215.8K Wyświetleń

Analysis of Earthworm Populations in Soil
Environmental Science
16.5K Wyświetleń
Copyright © 2025 MyJoVE Corporation. Wszelkie prawa zastrzeżone