The Effect of Reflux Ratio on Tray Distillation Efficiency
Overzicht
Source: Kerry M. Dooley and Michael G. Benton, Department of Chemical Engineering, Louisiana State University, Baton Rouge, LA
Tray and packed columns are both commonly used for distillation, absorption, and stripping separation operations.1,2 The goal of this experiment is to distill a mixture of alcohols (methanol, isopropanol) and water in a sieve tray column and examine how closely simple theories of distillation based on equilibrium assumptions are followed. Sieve trays provide maximum interfacial area between the liquid and vapor. A P&ID schematic of the sieve tray (each tray contains holes in a support plate) distillation system can be found in Appendix A.
In this demonstration, the Tray Distillation Unit (TDU) is started in total reflux mode. After a steady reflux drum level is attained, a switch to finite reflux mode is made by adjusting the bottoms, distillate and reflux flow rate controllers as necessary to maintain steady levels in the reflux drum and the reboiler, and to maintain a target reflux ratio RD = L/D. Once steady state is achieved (takes at least 90 min), liquid samples will be taken from the reflux drum, reboiler and on each tray and analyzed in a gas chromatograph. A typical protocol is to investigate the effects of reflux ratio over a wide range. From the sample analyses, the tray efficiencies can be determined for all three components on all six trays assuming constant molar overflow (McCabe-Thiele method). The results can also be simulated using an equilibrium process simulator, if available. These two methods can also be used to determine the overall tray efficiency. Additionally, data reconciliation of the mass balances can be performed to determine if gross measurement errors exist. Any Separations or Unit Operations textbook covers the fundamentals of distillation including basic concepts such as reflux ratio, Murphree efficiencies and the McCabe-Thiele method and diagram.2
Principes
All distillation processes depend upon composition differences between vapor and liquid phases in contact that are exchanging mass. In a distillation column, density differences cause vapor to flow upward to the stage above, and gravity causes the liquid to flow downward to the tray below. In order to make the partial vaporization in each tray into a practical separation process, the liquid and vapor must flow countercurrently through several stages. There must also be sufficient interfacial area on any given stage. Packed distillation columns use specialized packing material with small channels to increase liquid-vapor contact in smaller quarters.1,2 These distillation columns are often used to recover solvents and corrosive fluids because packing can more easily be manufactured with resistant materials.1 One major difference between packed distillation columns and tray distillation columns is that packed columns are usually more cost-efficient in columns of smaller diameter (say, <0.6 m), whereas tray columns are usually more cost-effective at larger diameters.1 Packed columns can operate under low pressure, but cannot handle as high of liquid flow rates as tray columns.1,2 However, both types can flood (fill with liquid and have a significant increase in the pressure drop) at high enough gas or liquid flow rates.1,2 Many specialized types of distillation exist, including vacuum, extractive, reactive, and cryogenic distillation.1,2
The Scott distillation column consists of six sieve trays, each of which includes two semi-cylindrical conduits (downcomers) for liquid to flow from the tray above and to the tray below. The Scott distillation column wall is made of glass; hence the liquid flow in the column can be observed with naked eye. A diagram of the unit is provided in Appendix A.
The lighter (more volatile) components (e.g., methanol) eventually concentrate in the vapor, whereas the heavier components eventually concentrate in the liquid. Some of the condensed vapor must be returned to the column as reflux to obtain any separation beyond that given by a single equilibrium stage. The rest of the condensed vapor is collected as distillate. This is called partial reflux. At the bottom of the column, some of the liquid from the bottom tray (#6) is vaporized in a reboiler to generate vapor (the boilup) for the bottom tray. The reflux ratio is the ratio of reflux to distillate molar flows:
 (1)
(1)
where RD is the reflux ratio, L is the reflux rate, and D is the distillate rate for both molar flows. When operating at total reflux (RD → ∞), the separation of the components is at a maximum, but no product is collected. All practical distillations must be operated at a finite reflux ratio, which is often near 1.2 times the minimum RD, to attain an economic optimum. The minimum RD can barely achieve the specified separation, and would require an infinite number of trays.
The Murphree liquid-phase tray efficiency is defined as the change in the liquid composition over a tray divided by the change that would have occurred if the exiting liquid were in equilibrium with the exiting vapor. The Murphree efficiency for a single tray is given by:
 (2)
(2)
where EML is the Murphree efficiency, Xn-1 is the liquid composition entering tray n, Xn is the liquid composition leaving tray n, and Xn* is the liquid composition in equilibrium with the vapor leaving tray n. The vapor composition Y must be found from the solution to the component mass balance (the operating line), and Xn* is found from Y assuming equilibrium. Murphree efficiencies often behave qualitatively similar to mass transfer rates, i.e., low efficiencies would often be associated with either low interfacial areas or low superficial velocities. However, an exception to this rule of thumb is that very high flow rates can also cause low efficiencies due to entrainment of liquid by the vapor as droplets in the upper part of a tray. Therefore, engineers utilize the Murphree efficiencies to pinpoint problems in distillation columns and to improve the internal design to better approach 100% efficiency on all trays.
Procedure
The TDU is operated from a computer interface of a distributed control system. The interface is entirely graphical. The column contains 6 trays, a total condenser, and a partial reboiler (Appendix A). The mixture is contained in the feed reservoir, and the feed nominally consists of methanol (~50 wt.%), isopropanol (~30 wt.%), and water (~20 wt.%).
1. Starting Total Reflux Mode
- Turn on the cooling water. If the reboiler liquid level is too low, add feed to it; if too high, use the bottoms pump to return liquid to the feed tank.
- Turn on the main reboiler heater from the interface and the strip heaters using the switch on the unit at top right. Put the reboiler temperature controller in manual (MAN), give it an output (OP) of at least 60%, then wait for the overhead vapor to condense and the reflux drum to start filling, as seen on the interface. The reflux preheater power will start up with the reboiler heater.
- When the reflux drum level reaches 50%, put the reflux flow controller in AUTO, give it a setpoint (SP) of 20%, and turn on the reflux pump.
- As soon as you measure a reflux flow on the controller, gradually decrease the setpoint in steps of a percent every few seconds until the reflux flow rate is 12 - 13% of span (span = the total range of the transmitter).
- Put the reflux preheat controller in AUTO, and give it a setpoint of ~65 °C, or some other suitable value near the temperature of the top tray.
- Wait for the reflux drum level to reach at least 50% before manually adjusting the reflux rate by changing the setpoint on the reflux flow controller as necessary to provide a constant reflux drum level of 25 - 75%.
- When all flows, levels, temperatures and compositions are close to their setpoints and aren't changing significantly over 2 min, steady state has been achieved.
2. Transitioning to Finite Reflux Mode
- Put the feed flow controller to AUTO, and give it a setpoint corresponding to ~120 cm3/min.
- Turn on the feed pump and feed preheater. Put the feed preheat controller in AUTO and give it a setpoint of ~65 °C or other temperature near that of the feed tray temperature.
- Put the reflux flow rate controller in AUTO and give it a setpoint of ~80 % of the total reflux case as a starting point.
- Start withdrawing distillate product (adjust flow controller to >0 flow) to maintain a level of 25 - 75% in the reflux drum. Put the distillate flow controller in AUTO and adjust its setpoint unless other instructions specifically call for MANUAL control. Try 3 different reflux ratios around 1 (e.g., 0.8, 1.2, 1.6), but hold the boilup rate constant by keeping the heat duty constant at a value that gives distillate flow.
- Start withdrawing bottoms product (adjust flow controller to >0 flow) to maintain a constant level of 60-80 % in the reboiler. Put the bottoms flow controller in AUTO, turn on the bottoms pump, and adjust its setpoint, unless other instructions specifically call for MANUAL control. Both products should flow back to the feed reservoir.
- When all flows, levels, temperatures and compositions are close to their setpoints, steady state has been achieved. The flow controllers may need to be adjusted; recall, F = B + D (feed = bottoms + distillate on a molar basis, and the distillate will be mostly methanol).
- Collect a few mL volume samples of the feed, bottoms and distillate at the same time (see Figure 3, Appendix A). To collect the feed, insert a pipette through the top port of the feed tank. Only one set of samples per steady state is needed. It is also possible to sample liquid from each tray through its septum port using curved needle syringes Do this as only one of the steady states.
3. Setting Up the Gas Chromatograph
The gas ghromatograph (GC) is operated through the vendor's software. The column is Porapak Q, 1/8" in diameter and 2 ft long.
- Select the Method and Run Control window. On the icon-filled menu bar, select Method and pick the START.M method.
- On the front panel of the GC, press the Front Inlet button. The pressure should be set to 4.5 psi.
- Inject a 0.1 microliter sample (same volume each time) and press the Start button on the GC front panel. The software will show 'Run' in Progress / Data Acquisition, with the elapsed time counting up.
- Results will appear in a report on the software screen after approximately 3 min in the form of a chart containing GC peaks. Scroll down the report to see the Area% results.
4. Shutting down the Distillation column
- Turn off all three heaters, the bottoms pump and the feed pump.
- Put all controllers except the reflux flow rate in MAN and set their outputs (OP) to 0%.
- Put the reflux flow rate controller in MAN and set its OP to 20%.
- Turn on the reflux pump override and leave the reflux pump on until the reflux drum is empty.
- As soon as the reflux drum is empty, take off the reflux pump override, turn off the reflux pump, put the reflux flow rate controller in MAN, and set its OP to 0%.
- Leave the cooling water on until all six tray temperatures are below 60 °C, and then turn it off.
Resultaten
The appropriate response factor (RFi) for each component, which is the ratio of the signal intensity to the quantity of analyte injected and is provided in the software, is used to determine the wt% of each sample.
 (3)
(3)
Reflux ratio (RD = L/D) has a tremendous effect on both column tray efficiencies (at constant feed and distillate rates) and on the composition of the distillate and bottoms. A lower reflux rate greatly reduces the methanol purity of the distillate. Therefore, a tray distillation apparatus operating at a greater reflux rate but constant distillate and bottoms rates will be more efficient for separation. However, additional reflux increases operating costs by adding additional more heating (reboiler) and cooling (condenser) costs.
Murphree liquid efficiencies were calculated at an intermediate RD from the liquid sample compositions for all six trays using equilibrium data to find xn*. For these computations, the constant molar overflow assumption on the vapor and liquid rates in each section was applied. A representative McCabe-Thiele plot of these calculations is shown in Figure 1. A saturated liquid feed (q = 1) was assumed, as the feed was heated to close to its bubble point. The actual feed, distillate and bottoms mole fractions were 0.53, 0.76 and 0.39, respectively. The predicted number of equilibrium stages is ~4. The actual number of trays is 6+1 = 7, so the overall column efficiency is ~57 %. Referring back to Equation (2), a mass balance block in a process simulator could be used to compute the yn's from the xn's. Then a bubble point or flash block could be used to determine the xn* values from the yn's.

Figure 1: Pseudo-binary McCabe-Thiele construction (methanol mole fractions only) for a distillation at F = 2.12, D = 1.19 and R = 1.45 gmol/min (RD = 1.2), feed to tray 3.
The trends in the Murphree efficiencies can be explained in terms of what is generally known about sieve tray efficiencies, especially about mass transfer rates and entrainment on sieve trays. For a glass column, it is easy to observe where the liquid flow rate is too low (an almost "dry" tray) or too high (entrainment of liquid). Either condition may be attributed to low tray efficiencies.
There is a range of Murphree efficiencies, the lower efficiencies being related to slow mass transfer rates or weeping ("dry" tray) or liquid entrainment in the vapor, or some combination of these (Table 1). Depending on the position of the tray, if it's at the top, there could be entrainment, or weeping at the lower trays. At the conditions of Table 1, Tray 2 was significantly more efficient than its counterparts, and visual observation showed it to be very frothy, so high in interfacial area. Tray 1 was even more frothy, but some entrainment could be observed. This behavior is a consequence of a low surface tension for an alcoholic mixture; on the top two trays, almost all the water had been removed, leaving behind mostly methanol with some isopropanol. The tray below it shows only 18% methanol efficiency; such a poor efficiency is sometimes found when a different compound (here, water) undergoes a profound concentration change on the tray.
Table 1: Liquid-Phase Murphree Tray Efficiencies, Methanol1
| Tray Number (from top) | XM
mole fraction |
YM
mole fraction |
XM*
mole fraction |
EML |
| 0 (distillate) | 0.76 | |||
| 1 | 0.69 | 0.76 | 0.61 | 43 |
| 2 | 0.58 | 0.70 | 0.54 | 74 |
| 3 | 0.56 | 0.64 | 0.48 | 18 |
| 4 | 0.53 | 0.63 | 0.47 | 33 |
| 5 | 0.51 | 0.61 | 0.44 | 29 |
| 6 | 0.49 | 0.57 | 0.40 | 29 |
| 7 (bottoms) | 0.39 | 0.55 |
1Conditions same as for Figure 1.
The experimental results were also simulated using NRTL thermodynamic (activity coefficient) parameters and an equilibrium simulator with a constant average tray efficiency that roughly reproduces measured compositions (bottoms, distillate, feed). The average column heat loss is ~400 W, and was incorporated into the simulation as a measured variable. As seen in Figure 2, assuming 100% efficiency (perfect equilibrium on all trays) captures the qualitative but not quantitative column behavior with respect to increasing vapor flow rate. The same should be true upon variation of the reflux ratio.
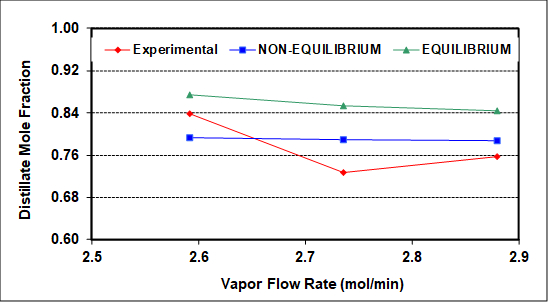
Figure 2: Experimental and simulated distillate compositions as a function of the rectifying section vapor rate (L + D). F = 2.12 gmol/min, RD = 1.2, feed to tray 3.
Figure 2 compares experimental distillate compositions (vs. vapor rate to the condenser) to the predicted results of equilibrium and non-equilibrium simulations of this column. The goal of the simulations was to match both distillate and bottoms compositions as closely as possible. The non-equilibrium simulator gives better predictions because it assumes and then calculates finite rates of mass transfer. Neither simulation can capture the exact behavior, possibly because neither accounts for entrainment, which as mentioned was clearly seen on the top two trays. There may also be slight experimental errors (especially for the middle experimental point), because no theory predicts a minimum at an intermediate vapor rate. Among possible causes of experimental error, it is difficult to measure accurately the low reflux flow rates with the turbine meter on the reflux stream.
Toepassing en samenvatting
Tray distillation columns are often of the sieve type, with small holes for the vapor flow and larger downcomers to route the liquid from tray to tray by gravity. More volatile components mostly exit in the distillate, although some of the top vapor is condensed and returned to the column as liquid reflux. It was shown that determining the Murphree tray efficiencies can be important in pinpointing problems on specific trays in distillation columns, such as low mass transfer rates, weeping or flooding. While higher vapor/reflux rates (higher RD) can improve mass transfer rates and eliminate weeping, if they are too high, the tray efficiencies will decrease due to liquid entrainment. In a previous experiment, it was observed (Figure 2) that any benefits of higher vapor rates were offset by the increased entrainment on the upper trays. This is because the experimental distillate mole fraction of the light component methanol actually decreased slightly with respect to vapor rate. Of course, at low RD, even equilibrium calculations, such as the McCabe-Thiele method, predict poorer component separation. Therefore, data taken at varying reflux ratio may show more variation in the distillate composition.
One common application of plate distillation is in oil refining. Many oil refineries use tray distillation to separate crude into multiple products. Typically the first major pieces of equipment in an oil refinery are the crude stills (usually one at atmospheric pressure and one or more operating under vacuum), which separate crude into LPG (liquefied petroleum gas, mostly propane-butanes), naphtha (which can be reformed to gasoline), kerosene (jet fuel), diesel and medium and heavy gas oil. The atmospheric boiling points on these fractions vary from ~30 - 400 °C.3 Other distillations are used to further refine the products.4 Chemical engineers working on these processes focus on obtaining the desired product mix and optimizing tray efficiencies.
Tray distillation columns are also used to distill ethanol.5 Through closely related processes, a variety of products such as fuel-grade ethanol, beer, and liquor can all be distilled (thus the name "distillery").5 While the ethanol/water separation is the most important, heavier fermentation products will also be removed in the bottoms. At atmospheric pressure, the distillate is limited to the azeotropic composition (95.5 wt% ethanol at 78.1°C). Further distillation requires a separate type of distillation known as azeotropic distillation, although further ethanol/water separation is possible using either an extraction agent or a good vacuum.5
The separation of air into N2, O2, Ar etc. requires cryogenic distillation.6 The air must be cooled below the critical temperature of O2 (-119 °C at 5.04 MPa) to obtain a liquid phase. Upon distillation the O2 is mostly in the bottoms and the N2 in the distillate. Either can then be shipped either in gas (pipeline) or liquid (refrigerated tankcar or truck) forms.6 Argon is the only other component of air commonly separated to obtain an almost pure product.
APPENDIX A

Figure 3. P&ID schematic of the Scott distillation system
referenties
- Encyclopedia of Chemical Engineering Equipment. Distillation Columns. http://encyclopedia.che.engin.umich.edu/Pages/SeparationsChemical/DistillationColumns/DistillationColumns.html. Accessed 10/01/16.
- W.L. McCabe, J.C. Smith, and P. Harriott, Unit Operations of Chemical Engineering, 7th Ed., McGraw-Hill, New York, 2005, Ch. 21 & 22, C.J. Geankoplis, Transport Processes and Unit Operations, 3rd Ed., 1993, Ch. 12, or J.D.Seader, E.J. Henley, D.K. Roper, Separation Process Principles, 3rd Ed., Wiley, 2010, Ch.6 & 7.
- Processing & Refining Crude Oil. Chevron Inc. http://pascagoula.chevron.com/abouttherefinery/whatwedo/processingandrefining.aspx . Accessed 10/01/16.
- A Simple Guide to Oil Refining. ExxonMobil Inc. http://www.exxonmobileurope.com/europe-english/files/simple_guide_to_oil_refining.pdf Accessed 10/14/16.
- R. Katzen, P.W. Madson and G.D. Moon Jr, Ethanol distillation: the fundamentals, in The Alcohol Textbook 3rd ed., K. Jacques, T.P. Lyons, and D.R. Kelsall, eds. Nottingham University Press, Nottingham, UK, pp. 269-288 (1999).
- History and Technological Progress: cryogenic Air Separation. The Linde Groups. https://www.linde-engineering.com/internet.global.lindeengineering.global/en/images/AS.B1EN%201113%20-%20%26AA_History_.layout19_4353.PDF. Accessed 10/01/16.
Ga naar...
Video's uit deze collectie:

Now Playing
The Effect of Reflux Ratio on Tray Distillation Efficiency
Chemical Engineering
77.5K weergaven

Testing the Heat Transfer Efficiency of a Finned-tube Heat Exchanger
Chemical Engineering
17.9K weergaven

Using a Tray Dryer to Investigate Convective and Conductive Heat Transfer
Chemical Engineering
43.8K weergaven

Viscosity of Propylene Glycol Solutions
Chemical Engineering
32.6K weergaven

Porosimetry of a Silica Alumina Powder
Chemical Engineering
9.6K weergaven

Demonstration of the Power Law Model Through Extrusion
Chemical Engineering
10.0K weergaven

Gas Absorber
Chemical Engineering
36.5K weergaven

Vapor-liquid Equilibrium
Chemical Engineering
88.2K weergaven

Efficiency of Liquid-liquid Extraction
Chemical Engineering
48.4K weergaven

Liquid Phase Reactor: Sucrose Inversion
Chemical Engineering
9.6K weergaven

Crystallization of Salicylic Acid via Chemical Modification
Chemical Engineering
24.2K weergaven

Single and Two-phase Flow in a Packed Bed Reactor
Chemical Engineering
18.9K weergaven

Kinetics of Addition Polymerization to Polydimethylsiloxane
Chemical Engineering
16.1K weergaven

Catalytic Reactor: Hydrogenation of Ethylene
Chemical Engineering
30.2K weergaven

Evaluating the Heat Transfer of a Spin-and-Chill
Chemical Engineering
7.3K weergaven
Auteursrecht © 2025 MyJoVE Corporation. Alle rechten voorbehouden