
Color Afterimages
Overview
Source: Laboratory of Jonathan Flombaum—Johns Hopkins University
Human color vision is impressive. People with normal color vision can tell apart millions of individual hues. Most amazingly, this ability is achieved with fairly simple hardware.
Part of the power of human color vision comes from a clever bit of engineering in the human brain. There, color perception relies on what is known as an 'opponent system.' This means that the presence of one kind of stimulus is treated as evidence for the absence of another, and vice versa; absence of one kind of stimulus is taken as evidence for the presence of the other. In particular, in the human brain there are cells that fire both when they receive signals to suggest that blue light is present, or when they do not receive signals suggesting yellow light. Similarly, there are cells that fire in the presence of yellow or the absence of blue. Blue and yellow are thus treated as opponent values in one dimension, and can be thought of as negative versus positive values on one axis of a Cartesian plane. If a stimulus is characterized as having a negative value on that axis, it can't also have a positive value. So, if it is characterized as yellow, it can't also be characterized as blue. Similarly, green and red (or really, magenta), occupy another opponent dimension. There are cells in the human brain that respond to the presence of one or the absence of the other. Figures 1 and 2 explain color opponency in Cartesian terms.

Figure 1. Opponent color dimensions. The human brain processes color using an opponent dimensions system. This is a two-dimensional plane with blue and yellow occupying one axis, which can be thought of as simply positive or negative, and red and green occupying the other axis. The consequence of the system is that the brain processes the presence of some colors as indicating the absence of others, and vice-versa. All perceivable colors occupy a point in the opponent space.
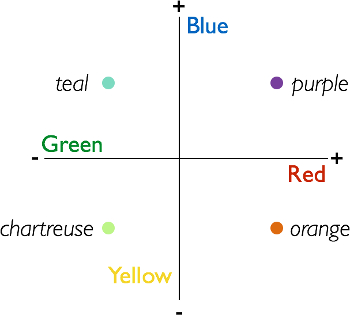
Figure 2. All perceivable colors occupy a point in the opponent space. Shown here are examples of colors that have nonzero values in each of two dimensions of the opponent space.
One way that color opponency was discovered-in 1878 by Ewald Hering, even before scientists had access to techniques for imaging the brain itself-is through an illusion known as a color afterimage. Afterimages are still used today both to demonstrate the opponent properties of human color perception and to study them.
This video demonstrates how to create a color afterimage illusion, and a simple way to collect subjective perceptual responses from human observers.
Procedure
1. Stimuli
- Open a blank white slide in a slide editor (software such as PowerPoint or Keynote will suffice).
- Use the shape tool to make two equally sized stars with no color fill, only a thin black outline. Center them vertically on the slide, and place one on each side (left and right).
- Place a small black disc in the center of the slide between the stars. This is the fixation point.
- Now, make a copy of this black and white slide. The second copy of it will be the second slide in your afterimage stimulus. Turn now to making the first slide by selecting the first of the two identical slides.
- Select the star on the left and fill it uniformly with a bright blue. Select the star on the right and fill it uniformly with a bright yellow.
- The stimulus is now ready. The first slide should be in color and the second should be entirely black and white. Figure 3 shows what the first slide should look like, and Figure 4 shows the second.

Figure 3. Slide #1 of a two-slide color afterimage. The first slide in an afterimage pair is in color. The dark disc in the center is the fixation point.

Figure 4. Slide #2 of a two-slide color afterimage. The second slide in an afterimage pair is in black and white. But observers will perceive illusory color inside the white fills of the objects in the frame (the stars in this case).
- Make additional stimuli for investigation following the same procedure. For example, make one with a red star on one side, and a green star on the other. Then, make one with a green star on one side, and a blue star on the other. Any other colors can be used as well.
- Each stimulus needs to include a color slide followed by an identical slide in black and white. Figure 5 shows two examples of additional slide pairs for inducing color afterimages.
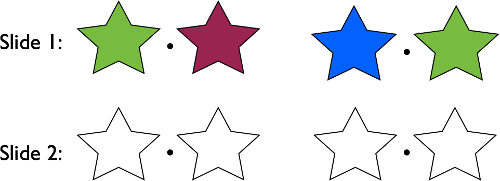
Figure 5. Two additional examples of slides for inducing color afterimages. The first slide in each pair (top row) is always in color. The second slide in each pair (bottom row) is always in black and white.
2. Generating the illusion
- To cause someone to experience the color afterimage illusion, seat them in front of the computer monitor.
- Load one of the color slides, e.g., the one with the blue and yellow stars.
- Ask the observer to fixate on the black disc in the center of the screen, and to avoid moving their eyes.
- Count out 10 s, then advance the slides forward so that the black and white slide replaces the color one.
- Instruct the participant to continue to maintain their fixation. They should see the white stars as filled in with the opponent colors of those that filled them in previously. So, the formerly blue star will look yellow, and the formerly yellow one will look blue. Figure 6 schematizes the relationship between the colors in the first slide and the illusory colors that will be perceived.

Figure 6. Illusory colors perceived in relation to a particular slide-pair. In Slide #1, the left star is blue and the yellow star is yellow. Slide #2 is actually black and white. But when toggled to after an observer has fixated on Slide #1, Slide #2 will be perceived with illusory colors. Specifically, the stars will appear filled in by the opponent colors from the ones filling them before, so the left star will be perceived as yellow, and the right one as blue.
- Once the observer moves their eyes, the illusion fades quickly.
- Note, it is easy to do this on one's self, and it works.
3. Collecting data
- As with many visual illusions, the effects are phenomenologically salient, and experienced by nearly all people. So, quantitative data serves mainly to affirm what one experiences.
- A simple technique for collecting data is to include an X someplace in the white region in the second slide in a pair, and to supply a set of color options for observers to pick from.
- The task is for the observer to select the color option they perceive where the X is placed. Figure 7 shows the sequence of events in one trial of the experiment.

Figure 7. Sequence of events in a single trial of a color afterimage experiment. The observer fixates on the center disc in Slide #1. After 10 s, the experimenter advances forward to Slide #2. The participant's task is to select the color among the displayed options that best matches the color they perceive in the position of the 'X.'
- To run a complete version of the experiment, use several different slide pairs. During each trial of the experiment, place an X in a different part of one of the objects in the second slide.
- Run 5-10 participants in an experiment with 10-20 trials. Tally up the color chosen as a function of the color that was present in an X's position in a trial's slide #1. In other words, relate the color perceived at the position of an X on a white background to the color previously in that position. The color previously in that position is called the 'inducer color,' and the color perceived is called the 'after-color.'
Results
For each of the inducer colors in the experiment, identify the most frequently selected after-color. Make a table that visualizes the results, like the one in Figure 8.
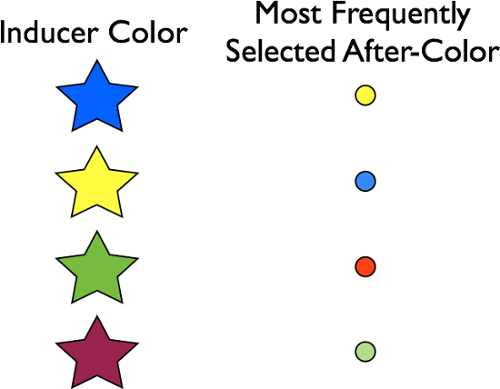
Figure 8. Representative result. Most frequently selected after-colors as a function of inducer colors. The most frequently perceived after-colors will be opponent values of the respective inducers.
The most frequently perceived after-colors should be opponent values of the respective inducer colors. The reason is because color-sensitive cells in the human brain are mapped spatially-they respond to specific regions of space dependent on where the subject fixates their eyes. Normally, people move their eyes around, causing different cells to share the burden of responding to regions of external space. By fixating the disc in the inducer images (slide #1 in each pair), the observer causes the same groups of cells to respond in a sustained way to the saturated colors present in a given region of external space. During the fixation period, these cells respond heavily. Blue-sensitive cells produce large blue signals, yellow-sensitive cells produce large yellow signals, and so on. When the black and white image is suddenly shown, and while the observer still fixates, these cells are no longer stimulated-there is no color in the image. But, because they were signaling so strongly a moment before, the rest of the brain interprets their sudden lack of activity as signaling the presence of an opponent color. The sudden lack of signaling in blue-sensitive cells is interpreted as the presence of yellow. The sudden lack of signaling in the yellow-sensitive cells is interpreted as the presence of blue, and so on. The brain interprets the absence of activity in color cells as indicating the presence of opponent colors, when in fact the lack of activity in this case is caused by the absence of color altogether. The brain is effectively tricked, causing people to see colors where there aren't any because of the way it organizes color in terms of opponent dimensions.
Application and Summary
Color opponency is among the great demonstrations of the scientific method. Researchers in the 1800s were able to infer the nature of color representation in the human brain without any ability to observe brain activity. Today, in fact, color afterimages have become a useful tool for identifying the brain regions involved in processing color. In monkeys, scientists have recorded neurons that fire as though color is present, when it is not, after showing the monkeys sequences of slides that produce afterimages in human observers.1,2 Similarly, with fMRI, scientists have found regions of visual cortex that respond selectively to presence of a color, and that also respond when that color is perceived as an illusion, induced by an afterimage pair of slides.
References
- Zeki, S. Colour coding in the cerebral cortex: the reaction of cells in monkey visual cortex to wavelengths and colours. Neuroscience, 9(4), 741-765 (1983).
- Conway, B. R., & Tsao, D. Y. Color architecture in alert macaque cortex revealed by FMRI. Cerebral Cortex, 16(11), 1604-1613 (2006).
Skip to...
Videos from this collection:

Now Playing
Color Afterimages
Sensation and Perception
11.1K Views

Finding Your Blind Spot and Perceptual Filling-in
Sensation and Perception
17.3K Views

Perspectives on Sensation and Perception
Sensation and Perception
11.8K Views

Motion-induced Blindness
Sensation and Perception
6.9K Views

The Rubber Hand Illusion
Sensation and Perception
18.3K Views

The Ames Room
Sensation and Perception
17.4K Views

Inattentional Blindness
Sensation and Perception
13.2K Views

Spatial Cueing
Sensation and Perception
14.9K Views

The Attentional Blink
Sensation and Perception
15.8K Views

Crowding
Sensation and Perception
5.7K Views

The Inverted-face Effect
Sensation and Perception
15.5K Views

The McGurk Effect
Sensation and Perception
16.0K Views

Just-noticeable Differences
Sensation and Perception
15.3K Views

The Staircase Procedure for Finding a Perceptual Threshold
Sensation and Perception
24.3K Views

Object Substitution Masking
Sensation and Perception
6.4K Views
Copyright © 2025 MyJoVE Corporation. All rights reserved