Turbidity and Total Solids in Surface Water
Overview
Source: Laboratories of Margaret Workman and Kimberly Frye - Depaul University
Turbidity and total solids are related measurements addressing clarity of surface waters. Turbidity is an indirect measure of water clarity that determines the amount of light that can pass through the water. Total solids is a direct measurement of solid particles suspended in water determined by weight.
High levels of turbidity and total solids are caused by soil erosion, waste discharge, runoff, or changes in ecological communities including algal growth or abundance of benthic organisms that can disrupt sediments up into the water. Higher levels of turbidity and suspended solids can lower water quality by absorbing heat causing an increase in water temperature and a decrease in oxygen levels (warm water holds less oxygen). These conditions can also cause a decrease in photosynthesis as less sunlight penetrates the water, making the water unable to support some aquatic life. Suspended solids can also clog gills, smother eggs, reduce growth rates, and disrupt microhabitats of many aquatic organisms.
One method of measuring turbidity includes using a Secchi disk. A Secchi disk is a metal disk with alternate black and white quarters (Figure 1). It is attached to a rope that has one-foot markings along it. The disk is dropped into water until it can no longer be seen (Figure 2). The drawback of this method is that it must be done in the field and ideal protocol requires sunny conditions and that the testing area be shaded. In addition, if there is a large distance between the riverbank and the water level, it is difficult to use the Secchi disk. By using turbidity tubes, one can collect water and then perform the turbidity measurements back in the laboratory.
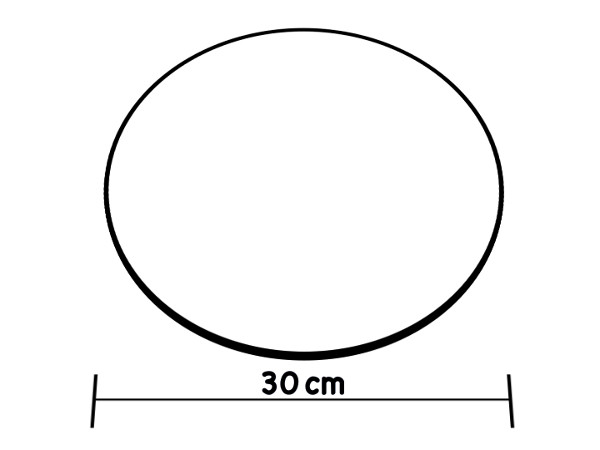
Figure 1. The modified Secchi disk design used in freshwater.
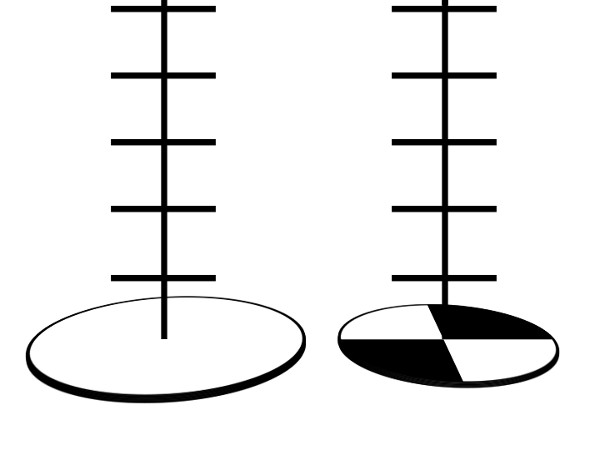
Figure 2. Different kinds of Secchi disk. A marine style one on the left and the freshwater version on the right
Principles
Turbidity is a relative measurement determined by measuring how much light can pass through the water sample. The higher the turbidity, the less light will pass through the sample and the “cloudier” the water will appear. Higher turbidity levels are caused by solid particles suspended in the water that scatter light rather than allow it to be transmitted through the water. The physical characteristics of suspended particles can have an effect on overall turbidity. Larger sized particles can scatter light and concentrate it a forward direction, increasing turbidity by creating interference with light transmission through the water. Particle size can also affect the quality of light; larger particle sizes tend to scatter longer wavelengths of light more than shorter wavelengths, whereas smaller particles have more scattering effect on shorter wavelengths. Increased particle concentration can also lower light transmission when light comes into contact with an increased number of particles and travels a shorter distance in between the particles, causing multiple scatterings with each particle. Darker colored particles absorb more light, whereas light colored particles can increase light scattering, and both result in increased turbidity measurements. Overall Darker particulates will result in higher turbidity than lighter colored particulates due to the increased amount of light energy absorbed by the color. The collected unknown water sample is compared to a de-ionized (DI) water blank sample that represents a turbidity value of zero. A purchased standard turbidity reagent (<1% kaolin, <0.1% magnesium nitrate, <0.1% magnesium chloride, < 0.1% 2-methyl-4-isothiazolin-3-one, < 0.1% 5-chloro-2-methyl-4-isothiazolin-3-one) is added to the blank test column in predetermined measurements to increase cloudiness in known increments until the blank and unknown sample match in turbidity based on observation of a fixed point on the bottom of two test columns. The amount of reagent required to achieve matching samples can then be converted with a table into Jackson Turbidity Units (JTUs), named after the original method of holding a long glass "Jackson" tube over a lit candle.
Total Solids is a direct measurement of the suspended solid material in the water sample. The mass of the solids is determined by using an oven to evaporate the water from the sample and isolate and weigh the solids.
Procedure
1. Measuring Turbidity
- Pour mixed sample water into one turbidity column and fill to the 50-mL line with the sample water.
- Fill the second “Blank” Turbidity Column with deionized water to the 50-mL line.
- Place the two tubes side by side and note the difference in clarity. If the black dot is equally clear in both tubes, the turbidity is zero. If the black dot in the sample tube is less clear, proceed to next step.
- Shake the Standard Turbidity Reagent.
- Add 0.5 mL of the reagent to the distilled water tube. Use the stirring rod to stir contents.
- Check for amount of turbidity by looking down through the solution at the black dot. If the turbidity of the sample water is greater than that of the distilled water, continue to add Standard Turbidity Reagent in 0.5-mL increments to the distilled water tube, recording the amount of reagent used and mixing after each addition until the turbidity equals that of the sample.
- Record the total amount of Turbidity Reagent added.
2. Measuring Total Solids
- With gloved hands, label a beaker with a grease pencil. Do not use labeling tape because these beakers are going into the oven.
- Turn on balance and tare it.
- Place the beaker on the balance and record the weight. Make sure to use a balance that records to the thousandths of a gram. Use gloves to avoid touching the beaker with bare hands and transferring body moisture, thereby changing the weight of the beaker.
- Using a graduated cylinder, measure 100 mL of the water sample. If the sample has been sitting, swirl the sample water before measuring out the 100 mL.
- Pour this amount into the beaker.
- Place the beaker in an oven at 100 °C for 48 h to evaporate the liquid and dry the resulting residue.
- After 48 h, reweigh the beaker with the residue. Remember: Don’t touch the beaker with bare hands.
- Subtract the initial weight (in grams) of the empty beaker from the weight of the beaker with residue to obtain the increase in weight, or weight of the residue.
- Convert the weight of the residue into mg/l using the following calculation
Weight of residue x 1,000 mg x 1,000 mL = ? mg
100 mL 1 g 1 L L
3. LabQuest Method for Measuring Turbidity
- Turn on a LabQuest handheld monitor and plug-in the turbidity sensor into Channel 1, units should be NTU.
- If units are not in NTU, use the stylus to touch the red area of the screen, select change units and choose NTU.
- If units are in NTU, open the lid of the sensor and wipe-off (using a laboratory wipe) and insert the bottle that’s already filled with black printing on it (100 NTU), close lid.
- Use the stylus to touch red area of screen and select Calibrate. When the calibration screen appears, select the Calibrate Now button (top left of the screen).
- The cursor should have jumped to the first value box. Watch the voltage in the upper right corner of the screen. When it settles, use the stylus and the number keypad to type in 100. Then select the Keep button below.
- The cursor should have jumped to the second value box. Now fill the second bottle with DI water (up to the line), cap-it, and wipe it off carefully using a laboratory wipe. Insert the DI water bottle into the sensor, and close the lid. When the voltage settles, type in 0 and press the Keep button.
- Then press the OK button at the bottom right of the screen. Calibration is complete.
- Discard the DI water from the second bottle and pour in just a splash of your water sample to rinse the bottle to rinse any remaining DI water and then discard sample rinse water. Then re-fill the bottle up tot the line with your water sample, re-cap, wipe-off (using laboratory wipes), and insert into the sensor. Close the lid and once the reading appears to settle, record the measurement.
4. LabQuest Method for Measuring Total Dissolved Solids Using Conductivity
- For Total Dissolved Solids (TDS) using conductivity: Be sure the switch on the box (attached to your probe cord) is set to the bottom setting (0-2,000).
- Plug the probe into channel 1. Units should be in milligrams per liter (mg/L).
- If units are not in mg/L, use the stylus to touch the red area of the screen, select change units and choose mg/L.
- If units are in mg/L, submerge the probe into your water sample and when the readings appear to stabilize record your measurement.
Results
The table below is used to convert amount of reagents into the turbidity units (JTU). (Table 1)
TURBIDITY
Excellent < 10 JTUs
Good 11 – 20 JTUs
Fair 21 – 90 JTUs
Poor > 90 JTUs
Total solids can be assessed using the Water Quality Monitoring Quantitative Analysis categories for total solids measurements.
TOTAL SOLIDS (mg/L)
Excellent <100
Good 101 – 250
Fair 251 – 400
Poor > 400
| Number of Measured Additions | Amount in mL | Turbidity (JTUs) |
| 1 | 0.5 | 5 |
| 2 | 1.0 | 10 |
| 3 | 1.5 | 15 |
| 4 | 2.0 | 20 |
| 5 | 2.5 | 25 |
| 6 | 3.0 | 30 |
| 7 | 3.5 | 35 |
| 8 | 4.0 | 40 |
| 9 | 4.5 | 45 |
| 10 | 5.0 | 50 |
| 15 | 7.5 | 75 |
| 20 | 10.0 | 100 |
Table 1. Turbidity Test Results Table to convert number of drops (turbidity reagent) to turbidity units (JTU) and the Water Quality Monitoring Quantitative Analysis categories for turbidity.
Application and Summary
Turbidity and total solids are important measurements of water quality because they are the most visible indicators of how “clean” a water-source is. High turbidity levels and total solids can indicate the presence of water pollutants that have an adverse effect on human, animal and plant life including bacteria, protozoa, nutrients (e.g. nitrates and phosphorus), pesticides, mercury, lead and other metals. Increased turbidity and total solids in surface water make water unpalatable for human use aesthetically and can also provide surfaces in the water for disease-causing microorganisms to grow harboring water-borne pathogens such as cryptosporidiosis, cholera and giardiasis. High amounts of suspended solids can also become be a problem to other species living in the water if particles become lodged into gills of oxygen-breathing animals in the water. Suspended particles can also disrupt light cycles and photosynthesis, altering the concentration of oxygen in the water and disturbing the aquatic system food web. Turbidity and total solids both increase at times when algal growth is high or when sediment is lifted up into the water during a storm. Both can also increase in response to human activity such as water pollution including industrial, agricultural, and residential runoff. Wastewater from sewage systems, urban runoff, and soil erosion from development can also contribute to high levels of turbidity and total solids. Easy to conduct at the site of water collection, these two simple measurements are broad indicators for a wide range of threats to water quality, all of which render surface water less useful for human purposes and also less able to support itself as an aquatic ecosystem.
Total solids are important to as use as a monitoring test for discharges from sewage treatment plants, industrial plants, or extensive crop irrigation. Areas where freshwater levels are low tend to have higher rates of evaporation and more vulnerable to higher concentrations of solids. Turbidity and total solids concentrations also tend to increase during rainfall events, especially in more highly developed areas with increased amounts of impervious surfaces and urban runoff.
Tags
Skip to...
Videos from this collection:

Now Playing
Turbidity and Total Solids in Surface Water
Environmental Science
35.8K Views

Tree Identification: How To Use a Dichotomous Key
Environmental Science
81.1K Views

Tree Survey: Point-Centered Quarter Sampling Method
Environmental Science
49.4K Views

Using GIS to Investigate Urban Forestry
Environmental Science
12.6K Views

Proton Exchange Membrane Fuel Cells
Environmental Science
22.0K Views

Biofuels: Producing Ethanol from Cellulosic Material
Environmental Science
53.1K Views

Testing For Genetically Modified Foods
Environmental Science
89.7K Views

Dissolved Oxygen in Surface Water
Environmental Science
55.7K Views

Nutrients in Aquatic Ecosystems
Environmental Science
38.8K Views

Measuring Tropospheric Ozone
Environmental Science
26.4K Views

Determination Of NOx in Automobile Exhaust Using UV-VIS Spectroscopy
Environmental Science
30.0K Views

Lead Analysis of Soil Using Atomic Absorption Spectroscopy
Environmental Science
125.4K Views

Carbon and Nitrogen Analysis of Environmental Samples
Environmental Science
29.4K Views

Soil Nutrient Analysis: Nitrogen, Phosphorus, and Potassium
Environmental Science
215.7K Views

Analysis of Earthworm Populations in Soil
Environmental Science
16.5K Views
Copyright © 2025 MyJoVE Corporation. All rights reserved