
Crowding
Overview
Source: Laboratory of Jonathan Flombaum—Johns Hopkins University
Human vision depends on light-sensitive neurons that are arranged in the back of the eye on a tissue called the retina. The neurons, called the rods and cones because of their shapes, are not uniformly distributed on the retina. Instead, there is a region in the center of the retina called the macula where cones are densely packed, and especially so in a central sub-region of the macula called the fovea. Outside the fovea there are virtually no cones, and rod density decreases considerably with greater distance from the fovea. Figure 1 schematizes this arrangement. This kind of arrangement is also replicated in the visual cortex: Many more cells represent stimulation at the fovea compared to the periphery.
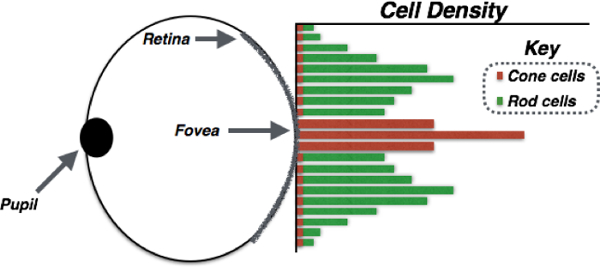
Figure 1. Schematic depiction of the human eye and the distribution of light-sensitive receptor cells on the retina. The pupil is the opening in the front of the eye that allows light to enter. Light is then focused onto the retina, a neural tissue in the back of the eye that is made of rods and cones, light-sensitive cells. At the center of the retina is the macula, and in the center of the macula is the fovea. The graph schematizes the density of rod and cone receptors on the retina as a function of their position. Cones, which are responsible for color vision, are found almost exclusively in the fovea. Rods, which support seeing in low-light conditions, are similarly clustered more heavily near the fovea, with quickly falling densities outside the macula.
The result: We see very well in the part of space that our eyes are pointing at directly, the part of space stimulating the fovea; but we actually don't see very well in the periphery. We don't really notice it though, because our eyes move around constantly, building a representation of space from many individual fixations.
One way to study the properties of peripheral vision is with a phenomenon known as crowding.1 Crowding refers to an inability to recognize objects in clutter, and we experience crowding especially strongly when objects are shown in the periphery. Figure 2a is an example in which you should be able to experience crowding: Look at the cross in the center, and see if you can report the letter that is in the middle of the pack on the right. It is probably pretty hard. Now in Figure 2b try to report the letter on the left. Much easier! In this figure the letter is not crowded and there is no clutter around it, so it is easier to recognize.

Figure 2a. Crowded stimulus. Fixate the cross in the center, and see if you can recognize the letter in the middle of the pack on the left. It should be difficult, because the letters are in the periphery, and the central letter is crowded by the letters around it.

Figure 2b. Uncrowded stimulus. This stimulus is identical to Figure 2a, except that the letter G is uncrowded-no other letters surround it. Even while fixating the cross, the letter should be easy to recognize, even though it is just as much in the periphery as the G in Figure 2a.
This video will demonstrate how to design and implement a crowding experiment with letters as stimuli.
Procedure
1. Stimuli and Design
- Trials will involve all English consonants, written in black and shown in 36 pt. Helvetica font.
- Each trial of the experiment will begin with a fixation cross presented in the center of the display for 500 ms, followed by stimuli presented to the right or left of the cross for 500 ms, and finally followed by a response screen. Figure 3 schematizes the experimental sequence.
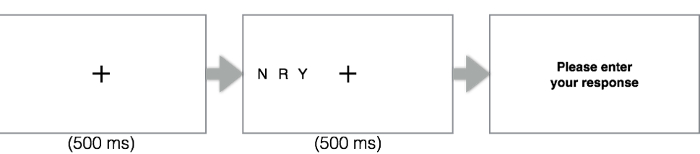
Figure 3. Trial sequence. The sequence of events in a single trial of the experiment is as follows: The participant fixates the central cross and presses the spacebar to initiate the trial. After 500 ms, the test stimulus appears either to the right or left of fixation, including three letters. The participant should avoid making eye movements, but should try to identify the letter in the center of the group. The letters disappear after 500 ms, at which point the participant is prompted to enter a responses reporting the letter that they saw in the middle of the group.

Figure 4. Variables for manipulation. There are two crucial variables that can be manipulated in a crowding experiment. The first is called the eccentricity, referring to the distance between the fixation cross and the target stimulus, in this case, the letter in the center of a group of three. The second variable is called the inter-stimulus spacing, which refers to the distance between the target letter and each of its neighbors. In an experiment, these two variables will usually be manipulated together, by a third derived variable called the relative spacing, defined as the ratio of the relative spacing to the eccentricity.
- The stimuli presented in each trial will always come in groups of three. Two variables will be manipulated in the experiment: (1) the distance between the fixation cross and the stimulus in the middle of the group of stimuli, a measure called the eccentricity; (2) the distance between the middle stimulus in the group and each of the other two, a measure called the inter-stimulus spacing. Figure 4 shows a sample trial and identifies these two variables.
- When preparing the experiment, these two variables will actually be controlled by a third variable derived from their ratio. We'll call that the relative spacing and define it as the inter-stimulus spacing divided by the eccentricity. Since it is a ratio defined over two variables with the same units, note that the relative spacing does not have units.
- Now, to sequence the experiment, program a set of 200 trials.
- Each trial will belong to one of four relative spacing conditions, with values of 0.25, 0.4, 0.5, and 0.75. In pixels, the following are the values we will use for the inter-stimulus spacing and the eccentricity in each condition, respectively: (100, 400); (50, 125); (75, 150); (600, 800). But note, any values can be used so long as they produce the desired ratios.
- Randomly intermix an equal number of trials from the four conditions. On each trial, randomly choose the three consonants to display, with the restriction that no letter is repeated in a single trial.
- Also program the experiment to show the stimuli to the right of fixation in half of the trials, and to the left of fixation in the other half.
- Be sure to program the experiment to report the relevant outputs, minimally for each trial: the trial number, the three letters shown, the relative spacing, the response supplied by the participant, and whether that response was right or wrong.
2. Running the Experiment
- To run the experiment, recruit participants.
- When a participant arrives in the lab, be sure to have her complete informed consent. Then seat the participant 60 cm from the computer monitor.
- For this experiment, it important to also have a chin rest.
- Instruct the participant to place their chin in the chin rest and to resist moving during trials. Let them know that the experiment is self-paced, and that they are free to move or rest between trials as they please.
- Explain the instructions to the participant as follows:
- "In this experiment, we are interested in investigating how easily we can recognize objects shown in the visual periphery. On each trial, I'd like you to fixate on the cross in the center of the screen, and do your best not to move your eyes. When you press the spacebar to start a trial, after 500 ms, three letters will appear on the screen either to the left or right of fixation. They will only remain on the screen for 500 ms, and they may be a little hard to see. Your task is to try your best to recognize the letter in the middle of the pack, that is, the letter presented between the two others. Remember, try not to move your eyes, even when the letters appear. After they disappear, enter the letter you saw in the middle using the keyboard. If you are unsure, just guess."
- Remain in the room with the participant while she completes a few trials. Then leave her to complete the experiment.
- Data analysis in this experiment is straightforward. Simply compute average letter recognition accuracy as a function of relative spacing. So just count up the number of trials in which the participant accurately recognized the central letter in each spacing condition, and divide by 50, since there were 50 trials for each spacing condition.
Results
Figure 5 graphs accuracy as a function of relative spacing. As relative spacing got bigger, performance improved by a lot. What this means is that performance benefits when the inter-stimulus spacing is at least half as big as the eccentricity. In fact, the idea that spacing needs to be half as big as eccentricity to prevent crowding is known as Bouma's Rule, after the scientist who discovered how the ratio between inter-stimulus spacing and eccentricity controls crowding. When the ratio is 0.5, as shown in the graph, performance is usually around 75% or better. Below 0.5, accuracy is often close to chance. Note that even with a relative spacing of 0.4, performance in this experiment was less than 25%, and with a relative spacing of 0.25, it was close to random. There are 21 consonants in English, so guessing would produce the right answer nearly 5% of the time.
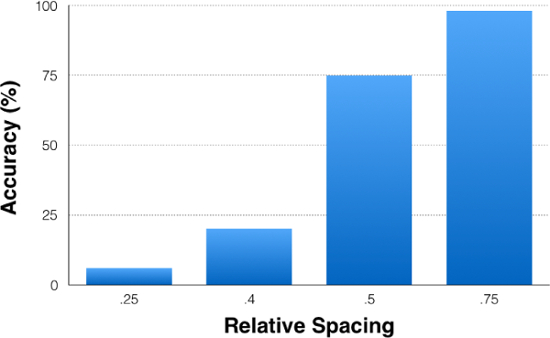
Figure 5. Results of the crowding experiment. Recognition accuracy was very poor, and at times close to chance in trials with a relative spacing less than 0.5. But for trials with spacing of 0.5 or greater, recognition was usually better than 75% accurate. 0.5 is generally the critical relative spacing that prevents crowding.
Variations
Now that you know the basics of running a crowding experiment, you can run an experiment to show that relative spacing is the crucial determinant of crowding. Here is how: Pick four eccentricity values, say 50, 100, 200, and 250 px. For each, identify the four inter-stimulus spacing values that will give you the relative spacing values from the previous experiment, i.e. 0.25, 0.4, 0.5, and 0.75. Now you have four different ways of producing the same relative spacing values but with different eccentricities. That's 16 conditions in total. Run an experiment with 50 trials of all 16 conditions, and plot the data as shown in the Figure 6. You should find that relative spacing is the crucial determinant of performance (as opposed to eccentricity).
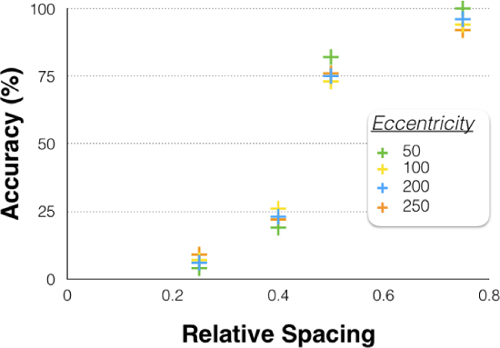
Figure 6. Results of a second crowding experiment designed to contrast the effects of eccentricity and relative spacing on performance. The x-axis displays the four relative spacing values used, and the different color icons represent the different eccentricities. If eccentricity were the primary constraint on recognition, then icons with the same color would tend to group together in terms of recognition accuracy. But instead, accuracy seemed to be governed by relative spacing.
Application and Summary
One reason that understanding crowding is important has to do with macular degeneration. Macular degeneration is a condition that mostly affects older adults, involving the degeneration of the macula, the densely populated part of the retina that includes the fovea. Macular degeneration is the leading cause of blindness in the US among people over 65. It leaves people heavily reliant on peripheral vision. Thus, research on crowding can help scientists to understand the limitations and affordances of peripheral vision, how to improve it, and generally how to design the environment to prevent crowding in important situations.
Understanding how crowding works also plays a role in how engineers, graphic designers, and web developers arrange many of the displays that people engage with on a daily basis. For example, when a pop-up or banner ad appears in your web-browser, it is often designed to catch your attention, but not be 100% readable or resolvable because of crowding-the people behind the scenes want you to move your eyes and look at the ad after it catches your attention.
Skip to...
Videos from this collection:

Now Playing
Crowding
Sensation and Perception
5.7K Views

Color Afterimages
Sensation and Perception
11.1K Views

Finding Your Blind Spot and Perceptual Filling-in
Sensation and Perception
17.3K Views

Perspectives on Sensation and Perception
Sensation and Perception
11.8K Views

Motion-induced Blindness
Sensation and Perception
6.9K Views

The Rubber Hand Illusion
Sensation and Perception
18.3K Views

The Ames Room
Sensation and Perception
17.4K Views

Inattentional Blindness
Sensation and Perception
13.2K Views

Spatial Cueing
Sensation and Perception
14.9K Views

The Attentional Blink
Sensation and Perception
15.8K Views

The Inverted-face Effect
Sensation and Perception
15.5K Views

The McGurk Effect
Sensation and Perception
16.0K Views

Just-noticeable Differences
Sensation and Perception
15.3K Views

The Staircase Procedure for Finding a Perceptual Threshold
Sensation and Perception
24.3K Views

Object Substitution Masking
Sensation and Perception
6.4K Views
Copyright © 2025 MyJoVE Corporation. All rights reserved