Determining Spatial Orientation of Rock Layers with the Brunton Compass
Source: Laboratory of Alan Lester - University of Colorado Boulder
Most rock units exhibit some form of planar surfaces or linear features. Examples include bedding-, fault-, fracture-, and joint-surfaces, and various forms of foliation and mineral alignment. The spatial orientation of these features form the critical raw data used to constrain models addressing the origin and subsequent deformation of rock units.
Although now over 100 years since its invention and introduction, the Brunton compass (Figure 1) remains a central tool in the modern geologist’s arsenal of field equipment. It is still the primary tool used to generate field data regarding the geometric orientation of planar rock surfaces or linear rock features. These orientation measurements are referred to as strike and dip, and provide the fundamental data for making geologic maps. Furthermore, the Brunton Compass can also function as a traditional compass for location exercises and triangulation. Finally, it can also serve as a pocket transit for measuring angular elevations.
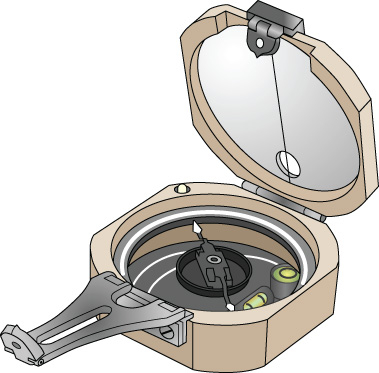
Figure 1. The Brunton compass.
Most rock layers (either sedimentary layering, igneous layering, or metamorphic banding/foliation) can be described as a planar surface in space. As such, the surface has an angular deviation from horizontal of anywhere between 0° and 90°. This angular deviation is known as “dip” (Figure 2). All rock surfaces that have greater than 0° dip have a linear intersection with an imaginary horizontal plane, and the compass direction of that linear intersection (the line formed by the intersection of the rock layer and a horizontal plane) is referred to as “strike” (Figure 3).
To determine the strike and dip of a rock surface, the Brunton compass must be properly prepared and then aligned with the surface being evaluated.
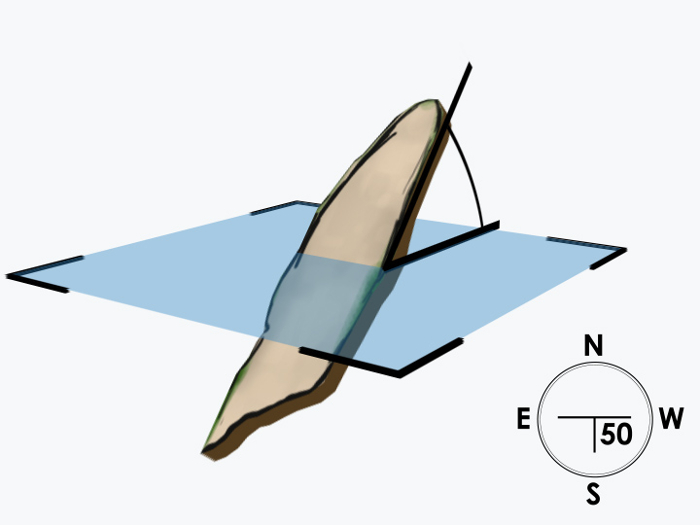
Figure 2. The dip, or deviation from the horizontal, of a geologic feature.
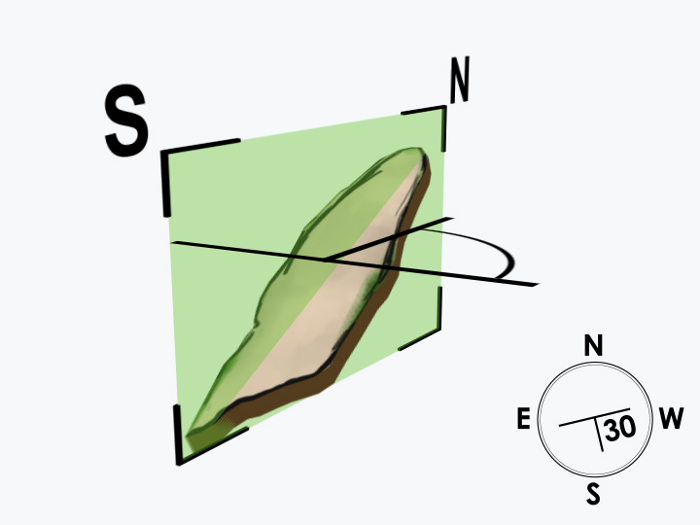
Figure 3. The strike, or deviation from North, of a geologic feature.
1. Preparation
- Check for free needle motion. Verify that the needle is unimpeded when held in the horizontal plane. Some compasses have restrictor buttons that hold the needle in place, and if present, check to see that pushing the restrictor does not move the needle.
- Check the “bull’s eye bubble” centering and continuity. This bubble is one of two leveling bubbles and is used to determine horizontality of the compass. The other bubble is used for inclination measurements.
- Check for correct magnetic declination setting. Since earth’s magnetic and geographic poles are not coincident, in order to accurately assess compass directions (relative to true North) the declination pin must be set to the correct magnetic declination for the location of usage.
2. Establish Suitable Representative Surface for Measurement
- In the field, a geologist must establish suitable representative surfaces for measurement. The idea is to approximate the overall orientation of the feature being evaluated (bedding, jointing, foliation, etc.) at this particular location. One of the simplest ways to do this is to place a notebook or clipboard onto the rock in this average and representative orientation.
In a lab demonstration, any flat surface can be used as a representative surface (a board/model on a desk, or an architectural element of a building).
3. Set the Compass on the Surface
- Next, the lower edge of the Brunton Compass is set upon the surface, such that the entire edge is flush with the surface.
4. Center the “Bull’s Eye Bubble”
- Without taking any part of this edge off the surface (a common mistake) the Brunton Compass is rotated until the “bull’s eye bubble” is centered.
5. Read the Azimith Orientation, or Measure Strike
- By centering the bull’s eye bubble, the Brunton Compass becomes aligned in the horizontal plane, and this allows for reading the azimith orientation of the line formed by the intersection of the rock surface and the horizontal—i.e. the definition of “strike”.
Note: By convention strike is measured in the northern quadrant. For example a direction of S30degE (30° to the east of due South) would be reported as N30W.
6. Measure Dip
- The final step is to measure dip. This is measured perpendicularly to the strike direction and is defined as the angular deviation of the surface from horizontal. For example, a nearly vertically oriented rock layer might have a dip magnitude of 85SE, indicating that the surface is dipping 85° from the horizontal, in a southeasterly direction.
Note: Dip direction is given in a general sense (NE, SE, SW, NW) because its exact direction is always 90° from strike.
A set of strike and dip data for a non-dipping rock layer has a range of values. The precision of a single measurement is, of course, linked to mechanical compass-errors and the experience of the compass-user. The accuracy of the final analysis is dependent on the uniformity of the natural surface (many nominally “flat-lying” rock layers have some degree of inherent surface undulations) and the number of total measurements taken.
Strike and dip data are initially recorded in field notebooks, and then transferred to tabulated form, and ultimately onto geologic maps (Figure 4). All geologic maps show the boundaries between rock units, and the strike and dip data (bar and stick symbols) provides the three-dimensional component, describing the spatial orientation of each rock unit.
Strike and dip of bedding, the most common kind of rock orientation data, is shown at a specific location with symbols like the ones below.
Besides strike and dip of bedding, there are many other sorts of planar and/or linear rock features that have strike and dip and some of these are shown in Figure 5.
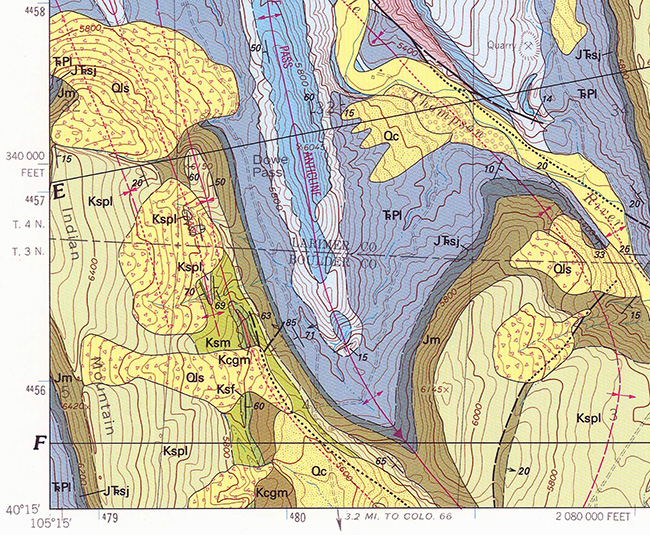
Figure 4. Strike and dip of bedding on a map. Strike and dip of bedding, the most common kind of rock orientation data, is shown at a specific location with symbols like the ones below.
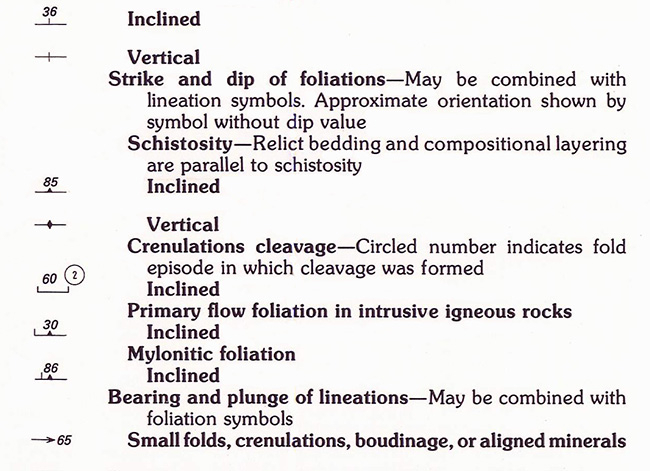
Figure 5. Strike and dip map key. Map key for planar and/or rock features demonstrating strike and dip.
Geologists strive to understand the earth in four-dimensions. The goal is to interpret the structure of rocks on the surface, in the subsurface, and through time. Strike and dip information generated by the Brunton Compass is the starting point with which geologists make geologic maps, and then those maps can be used to make cross sectional diagrams, showing the structures in the subsurface (Figure 6).
Understanding rock structures in the three spatial dimensions and also through time provides a window on the physical evolution of our planet. In addition, this kind of knowledge is central to many industrial and economic applications. One example is the identification of rock up-warps, where layers have been bent in domes or fold structures called anticlines— and it is at the apex of these structures that oil and gas often collect.
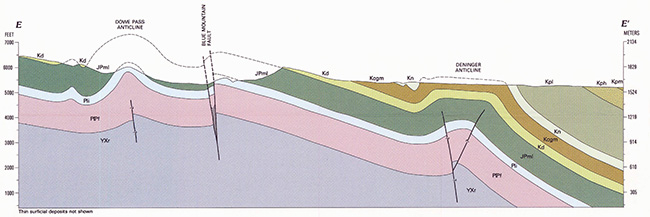
Figure 6. Geologic cross section. Geologic cross sections are representations of underground geology. The line (D-D’) on the map is the line along which the cross section was drawn. Anticlines, synclines, and faults can be seen in cross sections.
Skip to...
Videos from this collection:

Now Playing
Determining Spatial Orientation of Rock Layers with the Brunton Compass
Earth Science
25.5K Views

Using Topographic Maps to Generate Topographic Profiles
Earth Science
32.1K Views

Making a Geologic Cross Section
Earth Science
47.0K Views

Physical Properties Of Minerals I: Crystals and Cleavage
Earth Science
51.6K Views

Physical Properties Of Minerals II: Polymineralic Analysis
Earth Science
38.0K Views

Igneous Volcanic Rock
Earth Science
39.7K Views

Igneous Intrusive Rock
Earth Science
32.3K Views

An Overview of bGDGT Biomarker Analysis for Paleoclimatology
Earth Science
5.4K Views

An Overview of Alkenone Biomarker Analysis for Paleothermometry
Earth Science
7.2K Views

Sonication Extraction of Lipid Biomarkers from Sediment
Earth Science
8.8K Views

Soxhlet Extraction of Lipid Biomarkers from Sediment
Earth Science
18.5K Views

Extraction of Biomarkers from Sediments - Accelerated Solvent Extraction
Earth Science
8.9K Views

Conversion of Fatty Acid Methyl Esters by Saponification for Uk'37 Paleothermometry
Earth Science
10.1K Views

Purification of a Total Lipid Extract with Column Chromatography
Earth Science
12.4K Views

Removal of Branched and Cyclic Compounds by Urea Adduction for Uk'37 Paleothermometry
Earth Science
6.4K Views
Copyright © 2025 MyJoVE Corporation. All rights reserved