
Surface Dye Flow Visualization: A Qualitative Method to Observe Streakline Patterns in Supersonic Flow
Обзор
Flow visualization around or on a body is an important tool in aerodynamics research. It provides a method to qualitatively and quantitatively study flow structure, and it also helps researchers theorize and verify fluid flow behavior. Flow visualization can be divided into two categories: off-the-surface visualization and surface flow visualization. Off-the-surface flow visualization techniques involve determining the flow characteristics around the body of interest. They include but are not restricted to particle image velocimetry (PIV), Schlieren imaging, and smoke flow visualization. These techniques can provide qualitative as well as quantitative data on the flow around a body. However, these techniques are generally expensive and difficult to set-up. Surface flow visualization techniques, on the other hand, involve coating the body of interest with a dye to study flow on the surface. These techniques, which are more invasive in practice, include dye flow visualization and, more recently, use pressure-sensitive paint, which gives a detailed image of the flow on the body's surface. This allows researchers to visualize different flow features, including laminar bubbles, boundary layer transitions, and flow separation. Dye flow visualization, the technique of interest in the current experiment, provides a qualitative picture of the surface flow and is one of the simplest and most cost-effective surface flow visualization methods, specifically for visualizing gaseous flows on a body.
In this experiment, the surface flow behavior on six bodies are studied in supersonic flow. The streakline patterns are obtained using the dye flow visualization technique, and the flow paths, degree of flow attachment and separation, and location and type of shocks are identified and studied from the flow images.
Принципы
In dye flow visualization, fluid particles are marked with a dye to obtain the path that is traced by the particles as flow is introduced. The dye is a semi-viscous mixture of fluorescent dye particles and oil. The fluorescent dye colors the fluid particles and illuminates them when they are excited by a UV light source, and the oil helps maintain the flow patterns on the surface, even after the body is no longer exposed to flow. The dye flow visualization technique provides a very simple, cheap, and quick way to analyze the flow patterns over any surface.
Depending on the method of imaging, dye flow visualization can be used to find the streaklines as a result of the fluid flow. If the image is taken with prolonged exposure, the dye can be used to track the path taken by a single fluid particle as it moves in the flow. In the technique used in the current experiment, all fluid particles passing through a point or area are marked with a dye, and the line joining all the dyed particles after the body has been placed in an active flow is the streakline. Here, a single frame captured at the end of the flow visualization experiment provides enough information to study the general surface flow on the body. Dye visualization via streaklines, in addition to providing details on flow movement along the surface, also helps identify surface flow features. Using dye visualization in supersonic flow can identify flow separation, shock formation, and movement of flow across the body's surface, all of which are features that help to optimize the body aerodynamically.
Процедура
- Observing streaklines in supersonic flow
- Mix the fluorescent dye powder and mineral oil in a plastic bowl. Add small amounts of mineral oil to the dye in increments, mixing continuously until a semi-viscous mixture is obtained. The mixture should not be runny.
- Mount the sting above the supersonic wind tunnel test chamber and lock it into place. A blow-down supersonic wind tunnel with a 6 in x 4 in test section and an operating Mach number range of 1.5 to 4 was used in this demonstration, as shown in Figure 1. The Mach number is varied by adjusting the block setting (changing the area ratio of the test section).
- Screw the 2D wedge model onto the sting mount and fix the direction of the wedge such that the wedge surface is facing the transparent sidewalls of the wind tunnel test section. All models are shown in Figure 2.
- Use a paintbrush to apply a sufficient amount of the dye mixture onto the model. Ensure that the dye does not drip off of the model. See Figure 3 for reference.
- Adjust the block setting for the desired free-stream Mach number.
- Close and secure the wind tunnel panels.
- Run the wind tunnel for 6 seconds.
- After the run is complete, shine a UV light onto the model to illuminate the dye. Capture the streakline image with a camera.
- Adjust the angle of attack or Mach number according to the test matrix listed in Table 1 for model and repeat steps 1.4 - 1.9.
- Repeat steps 1.3 - 1.9 for all models listed in Table 1.
- When all models have been tested, shut down the wind tunnel, and dismantle the set-up.
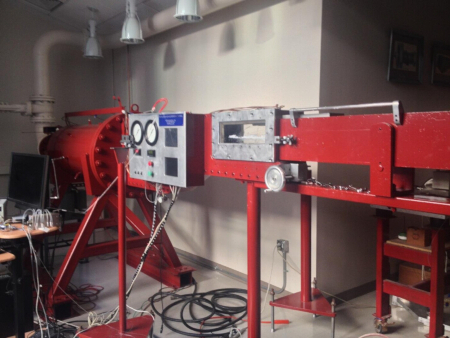
Figure 1. Blow-down supersonic wind tunnel.

Figure 2. Wind tunnel models (left to right) 2D wedge, 3D wedge, cone, blunt nose body, sphere, and missile.
Table 1. Test Matrix.
| Model | Angle of Attack (q) or Mach Number (M) setting |
| 2D 10° Wedge | θ = 0, 12, and -12° |
| 3D 10° Wedge | θ = 0, 12, and -12° |
| Cone | θ = 0, 13, and -13° |
| Blunt Nose Body | θ = 0, 11, and -11° |
| Missile | θ = 0 and 11° |
| Sphere | M = 2, 2.5, and 3 |
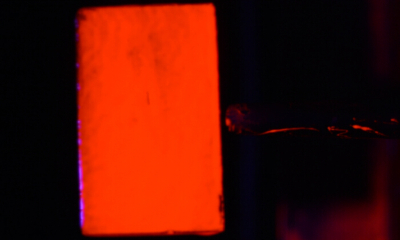
Figure 3. Representative image of fluorescent dye painted on the 2D wedge.
Результаты
The streakline flow patterns for the six models and conditions listed in Table 1 are shown below. For the 2D wedge, a uniform flow pattern is observed over the body, as shown in Figure 4, except in the region where there is a surface deformity, which causes the flow to separate. When angled at 12°, the flow along the surface is deflected upwards. This effect is mirrored when the model is angled at -12°. In general, all cases show attached flow across the entire surface, except at and behind the region of the surface deformity.

Figure 4. Streakline flow patterns over the 2D wedge (left to right) for Ɵ = 0°, 12°, and -12°.
Observations from Figure 5 show that while the flow patterns at the center of the 3D wedge are similar to that which was observed for the 2D wedge at all three angle settings, the flow patterns near the top and bottom edges show flow deflection. This could be attributed to the tip vortices at the edges of the wedge. While tip effects exist for the 2D wedge, the larger distance between the wedge center and the edge negates the effect of the tip on the central wedge flow. Additionally, the streaklines show no flow separation.
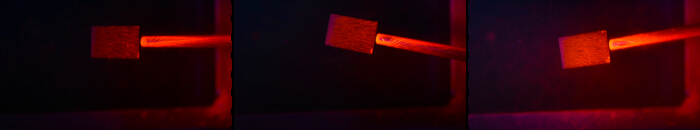
Figure 5. Streakline flow patterns over the 3D wedge (left to right) for Ɵ = 0°, 12°, and -12°.
Streakline flow patterns for the cone, shown in Figure 6, show streamlined, attached flow across the body for all angles of attack with the flow curving in the direction of the deflection. We also observe that flow separation occurs at the end of the cone, as indicated by the region where the dye clumps up.
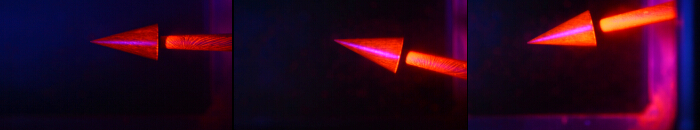
Figure 6. Streakline flow patterns over the cone (left to right) for Ɵ = 0°, 13°, and -13°.
Figure 7 compares the flow patterns over a blunt edge at three angles of attack. When Ɵ = 0°, we see attached flow over the entire body. At Ɵ = 11 and -11°, the flow curves around the body (following the surface contour) but separates along the line where the dye coalesces.
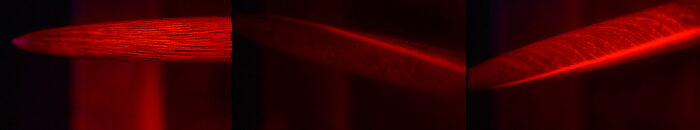
Figure 7. Streakline flow patterns over the blunt nose body (left to right) for Ɵ = 0°, 11°, and -11°.
While the flow patterns at the front of the missile are similar to those observed on the blunt nose body, the streaklines on the missile fins (Figure 8) show interesting flow features. At Ɵ = 0°, the streaklines on the top and bottom fins show attached flow at the front of the fin with gradual separation occurring in a cross pattern, which originates from the fin tips and roots. We also observe that flow detaches much earlier at the root of the fins as compared to the tips. Another interesting observation is made by studying the coalesced dye at the leading edge of the central fin. The streakline patterns indicate a bow shock with the shape of the shock marked by the dye. When the missile is angled at 11°, we observe fully attached flow on the bottom fin but separated flow close to the root of the top fin. Similar to the 0° case, the presence of the central fin causes a bow shock at the fins leading-edge.
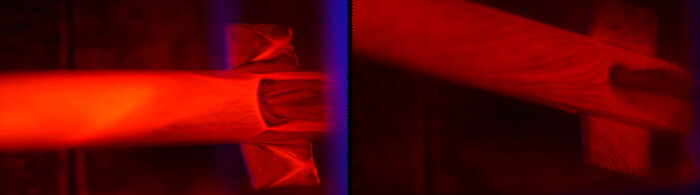
Figure 8. Streakline flow patterns over the missile (left to right) for Ɵ = 0° and 11°.
For the sphere, as the Mach number was varied, the flow patterns around the sphere remained the same, regardless of the deflection angle. Observations from Figure 9 show that as the Mach number increases, the region of separation (indicated by the area where the dye is not disturbed) decreases. This is because higher velocity flows have more momentum, which in turn allows the flow to overcome the adverse pressure gradient over the sphere. This causes a higher degree of flow attachment with increasing Mach number.

Figure 9. Streakline flow patterns over the sphere (left to right) M = 2, 2.5, and 3.
Заявка и Краткое содержание
Streakline flow patterns over six bodies in supersonic flow were studied using surface dye flow visualization. Flow patterns over the 2D and 3D wedges showed that tip effects play a dominant role in determining surface flow structure. Flow over the cone was shown to be fully attached for a deflection range of ±13°. The blunt nose model was the first body to show a clear separation line when deflected at an angle of 11°, a pattern that was also observed in the initial section of the missile. The flow patterns on the missile fins indicate interesting features, such as flow separation and shock formation. We also deduced the type of shock (bow-shock) that formed at the leading edge of the fin. Finally, varying the Mach number for flow over a sphere showed that the point of flow separation moves aft on the sphere with increasing flow velocity. Overall, the experiment demonstrated the simplicity and effectiveness of streakline dye flow visualization, a technique used by aerospace engineers in rapid-design processes to obtain more streamlined and efficient aero-vehicles.
Теги
Перейти к...
Видео из этой коллекции:

Now Playing
Surface Dye Flow Visualization: A Qualitative Method to Observe Streakline Patterns in Supersonic Flow
Aeronautical Engineering
4.9K Просмотры

Aerodynamic Performance of a Model Aircraft: The DC-6B
Aeronautical Engineering
8.3K Просмотры

Propeller Characterization: Variations in Pitch, Diameter, and Blade Number on Performance
Aeronautical Engineering
26.4K Просмотры

Airfoil Behavior: Pressure Distribution over a Clark Y-14 Wing
Aeronautical Engineering
21.1K Просмотры

Clark Y-14 Wing Performance: Deployment of High-lift Devices (Flaps and Slats)
Aeronautical Engineering
13.4K Просмотры

Turbulence Sphere Method: Evaluating Wind Tunnel Flow Quality
Aeronautical Engineering
8.7K Просмотры

Cross Cylindrical Flow: Measuring Pressure Distribution and Estimating Drag Coefficients
Aeronautical Engineering
16.2K Просмотры

Nozzle Analysis: Variations in Mach Number and Pressure Along a Converging and a Converging-diverging Nozzle
Aeronautical Engineering
37.9K Просмотры

Schlieren Imaging: A Technique to Visualize Supersonic Flow Features
Aeronautical Engineering
11.5K Просмотры

Flow Visualization in a Water Tunnel: Observing the Leading-edge Vortex Over a Delta Wing
Aeronautical Engineering
8.1K Просмотры

Pitot-static Tube: A Device to Measure Air Flow Speed
Aeronautical Engineering
48.8K Просмотры

Constant Temperature Anemometry: A Tool to Study Turbulent Boundary Layer Flow
Aeronautical Engineering
7.2K Просмотры

Pressure Transducer: Calibration Using a Pitot-static Tube
Aeronautical Engineering
8.5K Просмотры

Real-time Flight Control: Embedded Sensor Calibration and Data Acquisition
Aeronautical Engineering
10.2K Просмотры

Multicopter Aerodynamics: Characterizing Thrust on a Hexacopter
Aeronautical Engineering
9.1K Просмотры
Авторские права © 2025 MyJoVE Corporation. Все права защищены