
Clark Y-14 Wing Performance: Deployment of High-lift Devices (Flaps and Slats)
Overview
Source: David Guo, College of Engineering, Technology, and Aeronautics (CETA), Southern New Hampshire University (SNHU), Manchester, New Hampshire
A wing is the major lift-generating apparatus in an airplane. Wing performance can be further enhanced by deploying high-lift devices, such as flaps (at the trailing edge) and slats (at the leading edge) during takeoff or landing.
In this experiment, a wind tunnel is utilized to generate certain airspeeds, and a Clark Y-14 wing with a flap and slat is used to collect and calculate data, such as the lift, drag and pitching moment coefficient. A Clark Y-14 airfoil is shown in Figure 1 and has a thickness of 14% and is flat on the lower surface from 30% of the chord to the back. Here, wind tunnel testing is used to demonstrate how the aerodynamic performance of a Clark Y-14 wing is affected by high-lift devices, such as flaps and slats.

Figure 1. Clark Y-14 airfoil profile.
Principles
An airplane's speed is relatively low during takeoff and landing. To generate sufficient lift, it is necessary to increase the wing area and/or change the airfoil shape on the leading and trailing edges of the wing. To do this, slats are used on the leading edge, and flaps are used on the trailing edge. The flaps and slats can move into or out of the wings. Deploying the flaps and the slats has two effects; it increases the wing area and the effective camber of the airfoil, which increases the lift. In addition, the deployment of flaps and slats also increases the dragof the aircraft. Figure 2 shows cruise, takeoff and landing configurations of a wing with a flap and a slat.

Figure 2. Various wing flap and slat configurations.
During flight, the wing of an airplane is continually subjected to a resultant aerodynamic force and moment, as shown in Figure 3(a). The resultant force, R, can be decomposed into two components. Typically, one component is along the direction of the far-stream velocity, V∞, which is called drag, D, and the other component is perpendicular to the direction, which is called lift, L.
The moment, M, moves the nose of the airplane up or down, thus, it is called the pitching moment. In wind tunnel testing, the normal and axial forces are typically measured directly. The normal, N, and axial forces, A, are related to lift and drag through the angle of attack, α, as shown in Figure 3(b). The angle of attack, is defined as the angle between the far-stream velocity direction and the chord of the wing airfoil.
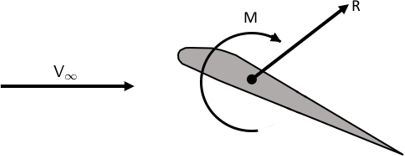
Figure 3(a). Resultant aerodynamic force and moment.

Figure 3(b). The decomposition of the resultant force, R.
The two force pairs can also be expressed as follows:


where α is the angle of attack.
The non-dimensional lift coefficient, CL, for a wing is defined as:
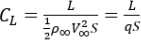
where L is the lift, 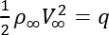 is the dynamic pressure based on the free-stream density, ρ∞, and airspeed, V∞, and S is the reference area of the wing.
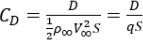
Similarly, the non-dimensional drag coefficient for a wing is defined as:
The resultant aerodynamic force from lift and drag is located at a point on the wing (or airfoil) called the center of pressure. However, the location of the center of pressure is not a fixed location, rather, it moves based on the angle of attack. Therefore, it is convenient to move all forces and moments to approximately the quarter chord point (a distance 1/4 of the chord length from the leading edge). This is called the pitching moment about quarter chord, Mc/4.

Figure 4. Pitching moment about quarter chord.
The pitching moment coefficient, CM,c/4, about quarter chord is defined as:

where Mc/4 is the pitching moment about quarter chord, and c is the chord length of the wing.
Wing performance relies on the Reynolds number, Re, which is defined as:

where the parameter μ is the dynamic viscosity of the fluid.
In this demonstration, the performance of a Clark Y-14 wing with a simple flap and a simple slat is evaluated in a wind tunnel, as shown in Figure 4. The wing is installed to a device called a sting balance, which is shown in Figure 5 and measures the normal force, N, and the axial force, A.
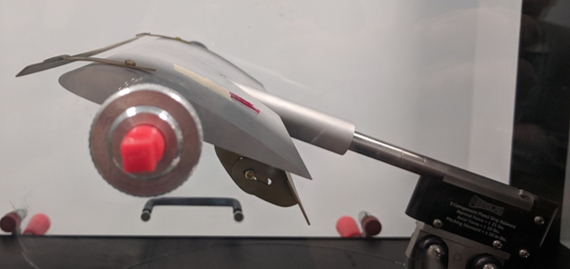
Figure 5. Clark Y-14 wing with a flap and a slat.
Procedure
- For this procedure, use an aerodynamics wind tunnel with a test section of 1 ft x 1 ft and a maximum operating airspeed of 140 mph. The wind tunnel must be equipped with a data acquisition system (able to measure angle of attack, normal force, axial force and pitching moment) and a sting balance.
- Open the test section, and install the wing on the sting balance. Start with clean wing configuration.
- Place a handheld inclinometer on the sting balance, and adjust the pitch angle adjustment knob to set the sting balance pitch to horizontal.
- With the sting balance horizontal, tare the angle of attack (it is called pitch angle in the wind tunnel computer data display panel).
- Tare all force, moment and airspeed readings at zero angle of attack.
- Adjust the angle of attack to -8°, and collect no wind measurements by recording all normal force, axial force and pitching moment readings.
- Repeat the no-wind measurements for pitch angles ranging from -8° to 18°, with 2° increments.
- Return the angle of attack to -8°, and run the wind tunnel at 60 mph. Collect readings of the normal force, axial force and pitching moment from -8° to 18° with 2° increments.
- Adjust the wing to the second configuration with the slat adjusted to have about 3/8 in slot. Repeat steps 3 - 8.
- Adjust the wing to the third configuration, with the flap set to 45° with respect to the chord line, and the slat not deployed. Repeat steps 3 - 8.
- Adjust the wing to the fourth configuration with both the slat and flap deployed (Figure 5). Repeat steps 3 - 8.
Results
The results of the clean wing configuration are shown in Table 1. Figures 6 - 8 show all three coefficients vs angle of attack, α, for all four configurations. From Figure 6, both the flap and slat enhanced the lift coefficient, but in different ways. Comparing the clean wing and the slat lift curve, the two curves are almost overlapping at low angles of attack. The clean wing lift curve peaks to about 0.9 at 12°, but the slat curve continues to rise to 1. 4 at 18°. This indicates that slats can be used to increase lift. When comparing the clean wing and flap lift curves, the flap increases lift over the entire angle of attack range. And if both the slat and flap are deployed at the same time, the effect is cumulative and the maximum lift is even higher.
In comparing the drag coefficient for each configuration in Figure 7, the drag coefficient increases dramatically when both the flap and slat are deployed. Finally, as shown in Figure 8, the pitching moment coefficient goes into the negative regime when the flap is deployed. This means that the center of pressure shifts towards the trailing edge with the flap deployed.
Table 1. Experimental results for the clean wing configuration.
| Angle of attack (°) | Lift coefficient, CL | Drag coefficient, CD | Pitching moment coefficient, CM,c/4 |
| -8 | -0.022 | 0.015 | -0.129 |
| -6 | -0.029 | 0.014 | -0.059 |
| -4 | 0.096 | 0.016 | -0.059 |
| -2 | 0.208 | 0.011 | -0.054 |
| 0 | 0.353 | 0.006 | -0.065 |
| 2 | 0.460 | 0.004 | -0.053 |
| 4 | 0.548 | 0.032 | -0.051 |
| 6 | 0.708 | 0.015 | -0.062 |
| 8 | 0.789 | 0.025 | -0.061 |
| 10 | 0.849 | 0.031 | -0.061 |
| 12 | 0.873 | 0.045 | -0.056 |
| 14 | 0.856 | 0.058 | -0.089 |
| 16 | 0.803 | 0.080 | -0.125 |
| 18 | 0.803 | 0.092 | -0.128 |

Figure 6. Lift coefficient vs angle of attack, α.

Figure 7. Drag coefficient vs angle of attack, α.

Figure 8. Pitching moment coefficient vs angle of attack, α.
Table 2. Parameters used for calculations.
| Parameters | Values |
| Air density, ρ | 0.00230 slug/ft3 |
| Water density, ρL | 1.935 slug/ft3 |
| Gravitational acceleration, g | 32.17 ft/s2 |
| Viscosity, m | 3.79 x 10⁻⁷ lbf s/ft2 |
| Free-stream airspeed, V∞ | 60 mph |
| Reynolds number, Re | 1.56 x 10⁵ |
| Chord length, c | 3.5 in |
| Wing area, S | 35 in2 |
Application and Summary
Lift generation can be enhanced by the deployment of high-lift devices, such as flaps and slats. Most airplanes are equipped with flaps, and all commercial transport airplanes have both flaps and slats. It is critical to characterize the performance of a wing with flaps and slats during aircraft development.
In this demonstration, a Clark Y-14 wing with a flap and a slat was evaluated in a wind tunnel. The forces and moment measurements were collected to determine the lift, drag and pitching moment coefficients of the wing with and without flap and slat deployment. The results demonstrate that the lift coefficient increases when the flap and slat are deployed. However, this also resulted in a dramatic increase in the drag and pitching moment.
References
- John D. Anderson (2017), Fundamentals of Aerodynamics, 6th Edition, ISBN: 978-1-259-12991-9, McGraw-Hill
Skip to...
Videos from this collection:

Now Playing
Clark Y-14 Wing Performance: Deployment of High-lift Devices (Flaps and Slats)
Aeronautical Engineering
13.4K Views

Aerodynamic Performance of a Model Aircraft: The DC-6B
Aeronautical Engineering
8.3K Views

Propeller Characterization: Variations in Pitch, Diameter, and Blade Number on Performance
Aeronautical Engineering
26.5K Views

Airfoil Behavior: Pressure Distribution over a Clark Y-14 Wing
Aeronautical Engineering
21.2K Views

Turbulence Sphere Method: Evaluating Wind Tunnel Flow Quality
Aeronautical Engineering
8.7K Views

Cross Cylindrical Flow: Measuring Pressure Distribution and Estimating Drag Coefficients
Aeronautical Engineering
16.2K Views

Nozzle Analysis: Variations in Mach Number and Pressure Along a Converging and a Converging-diverging Nozzle
Aeronautical Engineering
38.0K Views

Schlieren Imaging: A Technique to Visualize Supersonic Flow Features
Aeronautical Engineering
11.7K Views

Flow Visualization in a Water Tunnel: Observing the Leading-edge Vortex Over a Delta Wing
Aeronautical Engineering
8.2K Views

Surface Dye Flow Visualization: A Qualitative Method to Observe Streakline Patterns in Supersonic Flow
Aeronautical Engineering
4.9K Views

Pitot-static Tube: A Device to Measure Air Flow Speed
Aeronautical Engineering
49.2K Views

Constant Temperature Anemometry: A Tool to Study Turbulent Boundary Layer Flow
Aeronautical Engineering
7.3K Views

Pressure Transducer: Calibration Using a Pitot-static Tube
Aeronautical Engineering
8.5K Views

Real-time Flight Control: Embedded Sensor Calibration and Data Acquisition
Aeronautical Engineering
10.3K Views

Multicopter Aerodynamics: Characterizing Thrust on a Hexacopter
Aeronautical Engineering
9.2K Views
Copyright © 2025 MyJoVE Corporation. All rights reserved